Elliott Wave Theory is a scientifically unproven technical analysis indicator used to attempt to predict price movements in financial markets.
Based on my testing, I highly recommend avoiding using this indicator for stock trading.
Elliott Wave has an avid following among technical traders, but it has serious reliability limitations in trading. This means it is unproven and cannot be backtested for accuracy.
Exercise caution before adopting it as part of any trading strategy. This article and videos will explain Elliott Waves and share the harsh realities about its efficacy and reliability.
Research Findings
- Elliott Wave is difficult to backtest for efficacy or reliability.
- Modern pattern detection charting software cannot test Elliott waves.
- Elliot wave should not be used for buy and sell signals.
- There are no documented systematic ways to prove its profitability.
Who Created Elliott Wave Theory?
The Elliott Wave Theory was created by Ralph Nelson Elliott (1871-1948). He found that stock market prices moved in repeating patterns, which he called waves. After years of research, he published his findings in The Wave Principle in 1938.
The Elliott Wave Theory is based on the notion that stock prices move in repeating patterns or waves. These waves can be classified into two distinct categories – impulse and corrective waves. Impulse waves are the major price movements in a particular direction, while corrective waves move against them. The theory also states that market trends are composed of five waves in the direction of the main trend, followed by three corrective waves.
Therefore, according to the Elliott Wave Theory, stock prices move in a series of up and down movements, or ‘waves,’ which repeat themselves over time. This theory can identify potential turning points in a particular stock’s price, allowing traders to make better-informed decisions when entering or exiting a position. To successfully use the Elliott Wave Theory, it is important to understand the different types of waves and how they interact.
What Is The Elliott Wave Principle?
The Elliott Wave Principle states that financial markets are dynamic systems composed of repeating and evolving patterns that can be identified and used for effective trading strategies. According to the principle, market prices move in waves reflecting the security’s underlying sentiment and direction.
The Elliott Wave Theory provides traders an insight into the potential highs and two corrective waves (numbered 2 and 4). Impulse waves move in the direction of the larger trend, while corrective waves move against it. Analyzing these wave patterns can provide valuable information about when to enter or exit a position.
What Is Elliott Wave Theory?
In Elliott’s wave theory, the hypothesis suggests that any major market move is a cycle, and there are 8 Waves inside every cycle. The cycle is the first leg of a primary bull market or bear market. It proposes that market trends move in a five-wave sequence in the direction of the main trend, followed by a three-wave counter-trend. These wave patterns are fractal, meaning they can repeat at different scales or degrees of trend.
My thorough testing awarded TradingView a stellar 4.8 stars!
With powerful stock chart analysis, pattern recognition, screening, backtesting, and a 20+ million user community, it’s a game-changer for traders.

Whether you're trading in the US or internationally, TradingView is my top pick for its unmatched features and ease of use.
Explore TradingView – Your Gateway to Smarter Trading!
Elliott Cycles
As with the business cycle, there are times of growth and decline, largely attributed to the macroeconomic situation, specifically monetary and fiscal policy. For example, an Elliott Wave cycle could be the first bull market in an economy emerging from a recession. Or it could be the second bull market after a market retracement during a strong overall economic revival.
Elliott Waves
The basic five-wave pattern consists of three impulse waves (numbered 1, 3, and 5) and two corrective waves (numbered 2 and 4). Each wave has specific characteristics that help Elliott Wave practitioners identify where a current trend is heading. For instance, impulse waves typically move in the same direction as the overall trend, while corrective waves tend to retrace some of the prior gains. Elliott Wave theorists believe that markets usually move in five-wave patterns and then correct themselves in three-wave patterns, which gives us an idea of how the markets may move in the future.
The Elliott Wave theory is based on the assumption that prices move according to certain identifiable trends and that these trends can be used to predict future price movements. The theory suggests that once a trend has been identified, traders can use it as a guide to make more informed trading decisions. The theory also states that prices move in five-wave patterns, with three waves moving in the direction of the trend and two waves retracing against it.
How to Remember Elliott Wave Patterns
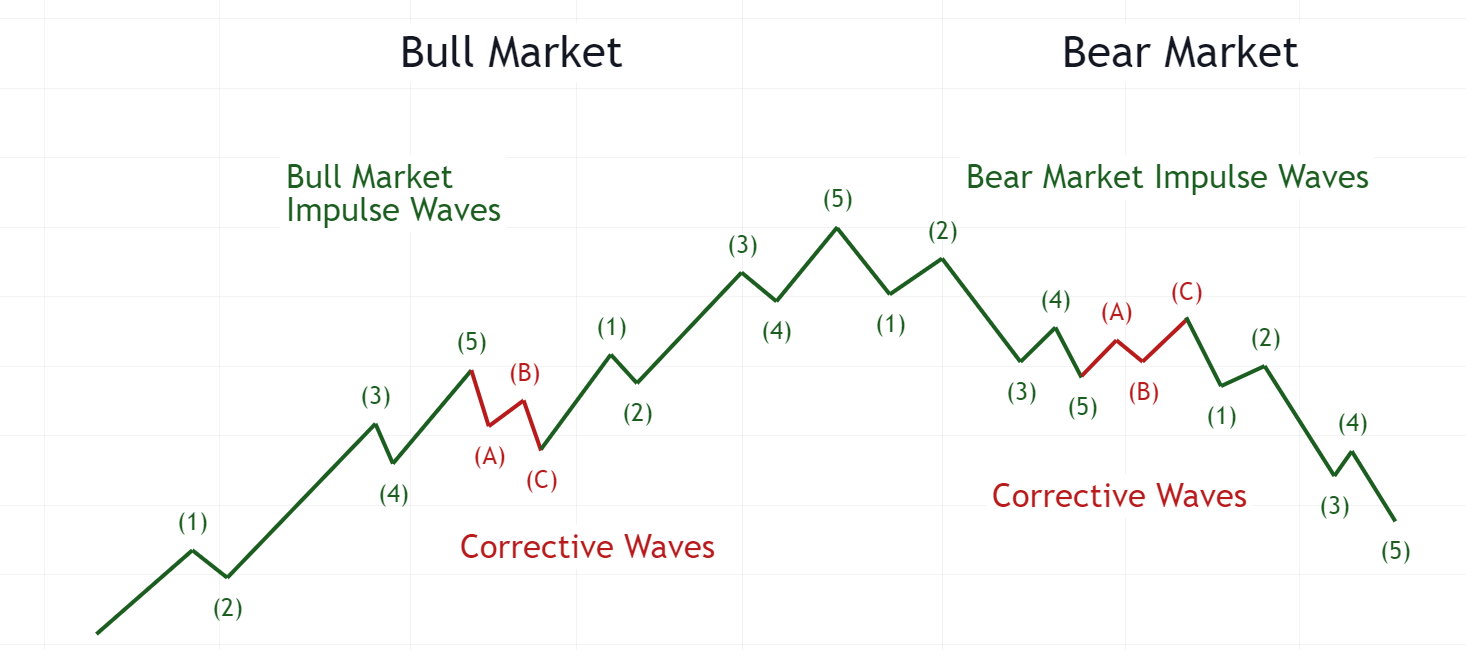
The easy way to remember Elliott Wave Patterns is 1,2,3,4,5 and ABC. The 1 2 3 4 5 is the primary impulse wave up, and the A B C is the market pullback or corrective wave. There is a cycle in any market move, with 8 waves inside the cycle. (See chart below)
Example: Elliott Wave Chart
In this Elliott Wave chart example, each wave is labeled with a number (1-5) and either an “A,” “B,” or a “C.” This helps to identify the different phases of the market cycle easily. In addition, traders can use the Elliott Wave Theory to anticipate future market direction based on the current wave structure.

Try TradingView’s Automatic Elliott Wave Indicator Free
Understanding how these waves interact makes it easier to anticipate the next move, allowing traders to take advantage of any potential opportunities. The theory can also be used as a tool for risk management, helping traders stay on top of their trades and protect against losses.
How Does Elliott Wave Theory Work?
Elliott Wave theory works on the principle that market prices move in predictable patterns, which traders can identify and use as an indicator for future price movements. By counting the number of waves, a trader can anticipate the future market direction and make informed decisions about when to buy and sell.
3 Phases of Elliott Waves
Elliott Wave Theory is based on the idea that markets move in three phases: an impulse phase, a corrective phase, and a terminal phase. The impulse phase includes five waves of price movement – three of which move in the direction of the trend and two of which move against it. The corrective phase consists of three waves that move opposite the direction of the trend, followed by a terminal phase with five more waves that follow the original trend. By recognizing these patterns, traders can identify and trade with trends to maximize profits and minimize losses.
Example: Elliott Wave Patterns in Bull & Bear Markets
The most important element is that Elliott’s impulse waves (1-2-3-4-5) move up in a bull market, and the corrective waves (1-2-3) move down. In a Bear market, the impulse waves (1-2-3-4-5) move down, and the corrective waves (1-2-3) move up.
Try TradingView’s Elliott Wave Pattern Recognition
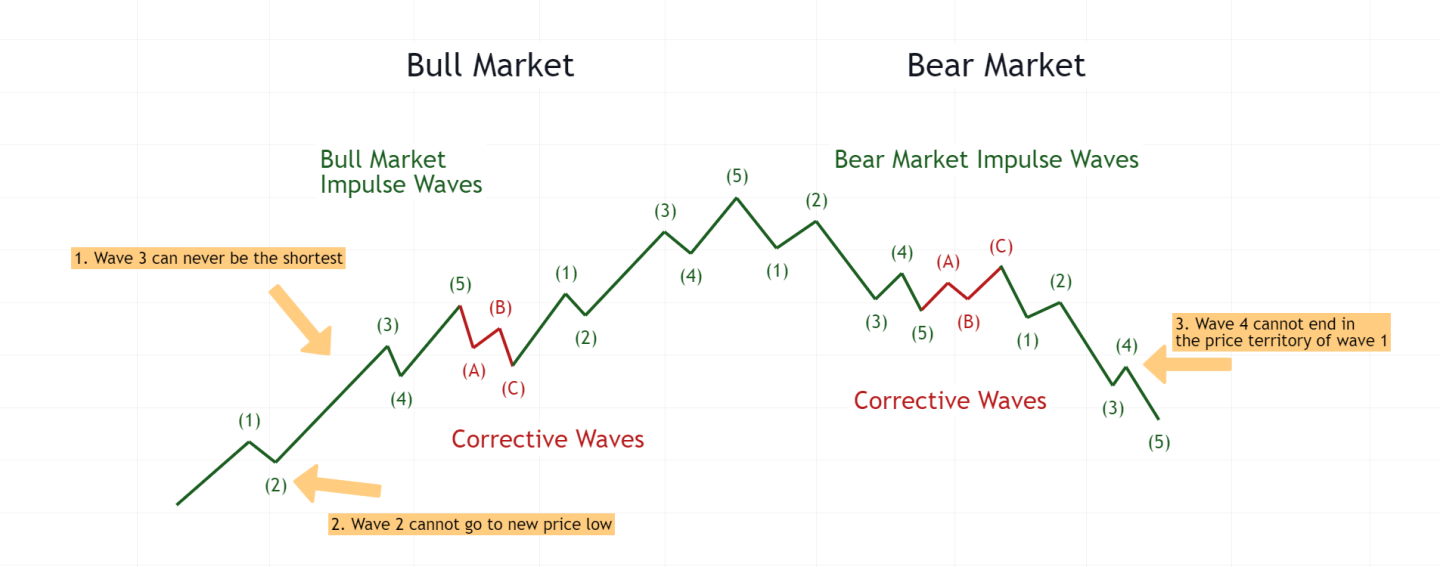
The 5 Elliott Wave Rules:
- Wave 3 is never the shortest.
- Wave 2 never extends further than wave 1.
- Wave 4 cannot enter the price territory of wave 1.
- An Impulse Wave always divides into 5 impulse sub-waves.
- Wave 3 always ends higher than wave 1.
These rules can be applied to bull and bear markets to help traders identify possible entry points during the trend. Additionally, traders should pay attention to Fibonacci Retracements levels and chart patterns, such as Double Bottoms, Head & Shoulder formations, for additional support in trading decisions.
What are A B C Elliott Waves?
The A B C Elliott Wave is a corrective wave pattern consisting of three sub-waves: A, B, and C. The A-wave typically retraces the previous impulse wave, while the B-wave corrects the A-wave, and finally, the C-wave completes the correction by continuing the original trend. This wave pattern can appear in both bull and bear markets, and it is used to identify possible entry points for traders and potential objectives for closing positions.
Example: Elliott Wave Bull & Bear Markets
How to Automatically Detect Elliott Wave Patterns
You can automatically detect Elliott Wave patterns using specialized software. I recommend TradingView’s automated chart pattern recognition; it’s free and available for all registered users. You can also use the popular MT4 platform to analyze Elliott Wave patterns.
TradingView’s Elliott Wave Indicator
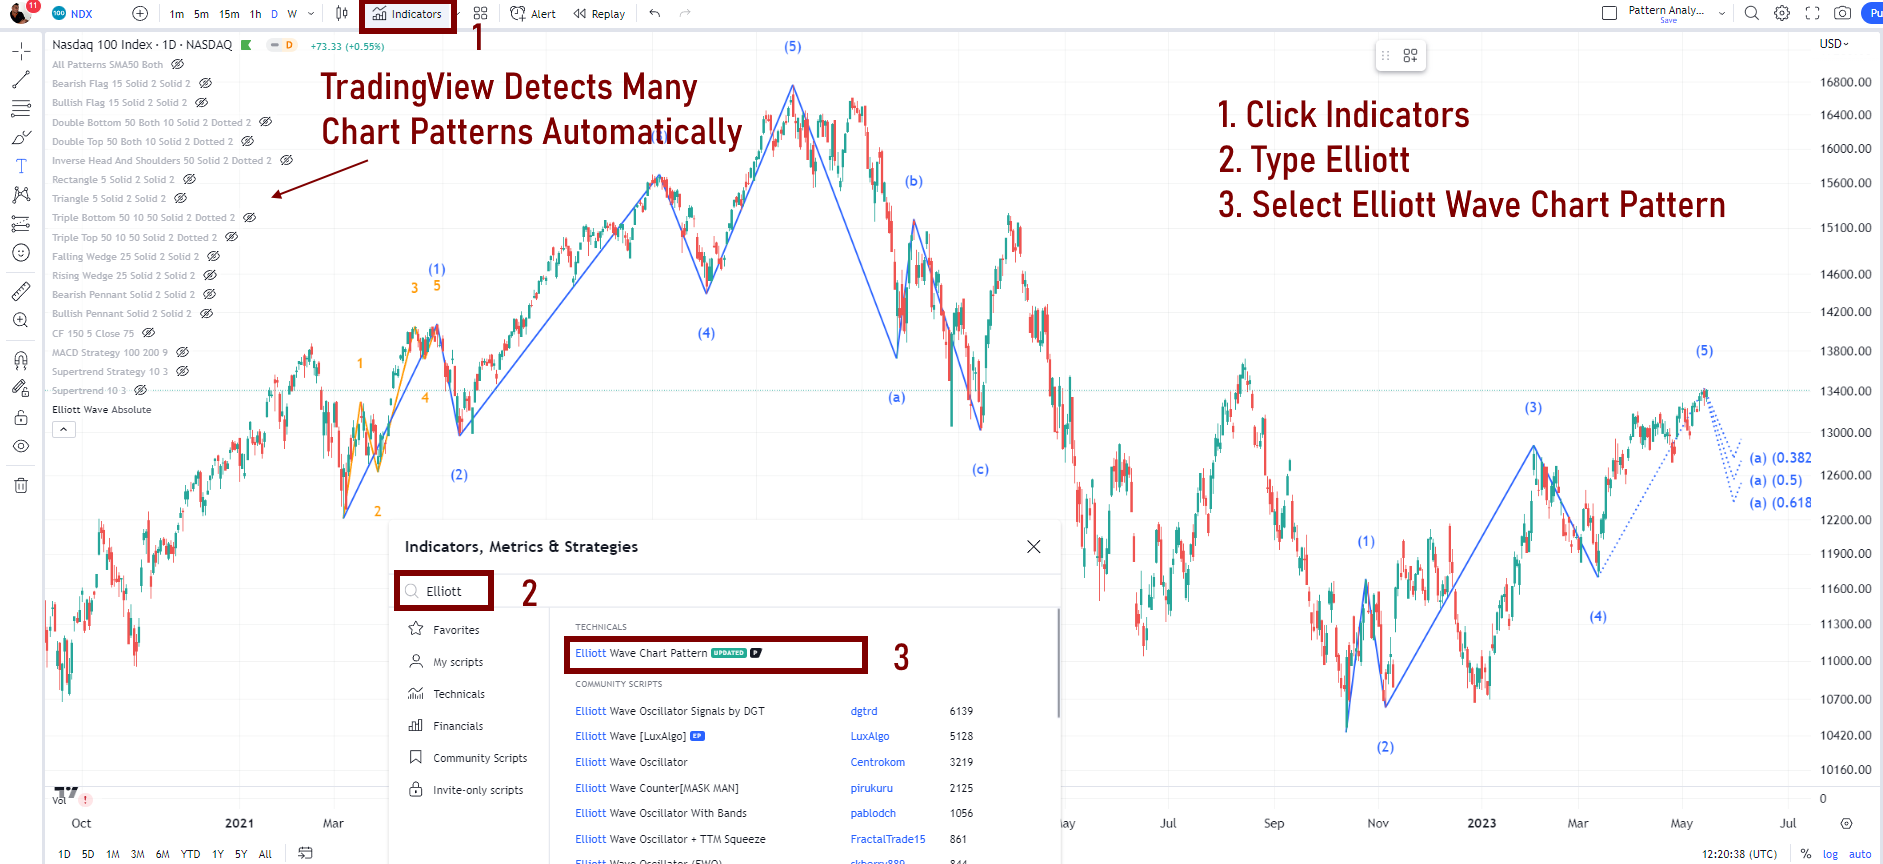
TradingView has automated the detection of Elliott Waves into its innovative pattern recognition system. Best of all, the Elliott Wave indicator is available on TradingView’s free plan. Here’s how to enable it:
- Visit TradingView and register for a free account.
- Click Indicators
- Type Elliott into the search box
- Select Elliott Wave Chart Pattern
Enable Automatic Elliott Wave Patterns Now
4 Practical Examples
1. Elliott Waves in a New Bull Market 2009
In this example, we apply Elliott Wave Theory to the emergence of one of history’s best all-time bull markets – 2009 to 2018. The chart below is the bottom of the 2007 to 2009 financial crisis bear market.

As you can see here, this S&P move is a classic textbook Elliott Wave.
- Wave 1: Impulse Wave – the initial start of a new bull run. In a bear market recession, it is the initial push downwards from an all-time high.
- Wave 2: Corrective Wave – this is the correction from Wave 1 when stocks pull back from the new high.
- Wave 3: 2nd Impulse Wave – now we have a strong bullish move upwards
- Wave 4: 2nd Corrective Wave – another move down in stock prices as sellers cash in on their profits.
- Wave 5: 3rd and often longest Impulse Wave – the market is strong, and the bulls decide it is time to buy.
- Wave A: 1st wave of correction of the primary cycle – the market participants become nervous at the new highs and begin to cash in their profits; however, buyers are not keen on these prices, so the stock prices start to fall.
- Wave B: 2nd wave of correction (pullback of corrective move) – as stock prices begin to fall, buyers outnumber sellers, and the stock price rises.
- Wave C: Correction of primary wave completed – now the bears win, the market participants are nervous, everyone starts to sell, and there are few buyers.
- This completes the cycle, and we start from Wave 1 again.
Using Elliott’s theory is not an exact science, and one does need to use a little imagination (squint your eyes, tilt your head); however, it does prove useful for reference.
2. End of a Bear Market & Start of Bull Market 2008
In 2013, the US markets hit new all-time highs and seemed to advance despite lackluster economic data. This example shows how to apply Elliott Wave theory to the end of a bull market and the beginning of a new baby bull market.
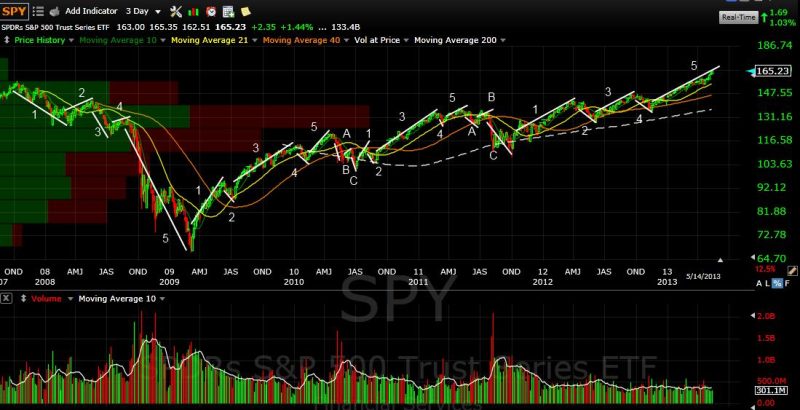
I have mapped approximately the three main waves of Elliott Wave Theory in this chart.
- The first impulse wave started in March 2009 and ended in May 2010.
- The second impulse wave started in July 2010 and ended in May 2011.
- The third impulse wave started in October 2011 and continued until May 2013.
Elliott wave theory suggests that major bull markets propel upwards in 3 primary waves. After the third impulse wave, we see a primary downward trend bear market to set us up for the next round of impulse waves.
3. Elliott Wave Grand Supercycle Example 1983 to 2009
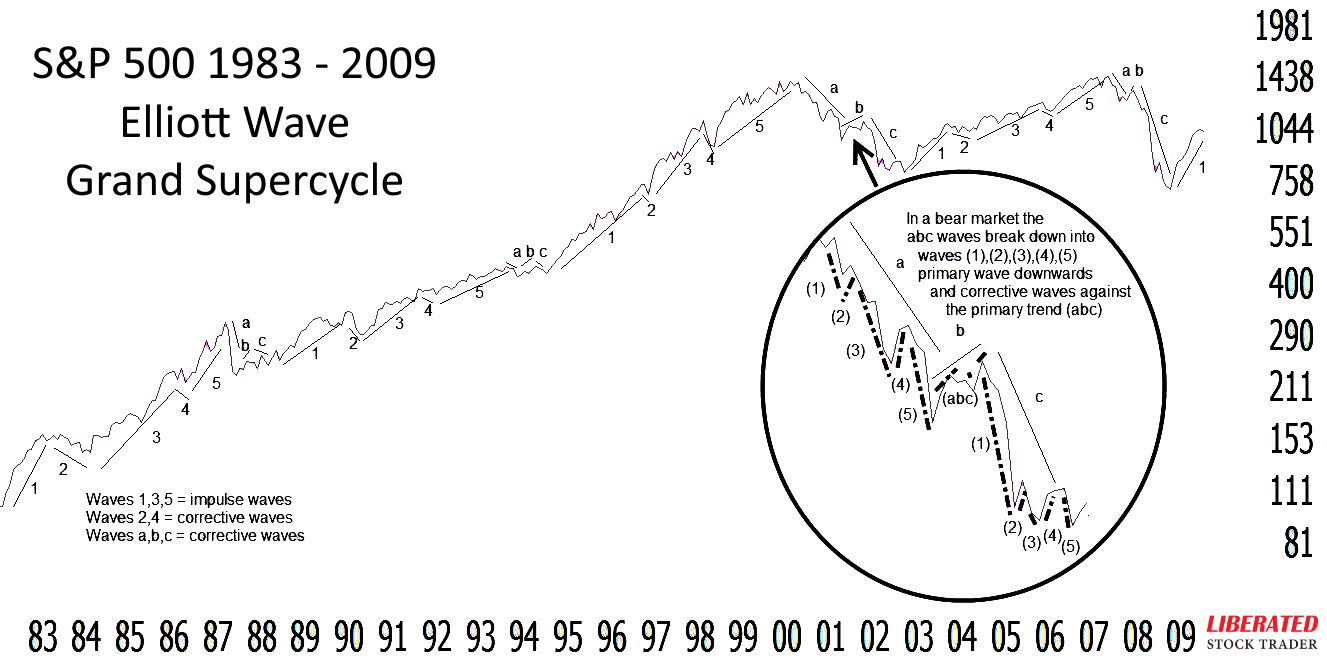
Elliott Wave Grand Supercycle Chart:
- 1984 – 1987 saw a strong Bull move
- 1987 – 1989 saw a sharp correction
- 1989 – 1994 saw a long Bull market
- 1994 – 1995 saw a shallow correction
- 1995 – 2000 saw a massive Bull market
- 2000 – 2003 saw a large three-year Bear market
- 2000 – 2007 saw a long, slow advance
- 2007 – 2009 saw a huge, volatile Bear market
The key here is the ability to zoom in and out on different timeframes to spot the waves. The waves are usually perceivable in intra-day minute-by-minute charts or long-term multi-decade charts.
4. Elliott Wave COVID-19 Crash 2020
The start of the COVID-19 pandemic kicked off a volatile time in the stock market, with a 34% market decline in 24 days. This marked a new market leg and allowed one to start an Elliott Wave mapping.
In this chart, I begin with the classic A-B-C correction wave as the market declines and follow it up with the 1-2-3-4-5 impulse wave of the new Bull market that emerged from the ashes of the crash.
The market then experienced another corrective A-B-C wave from September to November 2020. Still, it emerged again with the promise of massive government stimulus into a new 1-2-3-4-5 impulse wave supporting the major Bull market move.
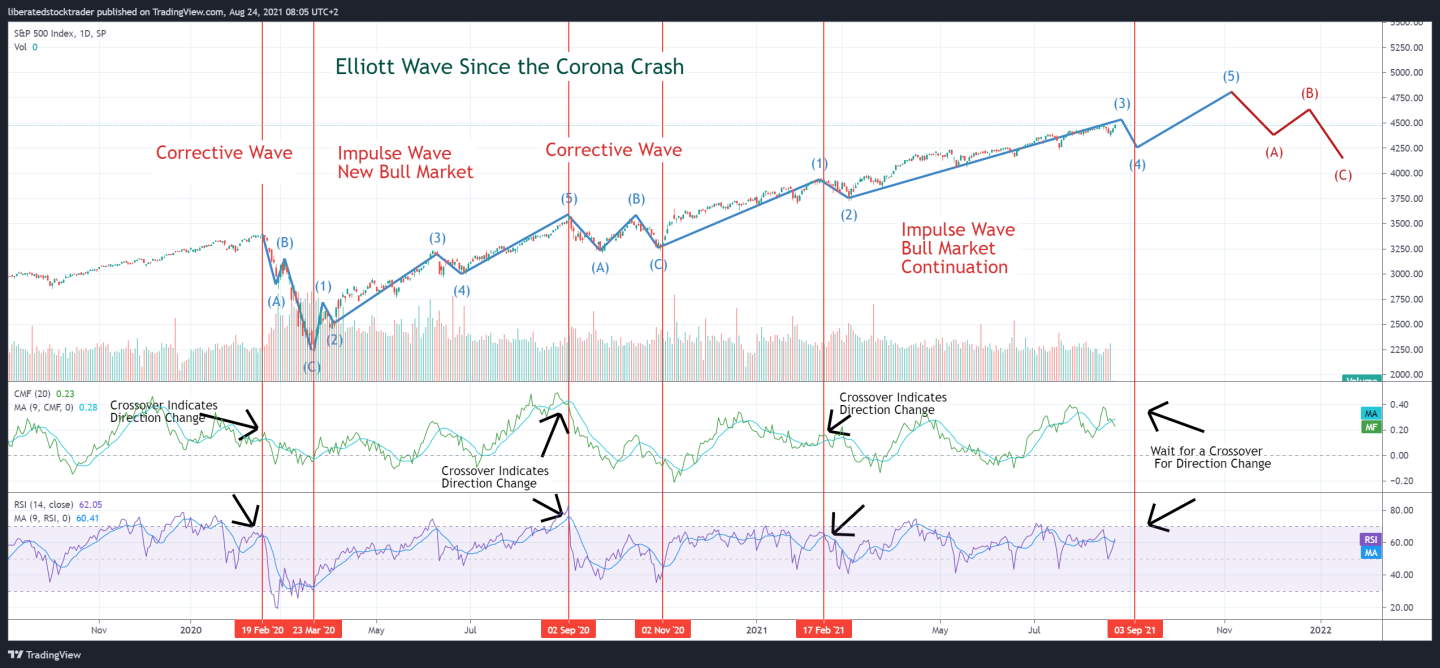
The chart above shows that it helps plot Elliott waves and uses supporting indicators; I have used Cumulative Money Flow and Relative Strength Index to confirm the moves. In technical analysis, a price-based indicator like rate of change with a price/volume indicator (OBV or CMF) is always a good practice to give you two different perspectives on the same chart.
By mapping a 9-day moving average (MA) on the RSI and CMF indicators, we can see a strong confirmation when the indicators cross down or up through the MA. This helps with recognizing a new wave pattern sooner rather than retrospectively.
Video: How To Practically Use Elliott Wave Theory – Examples
Video From The Liberated Stock Trader Pro Masterclass Course
The 9 Types of Elliott Wave
- Grand Supercycle: An entire multi-decade bull or bear market from boom to bust consisting of many 1 2 3 4 5 ABC sub-cycles
- Supercycle: A large multi-year bull or bear market rally or decline consisting of multiple 1 2 3 4 5 ABC waves
- Cycle: A large bull/bear market run consisting of a 3 or more 1 2 3 4 5 ABC sub-cycles
- Primary: A primary move upwards or downwards consisting of complete 1 2 3 4 5 ABC cycle
- Intermediate: Zooming in on a primary cycle to reveal a sub-cycle of many months
- Minor: Shorter timeframe waves ranging from weeks to months
- Minute: Waves of weeks
- Minuette: Waves of days to weeks
- Sub-Minuette: Intra-day waves
Why Elliott Waves Fail
One of the biggest problems with Elliott Wave Theory is that it relies on subjective analysis and interpretation of waves, leading to analysts’ disagreement. Another issue is that Elliott Waves often overlap, making it difficult for traders to identify a complete wave cycle accurately. Finally, predicting future market movements based on past trends is not always reliable due to the unpredictable nature of the markets.
Elliott Wave Theory can be a powerful tool for helping traders identify market trends and opportunities. However, due to its subjective nature, it should always be used cautiously.
The problem with Elliott Wave theory is that the mapping is always open to broad interpretation; ask ten Elliott Wave theorists the same question, and you will get ten different answers. Elliott Wave theory is unusable for short-term stock market movement prediction because it is imprecise, and large macroeconomic events can impact the market externally.
Elliott wave theory has some caveats. The first is that it is only proven accurate and statistically relevant on highly liquid stocks or markets, where there is less likelihood of price manipulation by a “few strong hands.”
Elliott himself warns us of this. This means that the not-so-liquid elements of the market are not applicable, which means approximately 65% of the total market.
Backtesting Elliott Waves
Backtesting Elliott Wave Theory is difficult due to the subjective nature of the principle, which means the results are not repeatable or reliable. The impreciseness of the Elliott Wave means that it doesn’t conform to the scientific method, which requires a hypothesis and testing with measurable results.
In conclusion, Elliott Wave Theory can help determine the current price trend and likely future direction of highly liquid stocks or markets. However, due to its subjective nature, it isn’t easy to backtest or use reliably in trading. You must use caution when relying on Elliott Wave to trade any asset.
Does Elliott Wave Theory Work?
It is impossible to prove that Elliott Wave theory works more than 50% of the time because its principles are subjective and cannot be mathematically tested. Reliable chart patterns such as the triple bottom or inverse cup and handle are proven reliable in testing, but Elliott Waves has not.
In my opinion, you should not trade using Elliott Waves.
Critics of the Elliott Wave
Critics of the Elliott Wave Theory also point out that it doesn’t explain what causes particular wave patterns, meaning that its predictive power is limited. It’s also difficult to identify Elliott Wave patterns in real time. Furthermore, the repeating nature of these patterns may create self-filling prophecies, meaning investors act on a belief in the accuracy of Elliott Wave Theory and, in doing so, unintentionally create the results they expect.
Benoit Mandelbrot
Benoit Mandelbrot has questioned whether Elliott Waves can predict financial markets: “But Wave prediction is a very uncertain business. It is an art in which the subjective judgment of the chartists matters more than the objective, replicable verdict of the numbers. The record of this, as of most technical analysis, is at best mixed.” Source
David Aronson
Technical analyst David Aronson wrote: “The Elliott Wave Principle, as popularly practiced, is not a legitimate theory, but a story, and a compelling one that is eloquently told by Robert Prechter. The account is especially persuasive because EWP has the seemingly remarkable ability to fit any segment of market history down to its most minute fluctuations. I contend this is made possible by the method’s loosely defined rules and the ability to postulate a large number of nested waves of varying magnitude. This gives the Elliott analyst the same freedom and flexibility that allowed pre-Copernican astronomers to explain all observed planet movements even though their underlying theory of an Earth-centered universe was wrong.” Source
Ultimately, choosing to use Elliott Wave Theory is up to you. It can be a useful tool for traders, but it should be used cautiously and always combined with other forms of technical analysis. Remember that there are no guarantees when it comes to predicting price movements.
If you try to critique Elliott Wave online, you will get many detractors suggesting you do not truly understand the principles. Elliott Wave enthusiasts are a passionate group of fanatics.
FAQ
What is the success rate of Elliott Wave trading?
The success rate of Elliott Wave trading is not proven to be more than a 50/50 chance of a profitable trade. The subjective nature of the principles means any mathematical testing is impossible. While wave theory is elegant, it is not proven to be successful as a set of systematic rules.
Do professional traders use Elliott Wave?
Yes and No. While professional traders and market analysts like myself are required to learn Elliott Wave theory as part of our industry certification, the evidence of Elliott Wave being used as a widely adopted trading strategy in the finance industry is limited.
What is the best Elliott Wave tool?
The best free tool for plotting Elliott Waves is TradingView. Go to TradingView, click on Indicators, and select Elliott Wave; you will then have the waves plotted on a chart for you automatically.
What are the disadvantages of Elliott Wave?
The main disadvantage of the Elliott Wave is its subjectivity. Since there is no definitive method to determine which wave a given market cycle is in, traders relying heavily on this theory have to judge what they believe will happen next. This can lead to wrong predictions and losses if the trader isn't careful.
Is Elliott Wave theory the best?
No, Elliott Wave theory is not the best way to forecast market movements as it relies heavily on subjective judgment. Many technical analysis methods have proven more reliable, including chart patterns, indicators such as moving averages or rate of change, and even Heikin Ashi charts.
What is the best time frame to trade Elliott Wave?
Due to a lack of empirical testing on short-term intraday charts, the best timeframe to trade Elliott Wave is daily, weekly, or even monthly. A longer timeframe will mean macroeconomic, political, and financial news can be considered in context with the Elliott Wave principles.
Is it worth learning about Elliott Wave?
Yes, it is worth learning Elliott Wave theory to understand market principles and cycles. This knowledge helps a trader get perspective into the current market phase. If you want to trade profitably, I suggest studying reliable, proven chart patterns instead.
What happens after Elliott Wave 5?
Elliott Wave 5 marks the end of a market cycle. The market then corrects or moves in the opposite direction. After the correction is complete, Elliott Wave 1 starts again and marks the beginning of another cycle. This process can repeat multiple times, depending on how long-term cycles play out.
What is the golden rule of the Elliot wave?
The golden rule of the Elliott Wave is to trade in the direction of the wave count. If you expect a certain wavelength and believe it is still unfolding, you should buy or sell according to your predictions. The goal is to maximize profits by riding short-term waves while understanding larger market movements and trend reversals.
What is the golden ratio in the Elliot wave?
The golden ratio in the Elliott Wave is 0.618 and is found by dividing any number in the Fibonacci sequence by its immediate predecessor. For example, if you divide 8 (the eighth Fibonacci number) by 13 (the seventh), then you get 0.618. This ratio can distinguish between corrective and impulsive waves and help traders identify the general trend of a security.
Did Paul Tudor Jones use Elliot Wave?
Yes, Paul Tudor Jones is well known for using the Elliott Wave Principle in his trading. He began studying it in the early 1980s and has become one of its most successful adherents. However, evidence suggests in later life, he disowned the theory as a contributor to his success.
How accurate is elliott wave?
There is no proven study or mathematical backtest to prove that Elliott Wave is accurate. This means we must assume Elliott Waves are no more than 50 percent accurate, which is the equivalent of flipping a coin.
Is Elliott wave theory legit?
Yes, the Elliott Wave Principle is a legitimate theory. Although not scientifically proven to outperform the market or to make traders profitable directly, Elliott Wave combines business cycle analysis and the nature of markets into a legitimate explanation of how markets move.
How to trade Elliott Wave?
The basic principle of trading with the Elliott Wave is to identify the direction of the trend and trade with that momentum. You can do this by looking for strong signals in the wave patterns, such as breakouts, pullbacks, and retracements. Once you identify a potential entry point, it's important to consider stop loss orders and taking a profit.
How to draw Elliott Waves on Tradingview?
Drawing Elliott Wave patterns is a difficult task. Fortunately, TradingView has an automated feature that makes this process easier. To use it, navigate to the top of your chart and select 'Indicators' followed by 'Elliott Wave Indicator.' This will draw the waves on your chart to easily see the trend.
How many waves are in the Elliott Wave theory?
The Elliott Wave theory is based on eight waves, five waves that move in the direction of a trend, followed by three corrective waves. This pattern can occur in any time frame and is ongoing until complete.
Are Elliott waves reliable?
No, Elliott Waves are not reliable. It is challenging to ascertain the reliability of the Elliott Wave beyond 50 percent, given the subjective nature of its principles cannot be subjected to mathematical testing. Successful chart patterns, for instance, the triple bottom or inverse head and shoulders, have proven reliability in testing, but the same cannot be claimed for Elliott Waves.
Does Elliott Wave work in Crypto?
Elliott Wave can be applied to crypto markets, although some traders find it hard to detect patterns in assets with such high levels of volatility. It is important for any trader attempting to use Elliott Wave in the crypto markets to understand the risks involved and ensure they have appropriate strategies and risk management in place.
Is Elliot Wave easy to learn?
No, Elliot Wave is far from easy to learn. It requires a deep understanding of chart patterns and a strong background in technical analysis. Some traders also argue that experience in trading is necessary for correctly interpreting Elliott Wave signals.
Summary
Elliott Wave Theory is a useful tool for traders, but it should be used carefully and always combined with other forms of technical analysis. While it can explain observed price movements, there are no guarantees when using this theory to predict future price movements.
Furthermore, Elliott Wave enthusiasts form a spirited group of fanatics who will challenge anyone who attempts to criticize the theory online. Therefore, it is important to approach Elliott Wave Theory with an open mind and consider all sides of the debate.
Whether you incorporate this theory into your trading strategy will depend on your preference and risk tolerance.
You want to be a successful stock investor but don’t know where to start.
Learning stock market investing on your own can be overwhelming. There’s so much information out there, and it’s hard to know what’s true and what’s not.
Liberated Stock Trader Pro Investing Course
Our pro investing classes are the perfect way to learn stock investing. You will learn everything you need to know about financial analysis, charts, stock screening, and portfolio building so you can start building wealth today.
★ 16 Hours of Video Lessons + eBook ★
★ Complete Financial Analysis Lessons ★
★ 6 Proven Investing Strategies ★
★ Professional Grade Stock Chart Analysis Classes ★


I have now updated a chart for 2020 & 2021 for the Covid Crash.
The waves on your S and P chart a a little premature I believe. I think as of now we are heading into the first leg of a corrective move. I think your wave 5 is Wave 3 with a 5 minor cycle extension, as there was no momentum divergence, if you look at early Nov 2020 to now, i feel that is the 5th bull wave, there is momentum divergence and while rare in stock markets, also another 5 minor cycle extension, which would make sense with the uncertainty of COVID still high in December and early this year. Then again, wave cycles can be seen at all time levels, but also the market usually corrects about once every year, or right under. Volatility is going to make this correction a strong one, not to mention the massive V recovery and excessive fed open market operations. I program indicators and automated trading systems/strategies if you would like to see a few, feel free to contact me on my email. Thank you for your time.
Hi David, the charts in this article are actually from 2009, but they do look incredibly similar to the Covid Crash. thanks for your input.
Barry