To successfully find outstanding value stocks, you need to know the best criteria to use in your screening filters.
There are hundreds of value stock ratios and metrics, so we highlight the 39 critical criteria to build a profitable value investing strategy and portfolio.
The essential screening criteria to find great value stocks are intrinsic value, margin of safety, the PEG ratio, price to Graham number, and earnings power value.
Used in combination, these metrics can find excellent undervalued companies.

What is Value Investing?
Value investing is both a philosophy and a strategy of investment. The philosophy is that an asset’s value is its most important characteristic. The strategy is that the market cannot properly value stocks, but well-informed investors can.
To determine the real value, value investors usually ignore the stock price and look at the entire company. Value investors will examine a company’s sales data, financial reports, holdings, real estate, patents, intellectual property, research and development, and many other factors.
Value investing means different things to different people, so we will focus on the most important criteria that will help you identify great companies whose stock is selling at a significant discount.
We also include a selection of dividend criteria for those seeking an income-investing strategy.
10 Most Important Value Stock Screener Criteria
- Intrinsic Value/Fair Value per Share > Stock Price
- A Margin of Safety > 30%
- Greenblatt Earnings Yield > 3%
- Price to Lynch Fair Value < 1.0
- Price to Graham Number < 1.0
- Piotroski F Score > 8
- Altman Z- Score > 3.0.
- The Solvency Ratio > 20%
- Yacktman Forward Rate of Return: Higher is Better
- Greenblatt Return on Capital: Higher is better
Risk & Valuation Criteria
Intrinsic Value / Fair Value
The Intrinsic Value of a stock is an estimate of a stock’s value without regard for the stock market’s valuation. The Dividend Discount Model (DDM) and the Discounted Forward Cashflow (DFC) Model are popular. There are multiple variations of intrinsic value; see our detailed article on intrinsic value. Criteria: Intrinsic Value per Share > Stock Price
How to Calculate Intrinsic/Fair Value of Stocks + Excel Calculator
The Margin of Safety
If a stock price is significantly below a company’s actual fair value, that percentage difference is known as the margin of safety. Essentially, it is the percentage by which the stock market undervalues a company.
- Criteria: Margin of Safety > 30%.
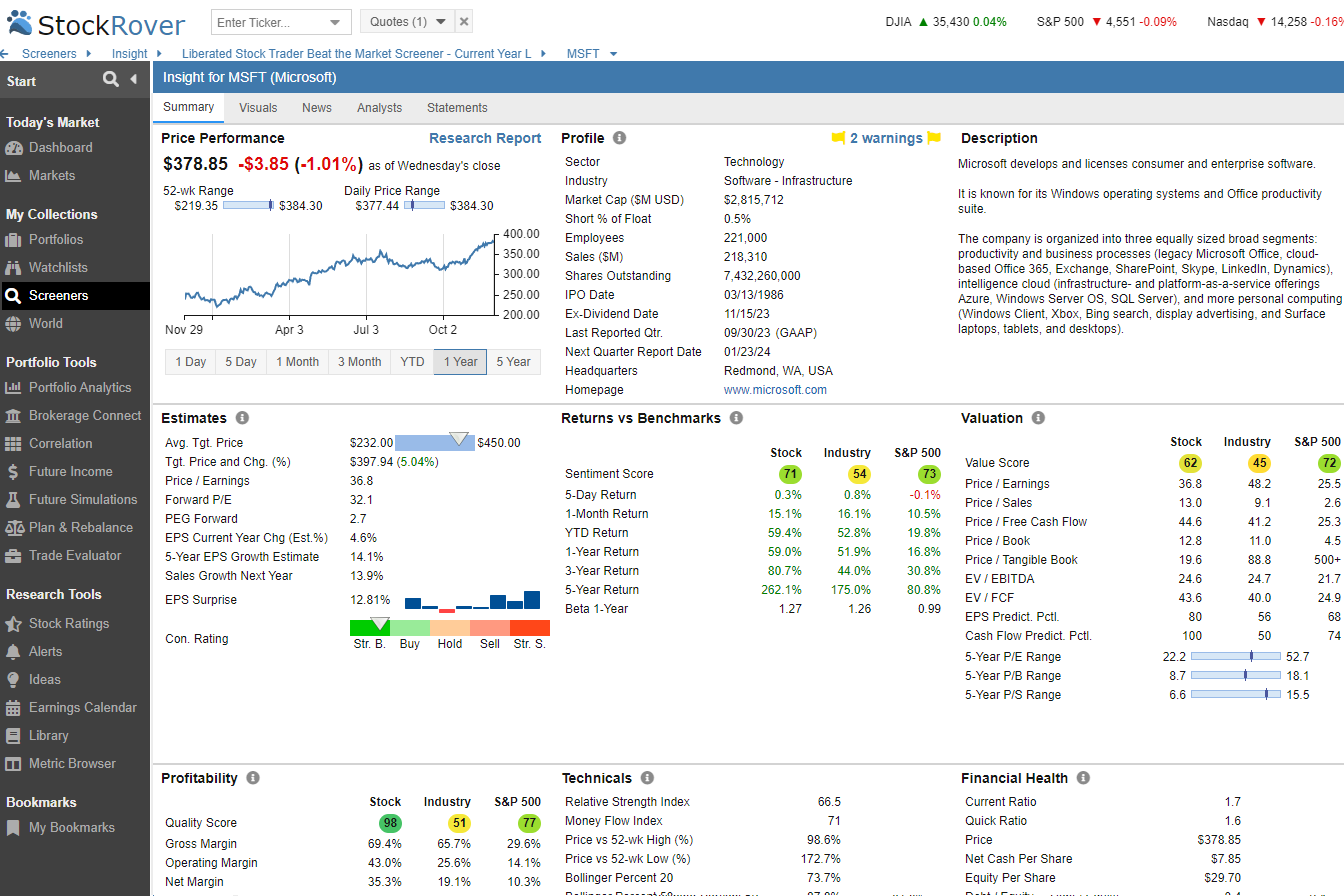
I know of only one stock screener with detailed margin of safety and fair value calculations, Stock Rover, winner of our best stock screener award.
Investing In Stocks Can Be Complicated, Stock Rover Makes It Easy.
Stock Rover is our #1 rated stock investing tool for:
★ Growth Investing - With industry Leading Research Reports ★
★ Value Investing - Find Value Stocks Using Warren Buffett's Strategies ★
★ Income Investing - Harvest Safe Regular Dividends from Stocks ★

"I have been researching and investing in stocks for 20 years! I now manage all my stock investments using Stock Rover." Barry D. Moore - Founder: LiberatedStockTrader.com
Price to Lynch Fair Value
The price to Peter Lynch Fair Value ratio is based on the famed investor’s valuation formula. It divides the price by the PEG rate times the 5-year EBITDA growth rate times continuing earnings per share.
- Criteria: < 1.0 is considered undervalued.
Price to Graham Number
The price-to-Graham number ratio is a conservative valuation measure based on Benjamin Graham’s classic formula. The Graham Number is one of his tests for whether a company is undervalued and is computed as the square root of 22.5 times the tangible book value per share times the diluted continuing earnings per share.
- Criteria: < 1.0 is considered undervalued.
Enterprise Value
Enterprise value is the company’s total value, including market capitalization. It is the price another company could pay for a corporation. A classic formula to calculate enterprise value is market capitalization plus assets plus cash and equivalents minus debt.
Earnings Power Value
Popularized by value investor Bruce Greenwald and considered an improvement over Discounted Cash Flow (DCF) models, it avoids speculative assumptions about future growth. The seven-step formula for EPV looks at the company’s adjusted earnings and applies a multiple based on its stability and growth potential. This provides an estimate of a company’s worth as if it were owned outright.
PE Ratio
The Price Earnings Ratio helps you identify companies with lower stock prices compared to earnings. The PE Ratio is only useful when comparing competitors in the same industry with similar business models.
- Criteria: PE Ratio < 4th decile in the industry segment
Shiller PE Ratio
The Shiller P/E ratio or Cyclically Adjusted PE Ratio (CAPE Ratio) uses the 10-year inflation-adjusted average earnings to compute a P/E ratio that spans the typical business cycle.
- Criteria: Lower is better
Price / Book Value
To a classic value investor, book value appraises a company’s assets. A good definition of book value is anything the company can sell for cash now. Book value assets include real estate, equipment, inventory, accounts receivable, raw materials, investments, cash assets, intellectual property rights, and patents.
Price to book value compares a stock’s market value to the value of total assets minus total liabilities (book value). This is also known as P/B or PB. A low P/B ratio could mean that the stock is undervalued. However, it could also mean something fundamentally wrong with the company.
- Criteria: Lower is better
Investors Guide to the PEG Ratio & Finding High Growth Stocks
Price / Tangible Book Value
This metric compares a stock’s market value to the value of total assets minus liabilities and intangibles. A low ratio could mean that the stock is undervalued. However, it could also mean something fundamentally wrong with the company.
- Criteria: Lower is better

Try Powerful Financial Analysis & Research with Stock Rover
Financial Strength Criteria
Piotroski F Score
Named after Stanford Accounting Professor Joseph Piotroski, the Piotroski score determines a company’s financial strength based on nine parameters.
- Criteria: A score of > 8 is considered healthy, and < 2 indicates a weak company.
Beneish M-Score
The Beneish M-score is a statistical model for determining if the company’s earnings have a high probability of accounting manipulation. An M-Score rating over -1.78 suggests possible earnings manipulation. Professor Beneish found that investing in low M-Score stocks and shorting high M-Score stocks would have outperformed the market by about 15% over the 7-year period he studied.
- Criteria > -1.78 Risky
Altman Z- Score
The Altman Z-score is a popular credit-strength measure that shows how likely a company is to go bankrupt.
- Criteria: Risky companies < 1.8, and solid companies score > 3.0.
Sloan Ratio
The Sloan ratio identifies companies with high accrual ratios or high non-cash income or expenses. Sloan found that over 40 years, buying low accrual companies and shorting high accrual, one generated a return of more than twice the S&P 500. The ratio is computed by subtracting operating and investment cash flow from net income and dividing by total assets.
- Criteria: If the result is between -10% and 10%, the company is in the safe zone, but if the result is greater than 25% or less than -25%, earnings are likely to be made up of accruals. Accruals that continue across several quarters are a signal for doctored earnings.
Debt / Equity
Debt/Equity, sometimes called D/E, Financial Leverage, or Gearing, is the ratio of Total Debt to Equity.
- Criteria: A high ratio indicates a risky business, and a low ratio makes a buyout more likely.
Current Ratio
A measure of the company’s ability to pay short-term obligations, calculated as current assets divided by current liabilities.
- Criteria: safe investments have a current ratio > 2.
Quick Ratio
The Quick Ratio, also called the acid test or liquid ratio, measures a company’s ability to meet its short-term obligations with its most liquid assets. It is calculated as (Current Assets – Inventory) / Current Liabilities.
- Criteria: safe investments have a quick ratio of < 1.
Franchise Value
The franchise value is the value of a company’s name or reputation. The idea is that a good name or reputation will increase a company’s value, sales, and cash flow. Apple has a high franchise value because of its reputation for making dependable, innovative, and high-quality products. This enables Apple to charge higher prices and sustain high profit margins while maintaining a loyal customer base.
Negative Enterprise Value
A company has a negative enterprise value when the cash on the balance sheet exceeds its market capitalization and debts.
- Criteria: Value investors look for negative enterprise value because it signifies the market is undervaluing a company.
Net Current Asset Value Per Share (NCAVPS)
NCAVPS was one of Benjamin Graham’s tools for valuing a stock. You calculate the NCAVPS by subtracting a company’s total liabilities from its current assets. Graham considers preferred stock a liability. The idea is to learn how much money a company will have left after it sells all the cash assets and pays all obligations.
Institutional Ownership
This indicates what percentage of the company financial institutions own. Low institutional ownership indicates companies that Wall Street has not discovered yet, which means more potential growth in the future.
- Criteria: Lower is better
Insider Ownership
The theory goes that the more a company’s management and employees own shares of a company, the more committed they are to succeed.
- Criteria: Higher is better
The Solvency Ratio
The Solvency Ratio measures whether a company generates enough cash to stay solvent. It is calculated by summing net income and depreciation and dividing by current liabilities and long-term debt.
- Criteria: A value above 20% is considered good.
Building the Best Buffett Stock Screener for Value Investing
Profitability & Earnings Criteria
Greenblatt Earnings Yield
Joel Greenblatt’s Earnings Yield calculation allows you to find value stocks by comparing a company’s operating income to its enterprise value. Using the Greeblatt Earnings Yield and the Greenblatt Return on Capital calculations together is the core of his value investing methodology featured in his “The Little Book that Beats the Market.”
This variation of earnings yield compares Operating Income (a.k.a EBIT) to Enterprise Value. Joel Greenblatt uses it in his bestselling book, The Little Book That Beats the Market.
- Criteria: > 3%
My thorough testing awarded TradingView a stellar 4.8 stars!
With powerful stock chart analysis, pattern recognition, screening, backtesting, and a 20+ million user community, it’s a game-changer for traders.

Whether you're trading in the US or internationally, TradingView is my top pick for its unmatched features and ease of use.
Explore TradingView – Your Gateway to Smarter Trading!
Yacktman Forward Rate of Return
The Yacktman Forward Rate of Return can be considered the return investors buying the stock today can expect from it in the future. It is similar to earnings yield but uses the normalized free cash flow of the past seven years and adds in the 5-year growth rate.
- Criteria: Higher is Better
Greenblatt Return on Capital
This variation of Return on Capital takes Operating income (a.k.a EBIT) as a percent of NetPPandE plus Current Assets. Joel Greenblatt uses it in his bestselling book, The Little Book That Beats the Market.
- Criteria: Higher is better
EPS 5-Year Average %
The average annual compound change in diluted continuing Earnings Per Share (EPS) over the last five years. EPS is calculated as net income minus dividends paid on preferred stock divided by the average number of outstanding shares.
- Criteria >10%
Return on Assets
ROA is a profitability measure calculated as net income as a percent of total assets, also called ROA.
- Criteria: A high ROA shows an effective allocation of capital.
Return on Equity
ROE is a profitability measure calculated as net income as a percentage of shareholder’s equity. A high ROE shows an effective use of investors’ money but does not account for any risks associated with high financial leverage.
- Criteria: Higher is better
Return on Invested Capital
ROIC quantifies how well a company generates cash flow relative to the capital it has invested in its business. It is defined as Net Operating Profit after Taxes / (Total Equity + Long-term Debt and Capital Lease Obligation + Short-term Debt and Capital Lease Obligation).
- Criteria: Higher is better
Operating Income or Loss
This figure shows how much the company made or lost on its operations. If you see a negative number like this, -$1.157 billion after the words operating income, it means a company is losing money on its operations.
- Criteria: Higher is better
Net Income or Net Loss
Do not buy an unprofitable company. If this number is positive, it tells you how much the company made after covering its operating costs. If this number is negative, it tells you how much money the company lost after covering its operating costs.
- Criteria: Higher is better
Free Cash Flow
Cashflow is King – ensure the company has plenty left after operations expenses are covered. This number is significant because it tells you how much cash the company had left over after covering its costs.
- Criteria: Higher is better
Financing Cash Flow
Financing cash flow tells you how much money the company makes in the financial markets. It can also tell you how much money the company loses or makes by servicing loans and debts.
- Criteria: If this is high, it might mean financiers see it as high risk.
Dividend & Income Criteria
Dividend Yield
The dividend value or yield is the amount investors can make from a company’s dividends. They usually calculate dividend value by subtracting the annualized payout from the share price. The annualized payout is the amount of dividends generated by a share of stock in the past year.
- Criteria: > 3% < 12%
Dividend 5-Year Average %
The average annual compound dividend growth for the last five years is based on the last paid dividend and the corresponding dividend five years earlier.
- Criteria: > 3%
Dividend per Share
The dollar amount paid per share in dividends each year is based on the dividends paid in the previous twelve months.
- Criteria: Higher is better
Payout Ratio
The Dividend Payout Ratio is Dividend Per Share as a percent of Diluted Earnings Per Share based on the trailing twelve months (TTM) from the most recent quarterly report. It can measure the chance of a dividend increase or cut. For example, a company with a small payout ratio has room to increase its dividends. If a payout ratio is too high, the dividend might not be sustainable and may be subject to a cut.
- Criteria: Payout Ratio > 10 and < 60
Dividend Coverage Ratio
The dividend coverage ratio is calculated by dividing the stock’s annual earnings per share by the annual dividend.
- Criteria: > 2
The Best Screeners for Value Investors
Stock Rover is the ultimate value stock screener, aligning with the investment philosophies of renowned investors Ben Graham and Warren Buffett. It offers a comprehensive range of features, including fair value assessment, margin of safety analysis, dividend insights, and analyst ratings.
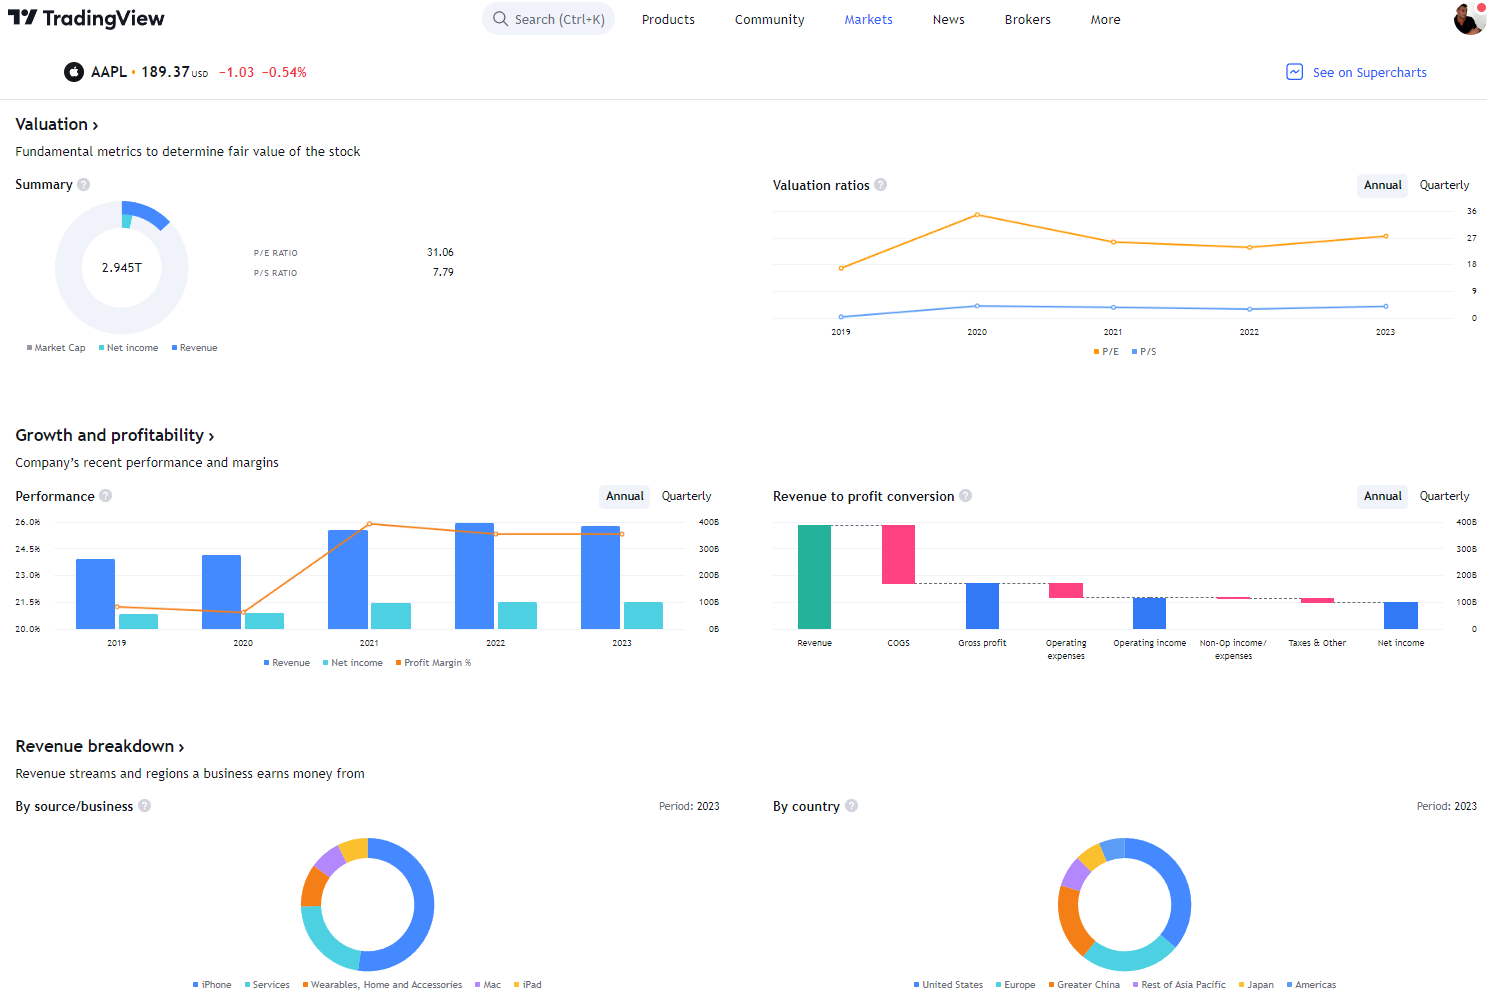
For international investors seeking robust fundamental and technical stock screens, TradingView proves to be a reliable choice.
Try TradingView, Our Recommended Tool for International Traders
Global Community, Charts, Screening, Analysis & Broker Integration

Global Financial Analysis for Free on TradingView
Summary
To uncover valuable stocks, it is crucial to employ screening criteria that include intrinsic value, margin of safety, the PE ratio, and earnings power value. By combining these metrics thoughtfully, one can achieve favorable outcomes in the search for investment opportunities.
For further reading, I recommend the following articles.
Related Articles: Finding Great Stocks With Stock Rover

Right now the 10 most important return 0 results. Where do you adjust or do you wait until one shows up?
Hi Biniam
yes, you need to tweak the criteria according to your preferences. Depending on the market cycle, there may be more companies with higher EPS growth, to trading at a lower P/E etc.
thanks
Barry