VectorVest is software that helps market timing with stock strength calculations and buy and sell trade signals. Vectorvest now publishes its track record, so it is worth trying.
VectorVest analyzes key market factors—such as trends, momentum, and value—to deliver precise buy and sell timing signals, helping you make smarter stock decisions.
As a certified Market Analyst accredited by the International Federation of Technical Analysts, I’m here to provide an in-depth overview of VectorVest. My goal is to help you assess whether this platform aligns with your needs.
Test Results & Verdict
After testing VectorVest, I found it to be on the pricier side. However, its stock recommendation system, which claims to have outperformed the S&P 500 by tenfold over the past 22 years, makes it a platform worth exploring. VectorVest stands out by simplifying the stock selection process through its proprietary system, offering clear bullish and bearish signals that benefit both traders and investors alike.
Over 40 years ago, Dr. Bart DiLiddo founded VectorVest with a vision to simplify investing. He developed a proprietary stock-rating system built on three key metrics: Value, Strength, and Timing. This innovative system provides clear, actionable buy and sell signals, empowering investors with confidence and ease.
Pros
✔ Simple to follow system
✔ Specific buy & sell signals
✔ Market timing signals
✔ US, Canada, Australia, & Euro Stocks
✔ Robo-trading included with premium plans
✔ Advanced options analysis upgrades
✔ Easy to use
Cons
✘ Expensive, especially with add-ons
✘ A limited number of chart indicators

The VectorVest Dashboard
VectorVest software is designed with simplicity in mind, tailored to support its Value, Safety, and Timing (VST) system. Focusing on this streamlined approach offers only the essential stock market indicators needed to operate effectively within the VST framework, eliminating unnecessary complexity.
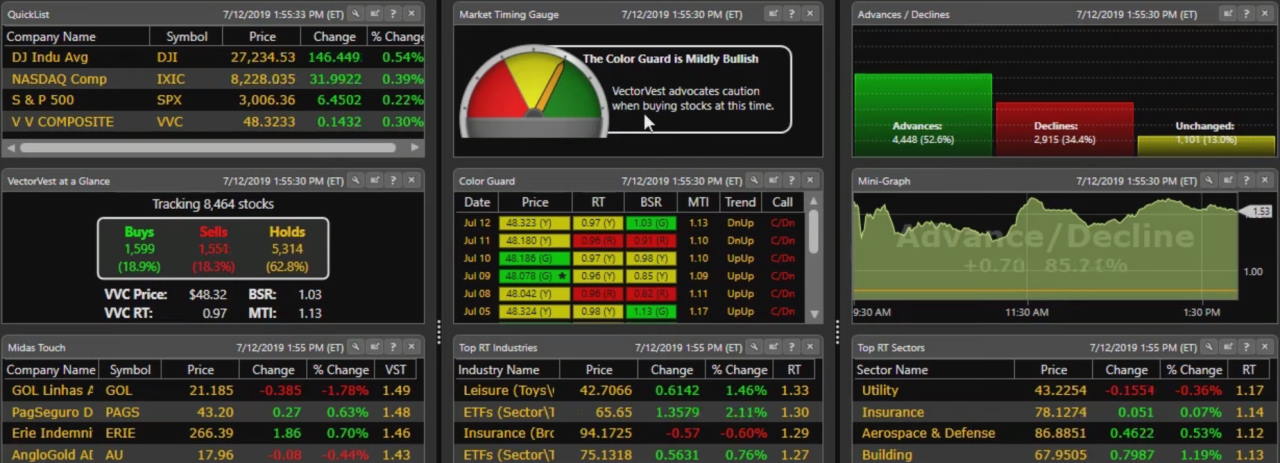
At the heart of VectorVest is the dashboard, which offers a simple view of how the market is doing today.

Key Features
| ⚡ Vectorvest Features | Charts, Watchlists, Screening |
| 🏆 Unique Features | Market Timing Gauge, Buy & Sell Signals, AI Auto-trading Bots |
| 🎯 Best for | Beginner Investors |
| ♲ Subscription | Monthly, Yearly |
| 💰 Price | $58 to $125/m annually |
| 💻 OS | Web Browser |
| ✂ Discount | 1st Month $0.99 |
| 🌎 Region | USA |
Pricing
VectorVest has three service tiers: Basic, Enhanced, and Premium. The basic service lacks many of VectorVest’s benefits. I recommend the enhanced service, which is good for investors, or the Premium for those who want to swing or day trade.
| Service | Basic | Enhanced | Premium |
|---|---|---|---|
| Data/Quotes | End of Day | 15 mins Delay | Real-time |
| Buy/Sell & Rating Signals | End of Day | 15 mins Delay | Real-time |
| Stops, Timing Signals | ✗ | ✓ | ✓ |
| Price/m | $69 | $89 | $149 |
| Good For | Investors | Investors | Traders |
Regarding pricing, Vectorvest is neither expensive nor cheap; it sits in the middle. It does not try to compete with TradingView, MetaStock, or TrendSpider, which offer incredible value for money. However, the competitors do not offer the same level of simplicity as VectorVest.
VectorVest Covers The Following Stock Exchanges:
- 8000+ US Stocks & Indices
- 2,500+ Canadian Stocks
- 2,000+ Australian Stocks
- 2,000+ UK Shares
- 2,000+ European Stocks
VectorVest vs. Its Competitors
VectorVest has four clear alternatives that provide a range of signals, systems, and backtesting at similar or lower prices.
| Vectorvest Alternatives | VectorVest | TrendSpider | TradingView | Trade Ideas | MetaStock |
|---|---|---|---|---|---|
| Rating | 4.0 | 4.8 | 4.8 | 4.6 | 4.4 |
| Pricing | $58 to $125/m annually | $107/m or $48/m annually | Free | $13/m to $49/m annually | $254/m or $178/m annually | MetaStock R/T $100/m, Xenith $265/m |
| Global Market Data | ✔ | USA | ✔ | USA | ✔ |
| Powerful Charts | ✘ | ✔ | ✔ | ✘ | ✔ |
| Stocks | ✔ | ✔ | ✔ | ✔ | ✔ |
| Options | Advanced | Basic | Basic | ✘ | ✔ |
| Robo-Trading | ✔ | ✔ | ✔ | ✔ | ✘ |
| Futures | ✘ | ✔ | ✔ | ✘ | ✔ |
| Forex | ✘ | ✔ | ✔ | ✘ | ✘ |
| Cryptocurrency | ✘ | ✔ | ✔ | ✘ | ✘ |
| Social Community | ✘ | ✘ | ✔ | ✔ | ✘ |
| Real-time News | ✘ | ✘ | ✘ | ✘ | ✔ |
| Screeners | ✔ | ✔ | ✔ | ✔ | ✔ |
| News Scanning | ✘ | ✔ | ✘ | ✘ | ✔ |
| Backtesting | ✘ | ✔ | ✔ | ✔ | ✔ |
| Code-Free Backtesting | ✘ | ✔ | ✘ | ✘ | ✘ |
| Automated Analysis | ✔ | ✔ | ✔ | ✔ | ✔ |
TrendSpider provides automated chart analysis and scanning, focusing on technical analysis. It uses AI to create dynamic trend lines and identify key support and resistance levels. With customizable alerts, it can notify you when a stock hits a specific price or crosses a trend line.
TradingView provides buy and sell ratings for nearly every stock, ETF, Index, and Cryptocurrency globally. The TradingView buy-sell indicators are based on 26 different well-established technical indicators.
Trade Ideas provides definite buy and sell signals and has a proven track record of beating the S&P500. It uses sophisticated AI algorithms to recommend specific trades and when to buy and sell. With over 30 curated channels of ideas, Trade Ideas is a clear industry leader.
MetaStock provides buy and sell signals with the integrated system add-on from its marketplace. You can trade candlestick patterns, momentum, or any system you want to develop using their backtesting and forecasting systems.
Scanning & Ratings
VectorVest continually evaluates every stock on the exchanges they cover to provide propriety ratings.
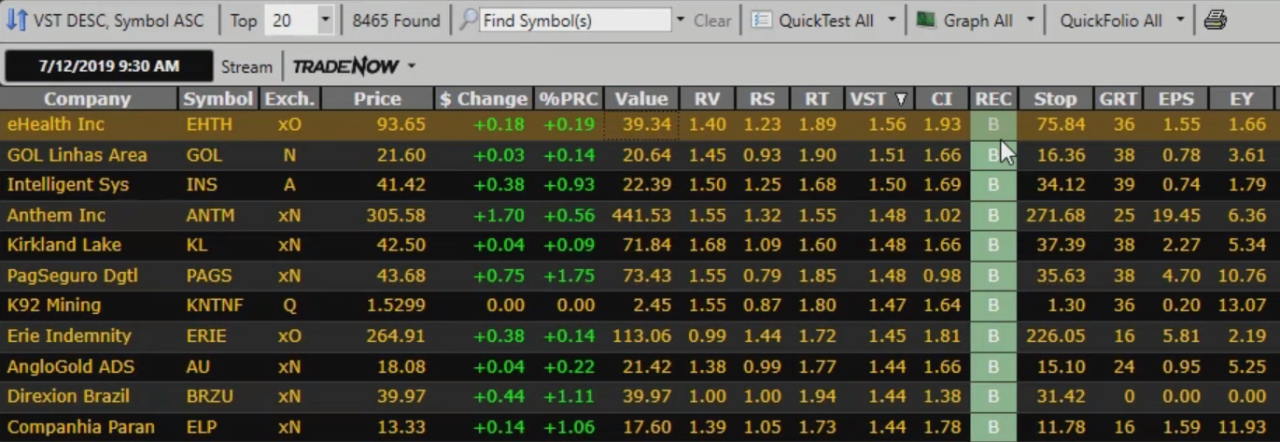
- RV Relative Value shows the estimated return versus a AAA Corporate Bond.
- RS Relative Safety measures the consistency of a company’s financials.
- RT Relative Timing is a technical indicator that attempts to define the short-term trend of a stock.
- VST Value-Safety Timing indicator aggregates RV, RS, and RT essentially rolled up into one number.
Ultimately, VectorVest recommends that you trade stocks with good fundamentals that are moving in an uptrend, as the market is in an uptrend. This makes sense to me and is the foundation of my stock investing strategy.

Performance
My only issue with these ratings is that they are proprietary, so we have no idea how they are calculated. Usually, if proprietary indicators are the unique selling point of stock market software, you would want to publish confirmed results of the system’s effectiveness. Unfortunately, that does not exist.
The only published VectorVest performance is a 20-year-old reference to fantastic returns of 2,000%+, which is unrepresentative of reality.
But does the VectorVest rating system produce market-beating gains? There is no proof for that.
While VectorVest has not published performance metrics, that does not mean it does not help; it is just unproven.
Signals
VectorVest provides buy or sell ratings for every stock it covers, which is interesting. They also have a method for suggesting the Stop Loss, which is the price at which you should sell stock to limit your losses.
VectorVest claims to be the only platform to provide buy or sell signals, but this is not true. Other stock software, such as Trade Ideas, MetaStock, or TradingView, also offers these signals.

News & Social
VectorVest does not have specific features to enable social chat or community within the software. However, it provides subscribers with a weekly market update on YouTube.
Some customers complain about the cost of the training courses available through VectorVest and VectorVest’s constant focus on selling the courses and add-on products.
Charts
VectorVest has around 20 technical indicators and drawing tools, including:
- Trendlines, Gann & Fibonacci
- Moving Averages, Momentum, RSI, and Stochastics
If you are an experienced technical analyst who wants to perform detailed charting analysis, you may want to consider MetaStock, which has 300+ indicators, or TradingView, which has 160+ indicators.
VectorVest also provides specific add-ons to help with trading styles, but they come at a hefty price.
VectorVest Add-ons
- RoboTrader $99/month – RoboTrader watches your portfolio around the clock.
- Real-time Derby $99/month – See all the best strategies at a glance as they compete.
- Options Analyzer $495/month – Analyze options profit/loss for developing future strategies.
- Options Pro $249/month – Discover options investment opportunities and collect higher premiums with OptionsPro.
- Profitlocker Pro $99/month – Maximize profits with the only dynamic trading stop that adjusts to the market.
- Super Watchdog $99/month – Dynamic monitoring that brings trades to you even when you’re away from your computer.
Is VectorVest Worth It?
My testing suggests that VestorVest is not worth it at the current price point. VectorVest provides a few benefits to traders and investors, primarily simplifying finding stocks to trade based on their proprietary system. While the premium package is quite expensive, it may be worth it if you have significant money to invest.
The software is reliable, user-friendly, and highly stable. It is backed by a US-based customer support line known for its excellent service and many satisfied users.
My thorough testing awarded TradingView a stellar 4.8 stars!
With powerful stock chart analysis, pattern recognition, screening, backtesting, and a 20+ million user community, it’s a game-changer for traders.

Whether you're trading in the US or internationally, TradingView is my top pick for its unmatched features and ease of use.
Explore TradingView – Your Gateway to Smarter Trading!

ref: Barry’s review of Vector Vest
Great review and very thorough!!
I use VV now for years and made money as well as avoided losses.
Its important how to use VV: a guide or a gospel – I use it as a guide in addition to my own brain and common sense (retired Banker and Finance guy/Economics etc.)
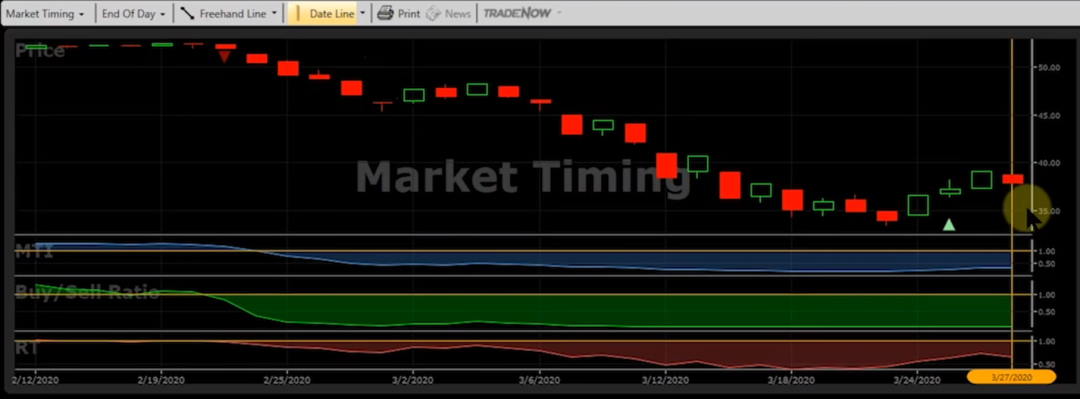
1) Market Timing. You only have to look at their graph starting in November 2022. I read it daily and find it super useful. They told you the trend at that time was : the party is over!!!
2) All investment ideas I read about or see or am told by friends etc.I check out at VV. Also super useful if you understand it as a trend and not as a 100% successful recommendation.
3) if you go back at individual stock graphs and look at the date VV issued a buy recom. the stock more often than not increased its price.
4) All in all – for me – very useful and money well spent.
5) remember, Billy Wilder and Joe Brown got it right:
NOBODY’s PERFECT.
Thanks for reviewing Vector Vest. I am a novelist who recently retired and realize that most financial managers I have used up until and for the first 2 years of my retirement are more successful at managing and growing peoples money who are still working and contributing dollars to their investments by dollar cost averaging. It appears to me that they don’t do as well with a portfolio of someone who is retired, not contributing money to their portfolio anymore and pulling out 3-4% a year. They don’t buy single stocks much or dividend stocks much. As fiduciaries they say their hands are tied to some degree. Well, in my portfolio, it looks like they sat on their hands for the last 1 1/2 years. My “overall”$1mil portfolio is down 11% in that time. And, that is with $300k in cash. So, if the invested portion I am down over 14%. I don’t think that is necessary, do you?
So, my question is this, what stock/fund, trading idea software would you recommend to someone who is not a big analysis investor willing to learn but needs something to help him make informed decisions to manage his retirement investments on his own again? I hope I didn’t lose you in my rant.
Hi Richard, thanks for your message. Many people have suffered over the past year with the US markets down 30%+, I am sorry to hear have also lost out. Of course, I cannot give you personalized investment advice, but here is what I can say.
For managing a large portfolio like yours I recommend (and use myself) Stock Rover.
I also use TradingView for Trading and communicate with my students. But mostly, I invest and use stock Rover for my growth investing strategy. Secondly, as you want to control your own portfolio, there are three things you need to be able to do. 1. Avoid stock market crashes. 2. Have a strong knowledge of the stock market and how it works. 3. Have the right Growth, income, or value stock strategy that meets your needs.
These 3 elements are all covered in our All-Star-Pass, which included the MOSES System (to avoid crashes), our PRO training for how the market works (plus dividend and value investing strategies), and the Beat the Market system for growth stock selection. Ultimately our courses and strategies are designed to empower people to make their own investing decisions.
I hope this helps.
Barry
Hi Richard
Be happy that you lost only 14%
most portfolio lost at least twice as much over the past year.
Se my points above, especially the comment on Market Timing Graph.
I used VectorVest for 6mo, I dont recomend it. Software has too many problems for the price they charge. One month it was down 100% for 2 weeks and when they got it back up, it was having too many problems. They told everyone we were getting a refund and I never got one, plus I got an extra charge and when I asked what was that charge they told me they didnt know and I was going to get a call back. Never got a call or refund. Stay away, this company is greedy and dishonest…
Hi Andres, thanks for the feedback on VectorVest. I have also heard from others about these problems.
Barry
Hi Barry,
Yes, I can send you screenshots of VectorVest, and the equivalent graphs from reputable sources.
That’s because still have the program, until my subscription expires in October. I asked to cancel and get a refund for the remaining half-year, but they refused.
Signals useful? Which ones? They have seven (that’s right SEVEN) different signals, each based on a different algorithm. So for any given movement of a stock or the market as a whole, they can say, “See, our signal showed that was going to happen!”
Hi Bruce, thanks for your feedback, I look forward to seeing it.
Barry
I’ve used VectorVest for several years, but am now stopping. It’s because I checked their data against another source (MSN.com), and found that it’s unreliable.
Upon consulting with their support folks, I learned a surprising fact: VectorVest does not report earnings, but only ESTIMATES of earnings. Even after the quarterly earnings reports come out, if the estimate is wrong, even wildly wrong, they will keep the estimate data in their history.
EXAMPLE: Comparing Facebook from July 2019 to June 2020.
VV shows revenue steadily increasing month by month. MSN shows that revenue peaked in December 2019.
VV shows earnings stuttering for the first 3 months, then going steadily upwards from then on. MSN shows that earnings peaked in December and never recovered to the earlier level.
Hi Bruce, wow, that is interesting. Do you have any screenshots of the data. Thanks for highlighting it.
Did you find their signals useful, or not much?
Barry
Further to what I wrote earlier:
If you are a VectorVest user, even on a trial, you can see this for yourself.
1) Choose any stock, and open a graph for it.
2) Show at least the graph line for earnings.
3) Notice that it gives “earnings” right up until today. But no one will know the true earnings until they are reported, perhaps two or three months from now.
4) Furthermore, notice how the “earnings” line on the graph changes every day, sometimes with big changes up and down. All this is just estimates. A graph of true earnings will have just four data points each year, one for each quarter.
5) For Canadian stocks, I also notice that the dividends graph line often has movements up and down from day to day and week to week. This is pure speculation; it’s not based on actual data.
VectorVest simply is not a trustworthy basis for investment decisions.
After I learned about this problem with “earnings,” I asked them to refund the remaining half-year in my subscription. They refused.