Short interest is the total number of outstanding shares sold short.
Our data suggests short-sell traders should look for a high short interest float over 6% and a short interest ratio (coverage) greater than 19 days to find highly profitable short squeeze scenarios.
This guide will help you understand how short interest works, the strategies traders use to profit from it, and how to find and trade short-interest stocks.
What is short interest?
Short interest is the total number of shares sold short. Traders watch the short interest percentage closely because a high percentage of shares sold short could lead to a highly profitable short squeeze scenario. Any stock with a short interest percentage higher than 5.9% is in the 90th percentile of shorted stocks and is a short squeeze candidate.

Short interest explained
Short interest is the number of shares sold short by investors. The percentage of shares sold short indicates how bullish or bearish investors are on a particular stock. For example, if there are many short sellers, this could indicate that they believe the stock price will fall in the future. Conversely, if there are very few short sellers, this could indicate that they believe the stock price will rise.
When investors sell a stock short, they borrow shares from a brokerage firm and sell them in the open market. If the stock price drops, the investor can buy back the shares at a lower price and profit from their trade. The higher the short interest, the more pessimistic investors are on a particular stock.
What does short interest float mean?
A short interest float is the number of shares borrowed and shorted as a percent of the outstanding publicly traded shares. Short interest float is another name for short interest percent.
Float refers to the number of shares that are available for trading. A high float means more shares are available for trading, making it easier for buyers and sellers to trade without impacting the stock price. A low float means fewer shares are available for trading, making it more difficult to trade without impacting the stock price.
What is the short interest percentage?
The short interest percentage is another name for short interest percent float; it’s the number of shares sold short divided by the total number of shares outstanding. Watch the short interest percent because it indicates how many investors are bearish on a particular stock. For example, if the short interest percentage is high, this could indicate that many investors believe that the stock price will fall in the future.
Short Interest % Float Calculation
Short Interest Percent = # shares sold short / #of shares outstanding
What is the short-interest ratio?
The short interest ratio, or the days to cover, is a useful market sentiment indicator. It reveals the number of days the current short sellers would take to cover their positions if there were no new short sellers.
Covering positions means buying back the shares they have borrowed for shorting purposes. For example, if the short interest ratio is high, it would take longer for a short seller to buy back shares at the current average trading volume; this is to the advantage of bulls when a short squeeze is in motion.
This metric indicates the level of bearishness on a stock. A high short-interest ratio suggests more investors are bearish on a particular stock than bullish ones.
Short Interest Ratio Calculation
Short Interest Ratio = Short Interest % / Financial Trading Volume
This ratio is calculated by dividing the short interest percentage (the total number of shares sold short divided by the total outstanding shares) by the financial trading volume (the number of shares traded during a given period). The higher this ratio, the more bearish investors are on the stock.
Using short interest and days to cover together
When examining short-selling activity, the short interest percentage float and short interest ratio (days to cover) must be considered. If both the short interest percent and the days to cover are high, this indicates a high level of bearishness on the stock and, therefore, a short squeeze scenario.
High Short Interest % + High Days to Cover = Short Squeeze Potential
What is a short squeeze?
A short squeeze occurs when traders drive a stock price up, squeezing short sellers into a large loss situation. The short sellers have to scramble to buy the stocks back (cover) at a loss to avoid losing even more money. This covering causes the stock price demand to catapult higher, meaning good profits for the traders.
What is a high short interest?
A stock with high short interest is one with at least 6% of shares sold short by investors. This data is important because it can indicate how bearish or bullish investors are on a particular stock. For example, if the short interest is high, it could indicate that many investors believe that the stock price will fall in the future.
What is considered a high short interest?
Most investors consider a high short interest greater than 5%, but our data suggest that the 90th percentile of US stocks has a short interest of >5.7%. This means the highest shorted 10% of US stocks have a short interest of 5.7% or more.
NYSE & NASDAQ Stocks Short Interest Percent
| Short Interest Percentiles | Short Interest % |
| 10th Percentile | 0.9% – Low |
| Median | 2.0% – Average |
| 90th Percentile | 5.7% – High |
Table 1: Short Interest Percentile Distribution 4138 Nasdaq & NYSE Stocks – Researched by Liberated Stock Trader using Stock Rover
What is the average short interest in a stock?
According to our research, the median average short interest in a stock is 2% across the 4,138 largest capitalized companies on the Nasdaq and NYSE. (See Table 1 above)
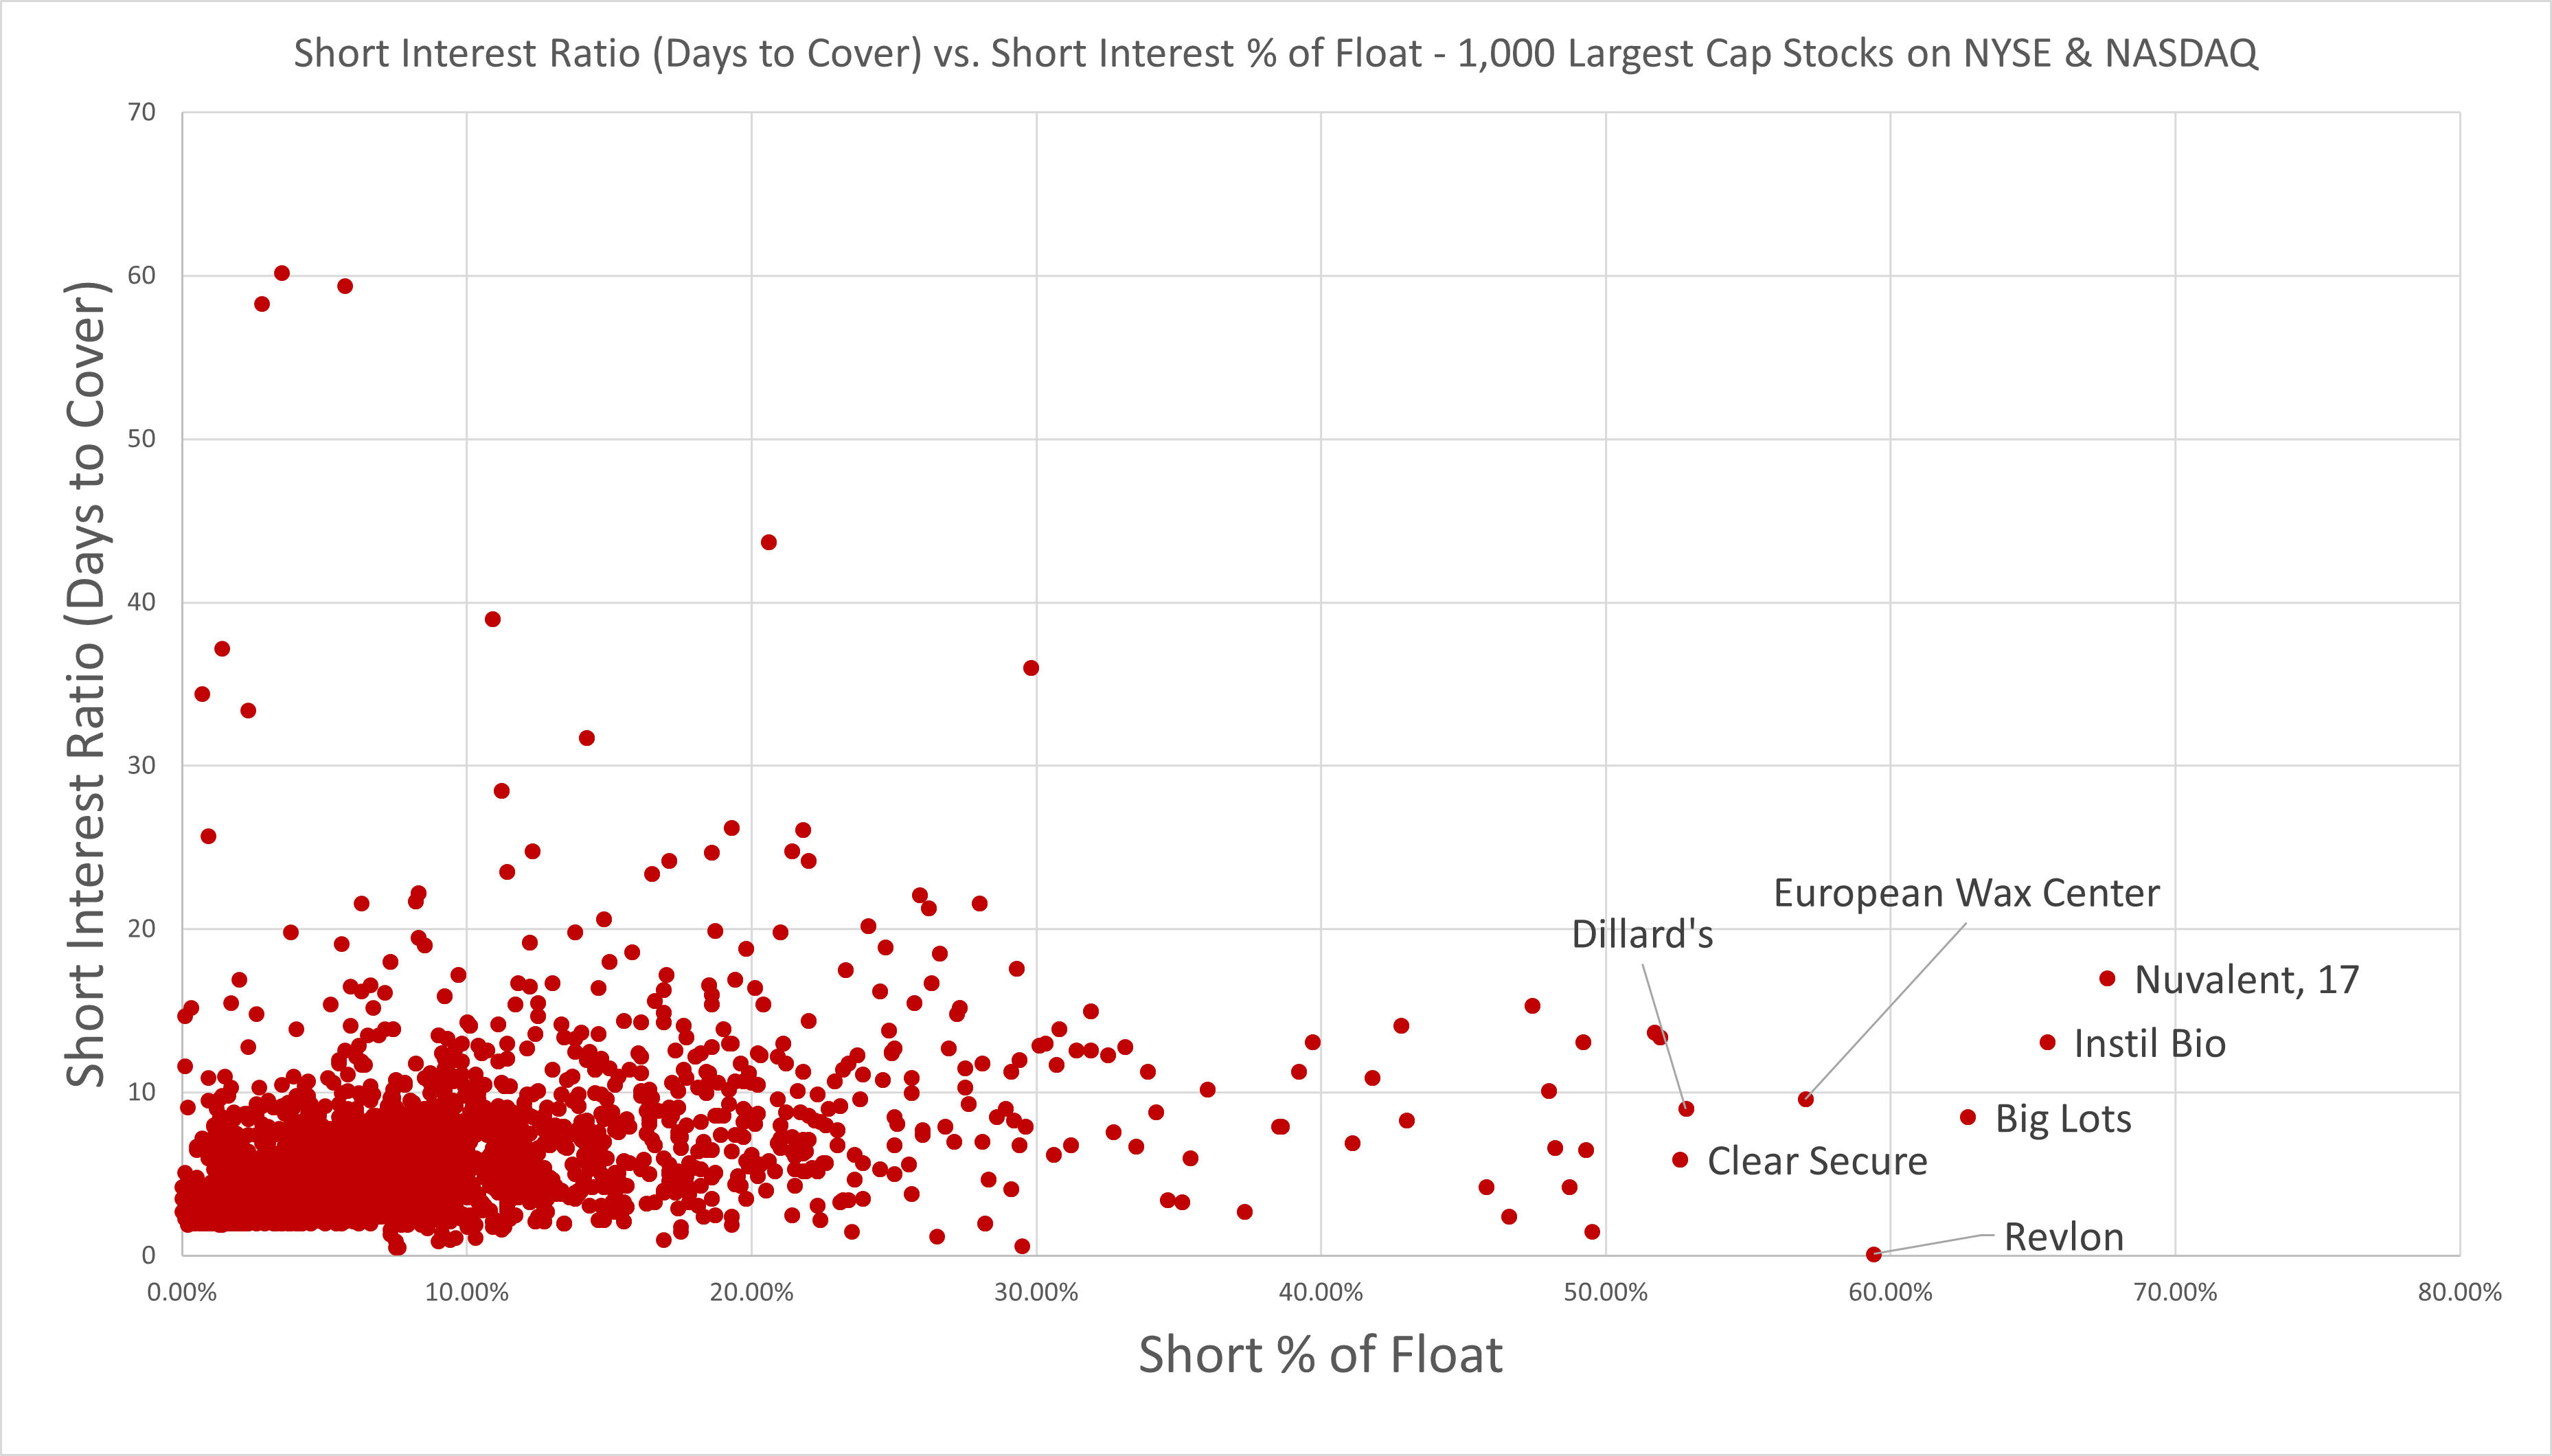
Chart: Short Interest % vs. Short Interest Ratio Distribution
What is high short-interest coverage?
Our research shows that high short-interest coverage is anything longer than 10 days, but the top 10% of short-interest coverage companies are more than 19 days.
The data in Chart 1 shows that when broken into percentiles and medians, the top 10% of companies with a high short interest ratio are above 19 days. The Median short interest coverage is 4.8 days, and the lowest 10% of stocks have coverage of 1.8 days.
NYSE & NASDAQ Stocks Short Interest Ratio/Coverage
The median average short interest coverage of 4,138 stocks on the NYSE and Nasdaq is 4.8 days. The longest short-interest ratio in the 90th percentile is 19.3 days.
| Short Interest Percentiles | Short Interest Coverage (days) |
| 10th Percentile | 1.8 – Low |
| Median | 4.8 – Average |
| 90th Percentile | 19.3 – High |
Table 2: Short Interest Percentile Distribution on 4138 Nasdaq & NYSE Stocks – Researched by Liberated Stock Trader using Stock Rover
4 Best ways to find a stock’s short interest?
1. Use Finviz to find a stock’s short interest
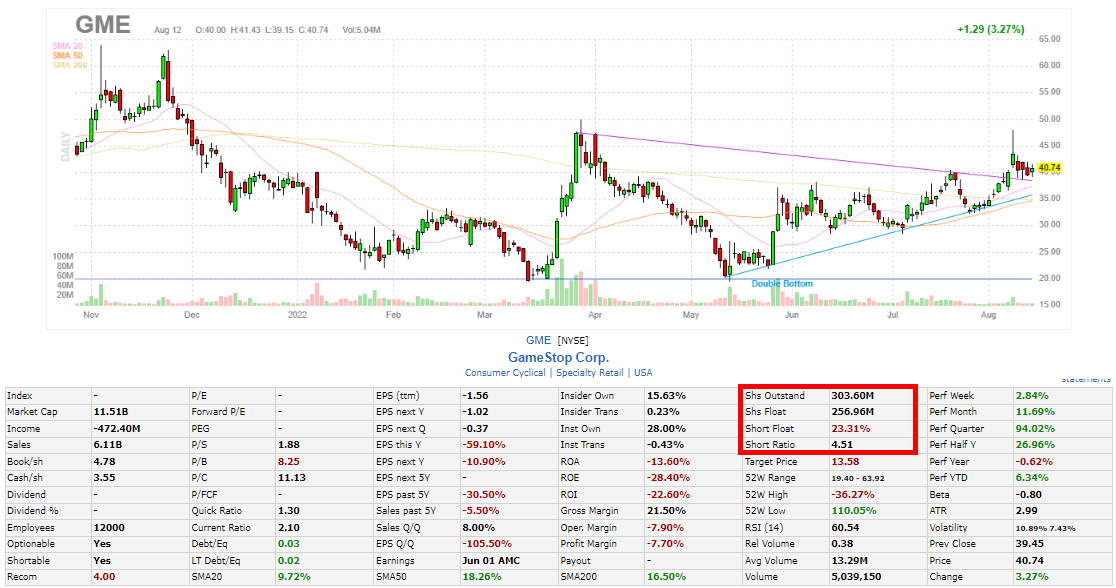
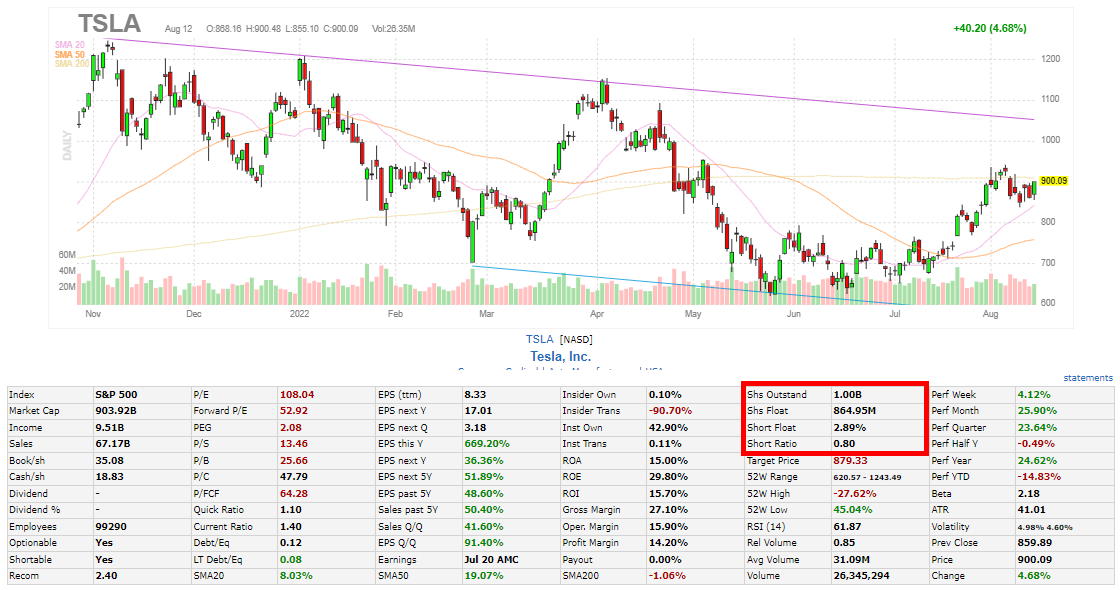
To see a stock’s short interest, visit Finviz, type in the stock ticker, and review the Short Float and Short Ratio fields. (See image below.)
Alternatively, you can see all stocks on Finviz with a float short > 20% here.
View All High Short Interest Stocks on FinViz
2. Use Stock Rover to scan for short-interest
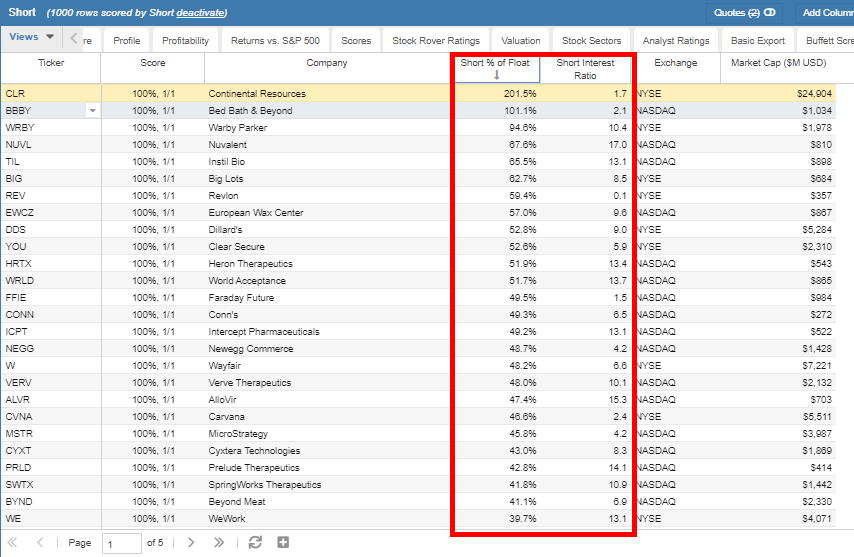
Stock Rover allows scanning the entire US stock market for short float percentages and short interest ratios. Select New Screener -> Criteria Short % float> 20%.
The image below shows the depth of short trading screening possible, 4,500 stocks to be exact.
Register for free with Stock Rover and import this screener code to get a complete list of stocks in the USA with a short interest ratio and short interest percent.
Stock Rover Screen 1.0
Short
{“description”:””}
{“name”:” Short”,” filterData”:[{“data”:[],” field”:” short_pct”,” excluded”:false},{“data”:{},” field”:” short_interest_ratio”,” excluded”:false},{“data” :{ “type”:” list”,” value” :[ “NA”,” NY”]},” field”:” exchange”,” excluded”:false},{“data”:[],” field”:” cap”,” excluded”:false}],” description”:””,” equityType”:” Stock”,” limit” :0,” universe”:3}
*===================================================*
Short
Criteria:
Short Interest Ratio
Exchange: NASDAQ, NYSE
Investing In Stocks Can Be Complicated, Stock Rover Makes It Easy.
Stock Rover is our #1 rated stock investing tool for:
★ Growth Investing - With industry Leading Research Reports ★
★ Value Investing - Find Value Stocks Using Warren Buffett's Strategies ★
★ Income Investing - Harvest Safe Regular Dividends from Stocks ★
"I have been researching and investing in stocks for 20 years! I now manage all my stock investments using Stock Rover." Barry D. Moore - Founder: LiberatedStockTrader.com
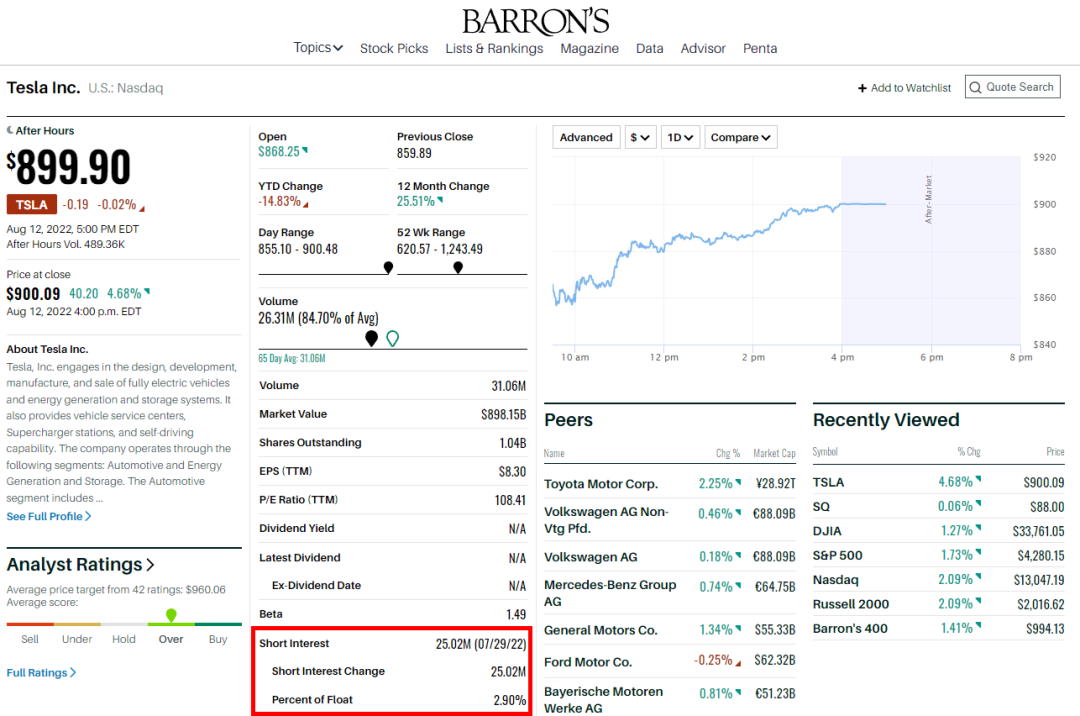
3. Visit Barron’s to see short interest information
Barron’s provides a simple way to see the short interest for a stock. Here is a link to the Barron’s page for Tesla, where you can see the company’s short interest information.
4. Other ways to find short-interest data
There are several different ways to find a stock’s short interest. One is to look at the major exchanges that it trades on. The New York Stock Exchange (NYSE) and Nasdaq have websites where you can view this information. Another is through online brokers such as E*TRADE and Charles Schwab. Finally, you can find this information from financial news websites such as Yahoo! Finance and CNBC.
How to Beat the Stock Market With Stock Rover

I love Stock Rover so much that I spent 2 years creating a growth stock investing strategy that has outperformed the S&P 500 by 102% over the last eight years. I used Stock Rover's excellent backtesting, screening, and historical database to achieve this.
This Liberated Stock Trader Beat the Market Strategy (LST BTM) is built exclusively for Stock Rover Premium Plus subscribers.
Is high short interest good or bad?
A high short interest is good for short sellers as it indicates a potential profit if the stock price falls. If the short interest percent and coverage are too high and a short squeeze occurs, it is bad for short sellers, forcing them to cover positions and take losses.
A high short interest is a good thing for investors because it indicates a lot of bearish investors in the market. This could indicate that the stock price will fall and that there could be a buying opportunity. Other investors believe that high short interest is bad because it indicates that many are betting against the stock. This could indicate that the stock price will fall and that you should avoid the stock.
Finding stocks with the highest short interest
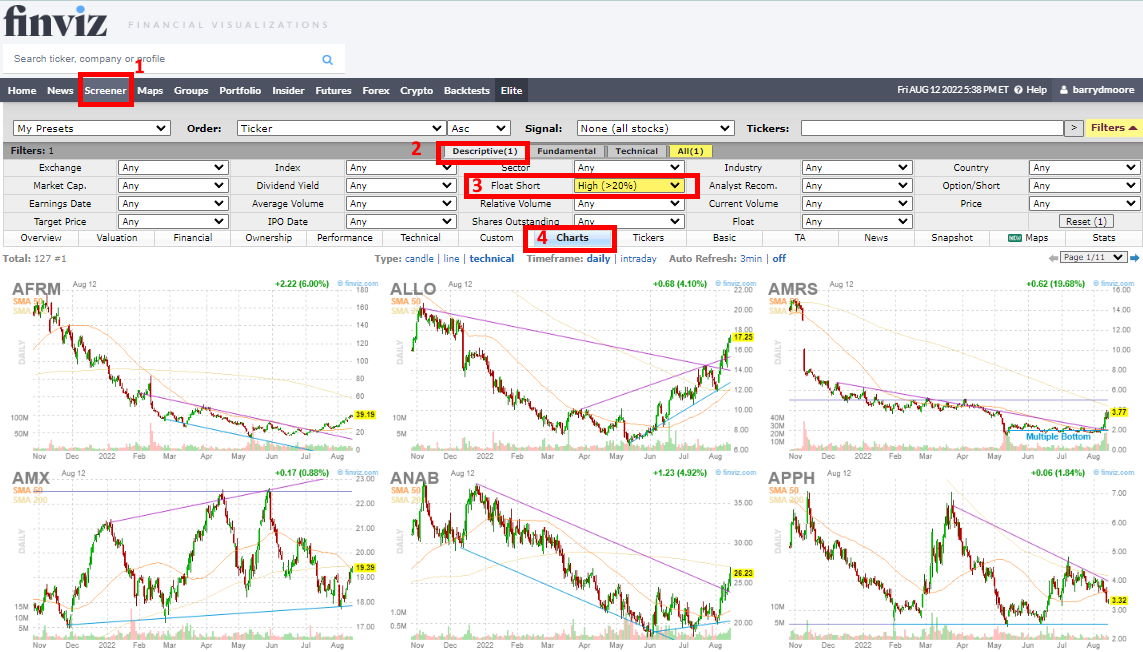
The quickest way to find stocks with high short interest is to use the Finviz stock screener; this link will jump straight to a list of high short-interest stocks. Alternatively, follow this easy 4-step process.
4 Steps to Find High Short Interest Stocks Using Finviz
- Visit Finviz and click on Screener
- Select Descriptive Filters
- Select Float Short > 20%
- Select Charts
View All High Short Interest Stocks on FinViz
Quick Links to the Highest Short Interest Stocks on Finviz
How to calculate short interest
To calculate short interest, you need to divide the number of shares sold short by the total number of shares outstanding. This data helps you understand how bearish or bullish investors are on a particular stock. For example, if the short interest is high, this could indicate that many investors believe that the stock price will fall in the future.
How often is short interest reported?
Short interest is reported on a bi-weekly basis by the exchanges. This means you will see updated information on how many shares have been sold short by investors every two weeks. For example, if the short interest is high, this could indicate that many investors believe that the stock price will fall in the future.
When is short interest reported?
Short interest report dates vary from month to month. The NYSE and Nasdaq typically disseminate short interest reports between the 9th-12th and 24th-27th days of every month. Further details on short-interest reporting data are found on the FINRA website.
How does short interest affect stock price?
Short interest can have a big impact on a stock’s price. When many investors are shorting a stock, it can pressure the stock price and cause it to fall. Conversely, when many investors buy a heavily shorted stock, it can pressure the stock price and cause it to rise; this is called a short squeeze.
Beat The Market, Avoid Crashes & Lower Your Risks
Nobody wants to see their hard-earned money disappear in a stock market crash.
Over the past century, the US stock market has had 6 major crashes that have caused investors to lose trillions of dollars.
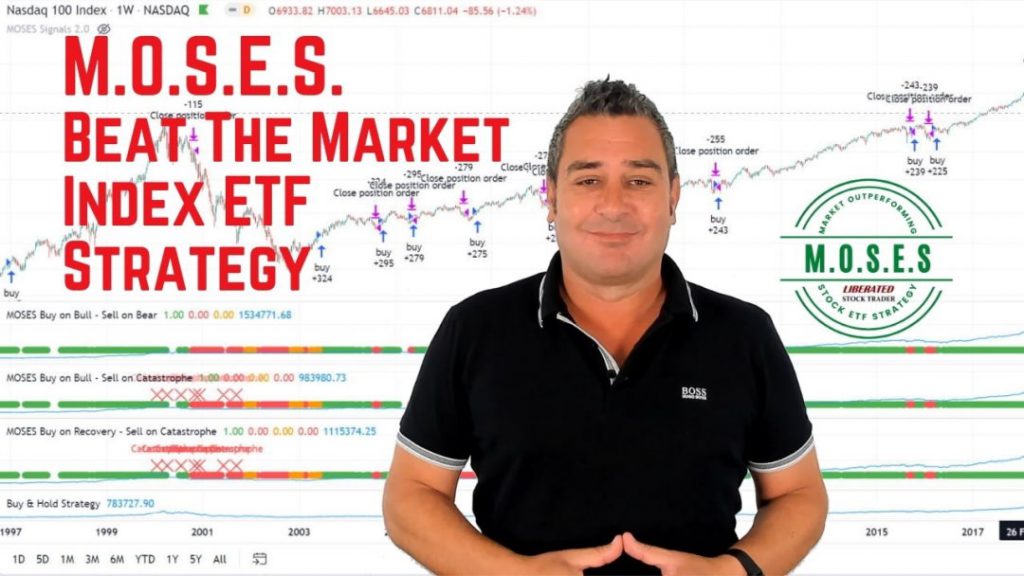
The MOSES Index ETF Investing Strategy will help you minimize the impact of major stock market crashes. MOSES will alert you before the next crash happens so you can protect your portfolio. You will also know when the bear market is over and the new rally begins so you can start investing again.
MOSES Helps You Secure & Grow Your Biggest Investments
★ 3 Index ETF Strategies ★
★ Outperforms the NASDAQ 100, S&P500 & Russell 3000 ★
★ Beats the DAX, CAC40 & EURO STOXX Indices ★
★ Buy & Sell Signals Generated ★
MOSES Helps You Sleep Better At Night Knowing You Are Prepared For Future Disasters
What is a short squeeze?
A short squeeze is when many investors buy a heavily shorted stock, which puts pressure on the stock price and causes it to rise. This is called a short squeeze because the shorts (investors who are betting against the stock) are getting squeezed out of their positions.
How can short interest exceed 100?
It is rare, but short interest can exceed 100% when many investors are betting against a stock and the number of shares sold short exceeds the number of shares outstanding. This can happen because naked short sellers do not borrow the stock; they sell it without owning it.
Which stocks have a short interest over 100%
Currently, there are no shortable stocks in the USA with a short interest of over 100%. The highest short-interest stocks are Fisker Inc. at 42%, Carvana Co. at 40%, and Edible Garden AG Inc. at 39%.
List of the Highest Short-Interest Stocks
The highest short-interest stocks are Fisker Inc., Carvana Co., Edible Garden AG Inc., Axcella Health Inc., and Beyond Meat Inc., each with a float short of over 35%.
| Ticker | Company | Float Short | Short Ratio |
| FSR | Fisker Inc | 42.62% | 9.62 |
| CVNA | Carvana Co. | 40.19% | 1.74 |
| EDBL | Edible Garden AG Inc | 38.99% | 0.34 |
| AXLA | Axcella Health Inc | 37.41% | 0.48 |
| UPST | Upstart Holdings Inc | 36.75% | 2.72 |
| AI | C3.ai Inc | 36.31% | 2.21 |
| BYND | Beyond Meat Inc | 36.24% | 8.4 |
| PROK | ProKidney Corp | 36.14% | 14.05 |
| GRPN | Groupon Inc | 34.12% | 4.09 |
| SAVA | Cassava Sciences Inc | 33.90% | 14.23 |
| LOVE | Lovesac Company | 33.78% | 14.39 |
| LMND | Lemonade Inc | 31.57% | 10.29 |
| SPWR | Sunpower Corp | 30.93% | 4.59 |
| ICPT | Intercept Pharmaceuticals Inc | 30.79% | 11.24 |
| CUTR | Cutera Inc | 30.73% | 7.54 |
| DM | Desktop Metal Inc | 30.45% | 27.6 |
| MARA | Marathon Digital Holdings Inc | 30.31% | 1.48 |
| ALLO | Allogene Therapeutics Inc | 30.26% | 13.03 |
| SWTX | SpringWorks Therapeutics Inc | 30.14% | 25.5 |
| STEM | Stem Inc | 30.11% | 9.6 |
| TRUP | Trupanion Inc | 29.83% | 10.43 |
| FATE | Fate Therapeutics Inc | 29.78% | 11.88 |
| NOVA | Sunnova Energy International Inc | 29.51% | 7.25 |
| ENVX | Enovix Corporation | 29.44% | 5.67 |
| CIFR | Cipher Mining Inc | 29.23% | 7.75 |
| GES | Guess Inc. | 28.79% | 7.91 |
| SCPH | scPharmaceuticals Inc | 28.48% | 18.29 |
| BIG | Big Lots Inc | 28.01% | 4.31 |
| CELH | Celsius Holdings Inc | 28.00% | 8.04 |
| ARQT | Arcutis Biotherapeutics Inc | 27.88% | 12.16 |
| VERV | Verve Therapeutics Inc | 27.82% | 19.65 |
| ZYXI | Zynex Inc | 27.60% | 15.1 |
| W | Wayfair Inc | 27.58% | 5.4 |
| BLNK | Blink Charging Co | 27.54% | 7.41 |
| BMEA | Biomea Fusion Inc | 27.48% | 11.94 |
| IGMS | IGM Biosciences Inc | 27.24% | 21.21 |
| EOSE | Eos Energy Enterprises Inc | 26.92% | 3.24 |
| PIK | Kidpik Corp | 26.84% | 0.05 |
| SLG | SL Green Realty Corp. | 26.33% | 7.41 |
| GOOS | Canada Goose Holdings Inc | 26.07% | 15.68 |
| CHPT | ChargePoint Holdings Inc | 25.95% | 6.85 |
| CELC | Celcuity Inc | 25.86% | 29.15 |
| LAZR | Luminar Technologies Inc | 25.60% | 10.45 |
| TWST | Twist Bioscience Corp | 25.60% | 13.22 |
| VRDN | Viridian Therapeutics Inc | 25.22% | 13.32 |
| BLUE | Bluebird bio Inc | 25.03% | 6.26 |
| DBGI | Digital Brands Group Inc | 24.89% | 0.38 |
| UHAL | U-Haul Holding Company | 24.83% | 13.5 |
| WIRE | Encore Wire Corp. | 24.81% | 15.76 |
| ABR | Arbor Realty Trust Inc. | 24.72% | 13.12 |
| SYM | Symbotic Inc | 24.59% | 5.44 |
| CPE | Callon Petroleum Co. | 24.46% | 7.49 |
| RVLV | Revolve Group Inc | 24.37% | 7.11 |
| SMX | SMX (Security Matters) Plc | 23.87% | 0.36 |
| SANA | Sana Biotechnology Inc | 23.82% | 26.38 |
| KRUS | Kura Sushi USA Inc | 23.69% | 11.36 |
| CMPO | CompoSecure Inc | 23.67% | 22.6 |
| LCID | Lucid Group Inc | 23.65% | 4.74 |
| SRG | Seritage Growth Properties | 23.58% | 23.65 |
| RLAY | Relay Therapeutics Inc | 23.48% | 20.5 |
| ASTS | AST SpaceMobile Inc | 23.48% | 7.72 |
| ELVN | Enliven Therapeutics Inc | 23.47% | 32.39 |
| JOAN | JOANN Inc | 23.33% | 5.18 |
| MSTR | Microstrategy Inc. | 23.20% | 3.91 |
| EBIX | Ebix Inc. | 23.15% | 8.01 |
| DISH | Dish Network Corp | 23.08% | 5.89 |
| FFIE | Faraday Future Intelligent Electric Inc | 23.08% | 1.62 |
| RNA | Avidity Biosciences Inc | 23.06% | 20.87 |
| EXPI | eXp World Holdings Inc | 23.05% | 16.66 |
| PLCE | Childrens Place Inc | 22.84% | 4.68 |
| MVIS | Microvision Inc. | 22.81% | 15.19 |
| HRMY | Harmony Biosciences Holdings Inc | 22.80% | 14.49 |
| PLUG | Plug Power Inc | 22.52% | 5.72 |
| TUP | Tupperware Brands Corporation | 22.32% | 0.36 |
| BCRX | Biocryst Pharmaceuticals Inc. | 22.29% | 16.29 |
| PCT | PureCycle Technologies Inc | 22.16% | 12.43 |
| BOH | Bank of Hawaii Corp. | 22.12% | 12.08 |
| SMR | NuScale Power Corporation | 22.04% | 8.19 |
| COLL | Collegium Pharmaceutical Inc | 21.93% | 25.03 |
| VTLE | Vital Energy Inc. | 21.91% | 5.73 |
| MPW | Medical Properties Trust Inc | 21.85% | 10.7 |
| BTAI | BioXcel Therapeutics Inc | 21.75% | 1.45 |
| UWMC | UWM Holdings Corporation | 21.59% | 16.79 |
| WKHS | Workhorse Group Inc | 21.54% | 3.85 |
| BFRG | Bullfrog AI Holdings Inc | 21.53% | 0.26 |
| DFH | Dream Finders Homes Inc | 21.53% | 14.77 |
| PAG | Penske Automotive Group Inc | 21.51% | 10.24 |
| CNK | Cinemark Holdings Inc | 21.47% | 8.63 |
| AXSM | Axsome Therapeutics Inc | 21.38% | 9.58 |
| EGLE | Eagle Bulk Shipping Inc | 21.36% | 6.8 |
| RYTM | Rhythm Pharmaceuticals Inc. | 21.34% | 13.16 |
| AVXL | Anavex Life Sciences Corporation | 21.27% | 19.89 |
| HELE | Helen of Troy Ltd | 21.08% | 12.76 |
| VUZI | Vuzix Corporation | 20.98% | 20.71 |
| MCRB | Seres Therapeutics Inc | 20.97% | 9.67 |
| SFT | Shift Technologies Inc | 20.85% | 12.12 |
| ACHR | Archer Aviation Inc | 20.83% | 3.25 |
| OTLK | Outlook Therapeutics Inc | 20.81% | 4.73 |
| DAWN | Day One Biopharmaceuticals Inc | 20.81% | 14.31 |
| WGO | Winnebago Industries, Inc. | 20.72% | 15.14 |
Table 3: 100 High Short Interest Stocks Over 20%
View All High Short Interest Stocks on FinViz
Tesla short interest
Tesla is a popular stock that traders look to short sell or put pressure on a short squeeze. We can see on Finviz that a short squeeze is not a real possibility with Tesla, as the short float and short ratio are too small.
See Tesla’s Short Interest on Finviz
AMC short interest
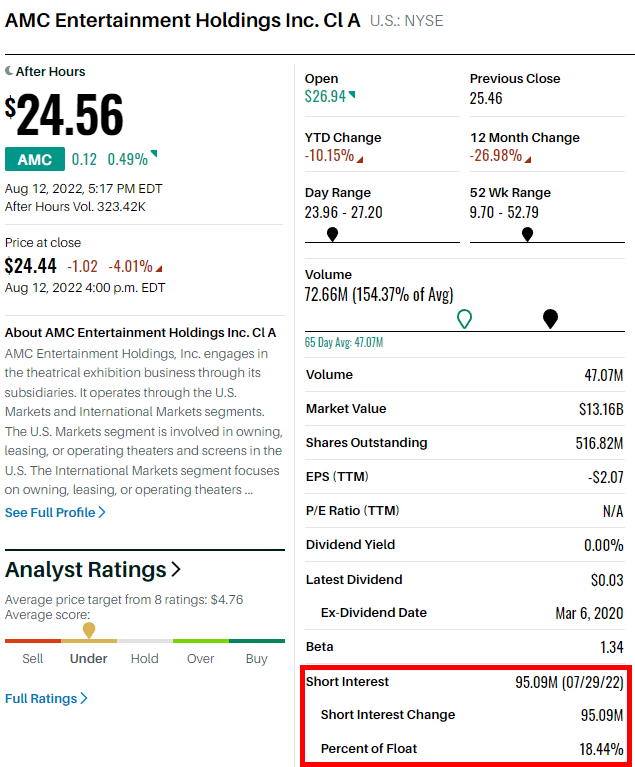
While the Reddit investors continue to play short-squeeze opportunities, Barrons reports a short interest float of 18%.
See AMC’s Short Interest on Finviz
GME short interest
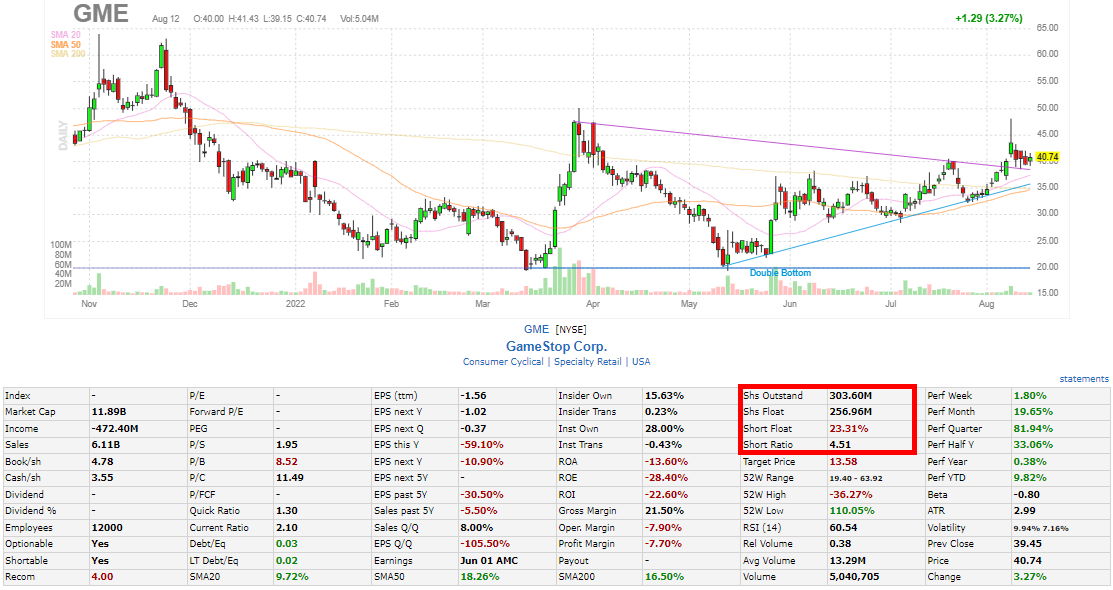
Gamestop is still in an interesting short squeeze opportunity category with a short float of 23% and a short ratio of 4.51.
See GameStop’s Short Interest on Finviz
Short interest measures how many shares of a particular stock have been sold short by investors. It can gauge investor sentiment on a particular stock and provide insight into whether investors believe the stock price will go up or down in the future. A high short-interest ratio indicates that many investors believe the stock price will fall. In contrast, a low short-interest ratio indicates that many investors believe the stock price will increase. Short interest is typically reported bi-weekly.
FAQ
What is the best software for finding high short interest stocks?
Our testing shows Finviz and Stock Rover are the best platforms for finding the highest short interest stocks. Finviz has filtering criteria for float short, option/short, short interest, and bearish chart patterns, which are essential for short sellers.
What is short interest in stocks?
Short interest refers to the quantity of a company's shares that have been sold short but not yet covered or closed out. It indicates the market sentiment towards the stock and can be used as a potential indicator of future stock price direction.
How is short interest calculated?
Short interest is calculated by dividing the number of shares sold short by the total shares outstanding. The result is expressed as a percentage, providing insight into the relative negative sentiment towards the stock.
What does a high short interest mean?
A high short interest signifies that a large portion of a company's stock is being shorted. This could indicate widespread negative sentiment about the company's prospects, potentially leading to downward pressure on the stock price.
What does a low short interest mean?
A low short interest suggests less negative sentiment towards the stock. This could be a positive sign for investors, indicating that most market participants expect the stock price to rise.
What is considered a high short interest?
Our data shows a high short interest float is above 6%, this represents the 90th percentile of highly shorted stocks in the USA.
What is considered a high short interest ratio/coverage?
Our research suggests a high short interest ratio (days to cover) is 19 or greater. This represents the top 90th percentile of stocks in the USA.
Why is short interest important?
Short interest is a key indicator of market sentiment. High short interest can be bearish, while low short interest can be bullish. Additionally, a sudden increase in stock price, with a high short interest, can signal a potential short squeeze.
What is a short squeeze?
A short squeeze occurs when a heavily shorted stock's price suddenly rises, forcing short sellers to buy it to cover their positions. This buying pressure can drive the stock price even higher, potentially resulting in substantial losses for short sellers.
How often is short interest reported?
In the U.S., the National Association of Securities Dealers and the New York Stock Exchange report short interest twice a month. Investors can access this information through various financial news and data providers.
Can short interest exceed 100%?
Yes, short interest can exceed 100%. This occurs when more shares are shorted than are available for trading. This situation is rare and usually happens with smaller, less liquid stocks.
What is the relationship between short interest and stock price?
There's an inverse relationship between short interest and stock price. High short interest can put downward pressure on a stock's price, while low short interest can result in upward pressure.
How can I use short interest as part of my trading strategy?
Traders can use short interest to identify short squeezes. Look for short interest above 20% and a short interest ratio greater that 19 days.
What is the 'days to cover' ratio?
The 'days to cover' or "short interest" ratio measures how long it would take all short sellers to cover their positions if the stock price rises. It's calculated by dividing the short interest by the stock's average daily volume.
How is short interest used in technical analysis?
In technical analysis, short interest is often used as a contrarian indicator. High short interest can signal a potential reversal in the stock's trend if a short squeeze occurs.
Where can I find information on a company's short interest?
Information on a company's short interest can be found in financial news outlets, Finviz, stock screeners, or the exchange where the company's stock is listed.
Does short interest impact dividends?
Yes, short sellers are typically required to pay any dividends to the lender of the stock. Therefore, a high dividend yield could discourage short selling and reduce short interest.
Is short interest a reliable predictor of stock performance?
No, while short interest can provide valuable insight into market sentiment, it should not be used to predict stock performance in isolation. It's best used in conjunction with other financial indicators and fundamental analysis.

nice. good work Barry!