A stock screener helps investors sift through a vast number of stocks to find those that meet specific investing criteria. This makes the process of choosing where to invest easier and more efficient.
Professional stock screening requires a clear investing methodology based on growth, value, dividend, or short-term trading. Next, select the right tools and implement your specific criteria.
By using filters like price, earning, market capitalization, and dividend yield, investors can narrow down their choices to stocks that fit their investment strategy.
Our complete guide will help you understand the types of stock screeners, the strategies, and the criteria to use.
Key Takeaways
- A stock screener uses filters to help investors find stocks that match their criteria.
- Setting up filters based on investment goals saves research time and focuses efforts.
- Knowing your investing strategy will help define your criteria.
- Each of the core strategies, such as value, dividend, or growth investing, has specific criteria.
Setting up your stock screener involves selecting the right filters based on your goals, whether you aim for growth, dividends, or undervalued stocks. This initial setup can save hours of research and help focus your efforts on the most promising stocks. Many investors find that using a stock screener helps them stay objective and focused on their investing criteria.

Understanding Stock Screeners
Stock screeners help investors narrow down choices based on specific criteria, simplifying the selection process. They use various tools and filters to identify top-performing stocks or ETFs.
Types of Stock Screeners
Stock screeners come in different forms, catering to diverse investing needs. Fundamental screeners focus on financial metrics like P/E ratio, dividend yield, and earnings growth. Technical screeners use chart patterns and technical indicators like moving averages and RSI. Finally, hybrid screeners combine both fundamental and technical analysis to provide a comprehensive view.
Another popular type is the ETF screener, which specifically targets exchange-traded funds. Many screeners offer both free and premium versions, allowing users to test basic functionalities before committing. Selecting the right type of screener depends on the investor’s strategy and goals.
Key Features of Effective Screeners
Effective stock screeners offer a range of features to enhance the screening process. Customizable filters are essential, allowing users to set specific criteria such as market cap, sector, and dividend yield. Predefined screens, templates based on popular screening strategies, are also useful, saving time and effort.
The ability to save screener settings for future use is a must. This helps users avoid resetting criteria each time they use the tool. Besides, real-time data updates and historical data access enable more precise and informed decisions.
A user-friendly interface with a clear layout and navigation is also crucial. The tool should present data in an easily understandable format, often through tables, charts, or lists. This way, even new users can operate the screener efficiently.
Selecting a Screener Based on an Investing Strategy
There are many stock screeners available on the market, and they all have different features and benefits for different strategies. Some screeners, like Stock Rover or ChartMill, specialize in long-term dividend, value, and growth investing. Others, like TrendSpider, TradingView, and FinViz, allow scanning the market for trading based on patterns, volume, and technical criteria.
| Screener Features |
Stock Rover | TrendSpider | TradingView | Finviz | Chartmill |
| Awards | |||||
| Rating |
4.8 | 4.8 | 4.7 | 4.4 | 4.0 |
| Best for: | Investors | Traders | Traders | Traders | Investors |
| Growth Investing | ✅ | ❌ | ❌ | ❌ | ✅ |
| Value Investing | ✅ | ❌ | ❌ | ❌ | ❌ |
| Dividend Investing | ✅ | ❌ | ❌ | ❌ | ✅ |
| Day & Swing Trading | ❌ | ✅ | ✅ | ✅ | ✅ |
| Free Plan | ✅ | ❌ | ✅ | ✅ | ❌ |
| Pricing |
Free or $28/m or $23/m annually | $107/m or $48/m annually | Free | $13/m to $49/m annually | $39.50/mo or $25/m annually | $30/m or $22.50/m annually |
| Financial Screening |
✅ | ✅ | ✅ | ✅ | ✅ |
| 10-Year Financials | ✅ | ❌ | ❌ | ❌ | ❌ |
| Portfolio Management |
✅ | ❌ | ❌ | ❌ | ❌ |
| Research Reports | ✅ | ❌ | ❌ | ❌ | ❌ |
| Chart Pattern Scanning |
❌ | ✅ | ✅ | ✅ | ❌ |
| AI Stock Screening |
❌ | ✅ | ❌ | ❌ | ❌ |
| Candle Pattern Scanning | ❌ | ✅ | ✅ | ✅ | ✅ |
| Indicator Scanning | ❌ | ✅ | ✅ | ✅ | ✅ |
| Financial News |
✅ | ✅ | ✅ | ✅ | ✅ |
| News Scanning | ❌ | ✅ | ❌ | ❌ | ✅ |
| Stocks & ETFs | ✅ | ✅ | ✅ | ✅ | ✅ |
| FX/Commodity | ❌ | ✅ | ✅ | ❌ | ❌ |
| USA & Canada | ✅ | ✅ | ✅ | ✅ | ❌ |
| Global Market Data | ❌ | ❌ | ✅ | ❌ | ✅ |
| Read the Review & Test | Stock Rover | TrendSpider | TradingView | FinViz | Chartmill |
Growth Investing Strategy & Screeners
Suppose you are a long-term investor looking for stocks with strong fundamentals and potential for growth. In that case, your screening strategy may focus on metrics such as revenue growth, earnings per share (EPS), price-to-earnings ratio (P/E), and return on equity (ROE). These metrics can help identify companies that have a track record of consistent growth and have the potential to continue growing in the future.
Growth Strategy Criteria
The Canslim method, created by William O’Neil, is a popular growth investing strategy that involves identifying stocks with strong earnings growth, high relative strength, and increasing institutional ownership. This method also considers the overall market trend and economic conditions.
CANSLIM Stock Screener Criteria
The CANSLIM screener criteria we are using are as follows:
- Current Earnings – EPS (MRQ) >= 1.18* EPS [Q4]
- Annual Earning – EPS 5-Year Average (%) > 24.9
- New Price High – Price vs. 52-week high (%) >84
- Supply – Shares Available (Millions) > 9
- Leader – Relative Strength Index > 69
- Institutional Ownership % > 35
- Market Direction – Is the Market Trend Up?
Screeners for Growth Investing
According to my testing, Stock Rover is the best screener for long-term growth investing because it has all the criteria needed for the CANSLIM strategy. Additionally, advanced strategies based on comparative performance versus the S&P 500, such as the Liberated Stock Trader Beat the Market Strategy.
ChartMill offers screeners specifically designed for long-term dividend and growth investors. With their screener tool, you can filter stocks based on various fundamental criteria such as revenue growth, EPS growth, P/E ratio, and ROE. Their system also allows you to set specific parameters for each criterion to narrow down your search even further.
Dividend Investing Strategy & Screeners
Dividend investing may be the way to go for those looking for stocks that provide a steady stream of income. Dividend screening focuses on metrics such as dividend yield, payout ratio, and dividend growth rate. Companies with a history of increasing dividends and a sustainable payout ratio can be good candidates for long-term dividend investing.
Dividend Growth Strategy Criteria
Stock Rover is ideal for looking at a company’s dividend potential; it is important to consider not just its current dividend yield but also its history of dividend growth. A company that consistently increases its dividends over time shows strong financial stability and commitment to returning value to shareholders. Another factor to consider is the company’s payout ratio. This refers to the percentage of earnings that are paid out as dividends. A lower payout ratio indicates that the company has room for future dividend growth, while a high payout ratio may be unsustainable in the long run.
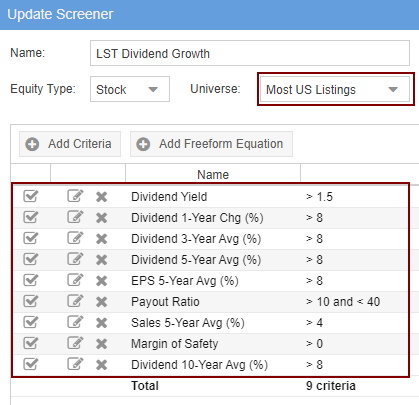
- Dividend Yield > 1.5%. This is a simple filter designed to ensure only companies paying a dividend above 1.5% are listed—anything less than 1.5% will not even payout in line with inflation.
- Dividend 1 Year Change > 8%. This criteria helps you find companies with increased dividends of over 8% in the last fiscal year. Companies that have increased dividends in the past year usually continue to do so in the future.
- Dividend 3-Year Change > 8%. This criteria helps you find companies with increased dividends over the last three years over 8%.
- Dividend 5-Year Change > 8%. This criteria helps you find companies with increased dividends of over 8% in the last five years. Companies that have consistently increased their dividends for five straight years are usually strong, well-managed, and able to reward shareholders through increased dividend payments.
- Dividend 10-Year Change > 8%. Continuing the dividend change criteria to 10 years ensures consistent growth throughout the entire 10-year period. Of course, you can change these criteria to suit market conditions and broaden the stock selection.
- Payout Ratio >10 < 40. The payout ratio ensures the company makes enough profits to continue paying dividends and sustain the increases. You can reduce the “<10” to see more stocks in the scan. We do not want companies to pay more than 40% of their profits in dividends; they must retain cash flow for future growth and capital investments.
- Sales 5-Year Average (%) > 4%. We want to see that the company has consistently grown sales over the past 5 years. You can adjust the percentage to suit your own criteria, but we find that 4% is an acceptable growth rate for larger companies.
- Earnings Per Share 5-Year Average (%) > 8%. The 5-year average EPS should be at least 8% or more. This tells us that the company is generating sufficient profits to pay dividends, and earnings should grow, too. Again, you can adjust this percentage to suit your own criteria.
A 5 Step Screening Strategy To Find Top Dividend Growth Stocks
Screeners for Dividend Investing
Again, Stock Rover is the standout screener for dividend investing. It offers the broadest array of selectable dividend metrics and even has options for screening against dividend ETFs. It is perfect for both beginners and experienced investors.

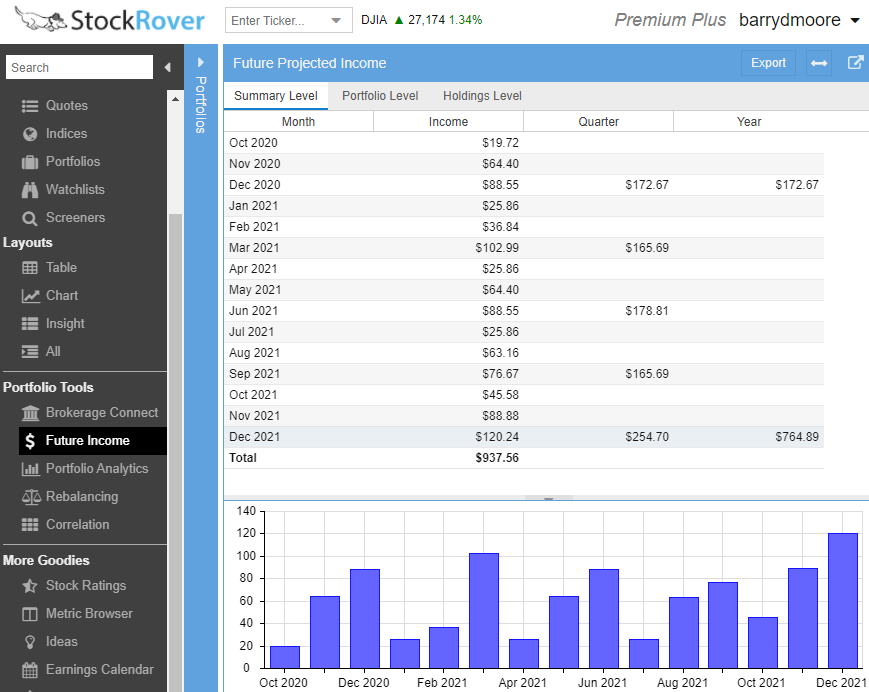
Stock Rover also helps you forecast dividend income based on your screener results. You can also manage and analyze your dividend portfolio, perform rebalancing, and connect to your broker.

Value Investing Strategy & Screeners
Value investing involves finding companies that are undervalued by the market, with a focus on metrics like price-to-book ratio, price-to-earnings ratio, and free cash flow. By identifying these undervalued stocks, investors can potentially benefit from long-term growth as the market eventually recognizes their true value.
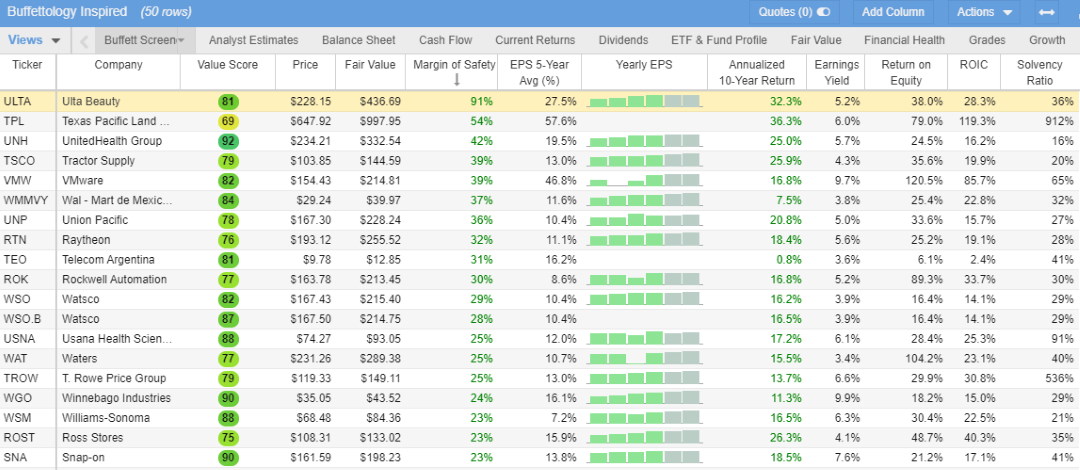
This first step looks at the key financial metrics against which to screen for value stocks. The New Buffettology outlines the most detailed analysis of Buffett’s value investing methodology, including the two most important value investing criteria: Fair Value (Intrinsic Value) and Margin of Safety.
Dividend Growth Strategy Criteria
- Fair Value 30% Higher Than Share Price: Fair value is how much future cash a business will generate and discount it against inflation. This is called the Discounted Cashflow Method. Read more about Fair Value (Intrinsic Value).
- Margin of Safety > 20% (Only available in Stock Rover): The Margin of Safety is the percentage difference between a company’s Fair Value and its actual stock price. This metric is the most significant valuation metric in value investing, as it is the final output of a detailed discounted cash flow analysis.
- Return on Equity (ROE) 0> 15%: Return on equity (ROE) is a profitability measure calculated as net income as a percentage of shareholders’ equity. A high ROE shows an effective use of investors’ money to grow the business’s value.
- Yearly EPS growth Year on Year: Earnings per share (EPS) is an important metric for Buffett and Wall Street. Buffett looks for companies with a consistent track record of earnings growth, particularly over a 5 to 10-year period.
Building the Best Buffett Stock Screener for Value Investing
Screeners for Value Investing
Stock Rover stands as the sole stock screener and analysis platform on the market that empowers you to utilize an authentic Buffett value stock screener. This exceptional tool is none other than Stock Rover, which clinched the title of our Best Value Investing Stock Screener.

Finviz, Chartmill, TradingView, and TrendSpider all lack the value investing criteria needed to find undervalued stocks.
Swing & Day Trading Screeners
For those looking for more short-term trading opportunities, swing and day trading may be the way to go. Swing traders typically hold positions for a few days to weeks, while day traders buy and sell stocks within the same trading day.
Screening Criteria for Trading
As an active trader, I find the important screening features to be completely different from those of long-term investors. Trading Screeners and scanners require:
- Realtime Data
- Candle & Pattern Recognition
- Backtesting
- A wide choice of charts and indicators
Screeners for Day Trading
As you can see, there is fierce competition for screeners designed for short-term traders. According to my testing, there are three leading platforms. TrendSpider, Trade Ideas and TradingView.
| Features |
TrendSpider | Trade-Ideas | TradingView | Finviz |
| Awards | ||||
| Rating |
4.8 | 4.7 | 4.6 | 4.4 |
| Best for Day & Swing Trading | ✅ | ✅ | ✅ | ✅ |
| Free Plan | ❌ | ❌ | ✅ | ✅ |
| Pricing |
$107/m or $48/m annually | $254/m or $178/m annually | Free | $13/m to $49/m annually | $39.50/mo or $25/m annually |
| Chart Pattern Scanning |
✅ | ✅ | ✅ | ✅ |
| AI Stock Screening |
✅ | ✅ | ❌ | ❌ |
| Backtesting |
✅ | ✅ | ✅ | ❌ |
| Point & Click Backtesting |
✅ | ❌ | ❌ | ❌ |
| Candle Pattern Scanning |
✅ | ✅ | ✅ | ✅ |
| Indicator Scanning | ✅ | ✅ | ✅ | ✅ |
| Financial News |
✅ | ✅ | ✅ | ✅ |
| News Scanning | ✅ | ✅ | ❌ | ❌ |
| Stocks & ETFs | ✅ | ✅ | ✅ | ✅ |
| FX/Commodity | ✅ | ❌ | ✅ | ❌ |
| USA & Canada | ✅ | ✅ | ✅ | ✅ |
| Global Market Data | ❌ | ❌ | ✅ | ❌ |
TrendSpider offers robust multi-layer screening tailored for US traders. For those interested in trading global markets, TradingView stands out as the premier stock scanner. Day traders can benefit from Trade Ideas, the top black-box AI-powered stock scanner, while Finviz serves as a swift, efficient, and free stock screener.
LiberatedStockTrader’s Data-Driven Guide to Day Trading Strategy & Tools
Final Thoughts
Examining market trends involves looking at the wider economic environment to understand how it might impact stock prices. Investors use a stock screener to identify sectors that are performing well.
For instance, during periods of economic growth, sectors like technology and consumer goods often see increased stock prices. In contrast, utilities and healthcare might perform better during downturns due to their stability.
Market conditions, such as interest rates or government policies, can also affect trends. A stock screener helps filter stocks based on these criteria, allowing investors to focus on sectors with positive momentum.
Comparing Companies and Stocks
A stock screener lets investors compare companies based on various metrics, such as market cap, profitability, and revenue. Investors can set criteria to filter companies that match their investment goals.
For example, if one is seeking stable investments, one might look for companies with high market caps and low volatility. Conversely, those interested in growth might prioritize companies with rising revenues and expanding profit margins.
Detailed comparison involves contrasting financials between companies to see which offers better potential. This process can highlight undervalued stocks or those with strong growth prospects, helping investors make more strategic choices.
Assessing Financial Health and Growth
Assessing a company’s financial health is crucial. Financial indicators, such as earnings per share (EPS), debt-to-equity ratio, and cash flow, play a crucial role in analysis.
A stock screener helps filter companies by financial health metrics to find those with solid balance sheets. Growth metrics, like revenue growth and earnings growth, help investors identify companies that are not only financially sound but also on an upward trajectory.
This part of the analysis ensures that selected stocks are not only performing well now but are poised for future growth. This comprehensive assessment helps build a strong and resilient investment portfolio.
FAQ
What is the best screener for value investors?
According to my testing, Stock Rover is the best screener for value investing because it is the only platform with the margin of safety, fair value, and DCF criteria.
What are the steps for beginners using a stock screener?
To start, beginners should define their investment goals and set specific criteria like market cap, PE ratio, and dividend yield in the screener. Reviewing and analyzing the screened stocks helps determine the best investments.
What is the best screener for dividend investors?
According to my research, Stock Rover is the leading screener for dividend investing because it helps you filter, plan, and forecast future dividend income.
How do you apply a stock screener for day trading?
For day trading, set up the screener to find stocks with high liquidity and volatility. Key criteria include trade volume, price changes, and intraday price movements. This helps identify stocks with the potential for quick gains within a single trading day.
What are effective strategies for screening stocks for long-term investments?
Long-term investors should focus on fundamentals like earnings growth, return on equity, and debt levels—They should screen for companies with a strong market position and consistent performance. For a balanced portfolio, they should incorporate parameters like dividend yield and price-to-earnings ratio.
Can you use a stock screener without cost, and if so, how?
Yes, the three free stock screeners I recommend are Stock Rover for investors and Tradingview for international traders who value a global community.
What is the best screener for traders?
For day trading, I would recommend Trade Ideas because of its AI-powered algorithms and TrendSpider due to its powerful trading bots, pattern recognition, scanning, and backtesting.
What are the benefits of using a stock screener in investing?
A stock screener helps investors quickly find stocks that meet specific criteria. This saves time and simplifies the process of identifying investment opportunities. It allows for analysis based on various financial metrics and trends, leading to more informed decisions.
