Benjamin Graham, known as the father of value investing, developed a special formula to help investors determine if a stock is undervalued.
The Graham Number combines earnings per share (EPS) and book value per share (BVPS) to provide a quick snapshot of a company’s valuation. Investors can compare this number to the stock’s current price to decide if it’s undervalued.
Using the Graham Number can help investors target undervalued stocks with strong fundamentals, ensuring a lower risk in the investment process.
Key Takeaways
- The Graham Number helps evaluate if a stock is undervalued.
- It combines earnings per share and book value per share.
- This method helps value investors target undervalued stocks.
- If the Graham number is less than the stock price, it is a candidate for investment.

Understanding the Graham Number
The Graham Number is a key metric in value investing. It helps investors determine a stock’s fair value by considering its earnings and book value.
Benjamin Graham designed it to identify undervalued stocks. Graham introduced this concept in his book, “The Intelligent Investor.” The idea is to ensure a margin of safety in investments by focusing on stocks with strong financials. By looking at both a company’s earnings and its book value, investors can analyze a stock effectively.
Components of Graham Number
The Graham Number consists of two key components: Earnings Per Share (EPS) and Book Value Per Share (BVPS).
- Earnings Per Share (EPS) measures a company’s profitability by dividing net income by the number of outstanding shares.
- Book Value Per Share (BVPS) represents the value of a company’s assets minus its liabilities, divided by the number of outstanding shares. It indicates a company’s intrinsic value.
Both components are crucial for ensuring that an investment has a solid foundation in terms of profitability and asset value. By combining these factors, the Graham Number provides a clear metric for identifying undervalued stocks.
Calculating Graham Number
The formula for calculating the Graham Number is straightforward. It involves multiplying the company’s Earnings Per Share (EPS) by its Book Value Per Share (BVPS).
The formula is:
Graham Number = Square Root of (22.5 x EPS x BVPS)
Where:
- EPS = Net Income / Number of Outstanding Shares
- BVPS = (Total Assets – Total Liabilities) / Number of Outstanding Shares
- 22.5 = the maximum P/E ratio that Graham recommends
The resulting value is the Graham Number, which can then be compared to the current stock price to determine if it is undervalued or overvalued. If the Graham Number is higher than the current stock price, it indicates that the stock may be undervalued and, therefore, a good potential investment.
Interpreting the Result
The result of the calculation will give you a figure that represents the maximum price an investor should pay for a stock. If the current market price is lower than this calculated value, it could indicate that the stock is undervalued and potentially a good investment opportunity.
Charting the Graham Number
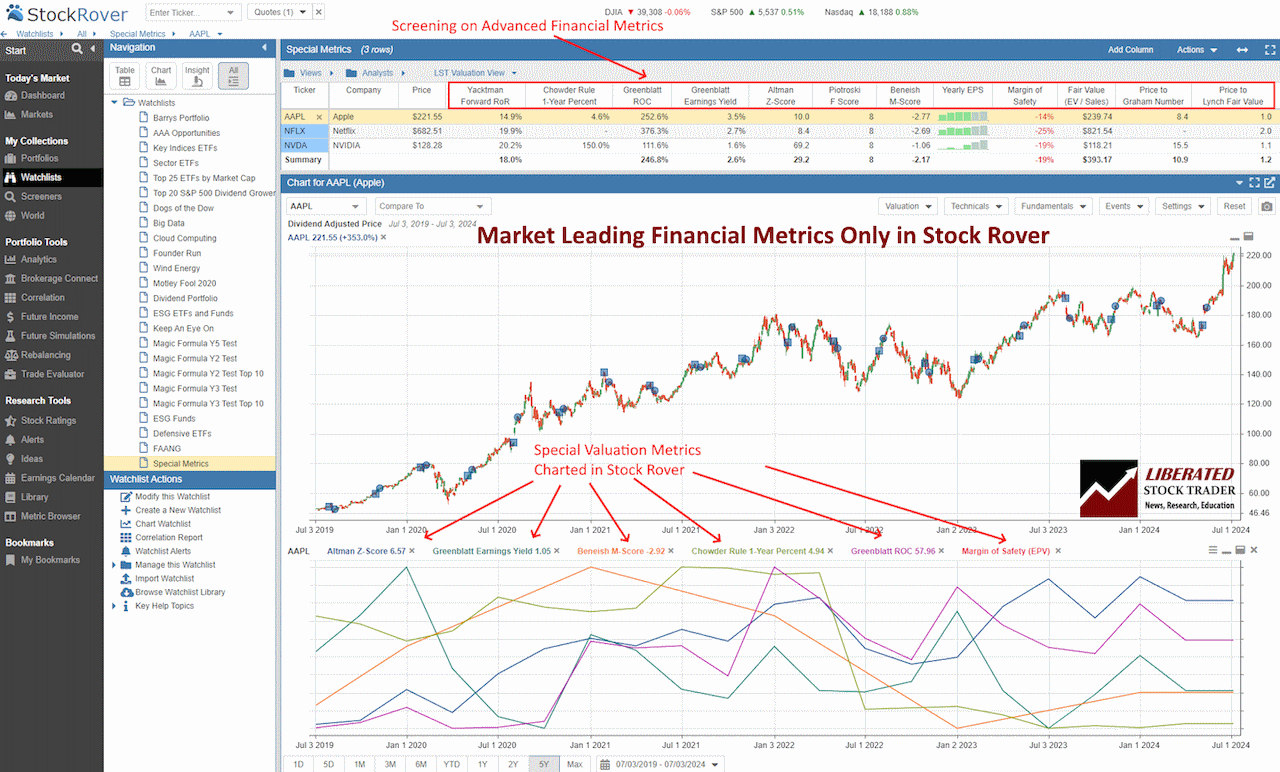
You do not need to calculate the Graham Number manually. Stock Rover provides advanced hybrid financial metrics, such as the Graham Number, Altman Z-Score, Piotroski F-Score, Beneish M-Score, Greenblatt Earnings Yield, Greenblatt ROC, Chowder Rule, Yacktman Forward Rate of Return and the Sharpe ratio.
The Stock Rover screenshot below shows the Price to Graham Number plotted over time.

Chart & Screen the Graham Number with Stock Rover
Example: Using the Graham Number in Investing.
Let’s compare two hypothetical companies, Company A and Company B, to see how the Graham Number can be used in practice.
Company A
- Earnings Per Share (EPS): $3.00
- Book Value Per Share (BVPS): $20.00
- Current Stock Price: $45.00
Company B
- Earnings Per Share (EPS): $2.50
- Book Value Per Share (BVPS): $18.00
- Current Stock Price: $30.00
Calculating the Graham Number
- Company A Graham Number: √{22.5 *3*20.00} = 36.74
- Company B Graham Number: √{22.5*2.50*18.00} = 31.81
Analysis
- Company A:
- Graham Number: $36.74
- Current Stock Price: $45.00
The current stock price of Company A ($45.00) is higher than its Graham Number ($36.74), suggesting that the stock may be overvalued according to this metric.
- Company B:
- Graham Number: $31.81
- Current Stock Price: $30.00
Company B’s current stock price ($30.00) is lower than its Graham Number ($31.81), indicating that the stock might be undervalued according to this metric.
Example Conclusion
Based on the Graham Number, Company B appears to be a better value investment than Company A. However, it’s important to remember that the Graham Number is just one tool among many. Investors should also consider other factors, such as market conditions, industry trends, and company-specific news, before making any investment decisions.
Limitations and Considerations
The Graham Number has several limitations. It relies on accurate and current financial data; any discrepancies can lead to incorrect valuations. It also assumes that high earnings and book values are solely indicators of a good investment, which isn’t always true. Other factors like market conditions, company management, and industry trends should also be considered.
Also, industries with high volatility might not be well-suited for this approach, as the formula may not account for rapid changes. Investors should view the Graham Number as one tool among many in their stock valuation toolkit.

Try Powerful Financial Analysis & Research with Stock Rover
Is the Graham Number Still Relevant Today?
The Graham Number remains a useful tool for value investors, but its relevance today can be seen as both limited and context-dependent. Here are some considerations for its relevance in contemporary investing:
Advantages of the Graham Number
- Simplicity: The Graham Number provides a straightforward method to estimate the intrinsic value of a stock using just two metrics: Earnings Per Share (EPS) and Book Value Per Share (BVPS).
- Historical Significance: The Graham Number is rooted in the principles of Benjamin Graham, who is a foundational figure in value investing. This historical significance adds weight to its use.
- Conservatism: The formula is designed to be conservative, which can help investors avoid overpaying for stocks and reduce downside risk.
Limitations of the Graham Number
- Modern Market Dynamics: The stock market has evolved significantly since Graham’s time. The rise of technology companies, intangible assets, and new financial instruments means that EPS and BVPS may not fully capture a company’s value.
- Sector-Specific Limitations: The Graham Number is less effective for evaluating companies in sectors with high intangible assets, such as technology and biotechnology, where book value might not reflect the true value of the company.
- Simplistic Approach: The formula does not account for other important factors like growth potential, competitive advantage, management quality, and macroeconomic conditions.
- Changing Accounting Standards: Accounting standards have changed over time, which can affect how EPS and BVPS are calculated, making historical comparisons less reliable.
Modern Adaptations
- Supplementary Analysis: Investors often use the Graham Number as a starting point and then supplement it with other valuation methods like Discounted Cash Flow (DCF) analysis, Price/Earnings to Growth (PEG) ratio, and qualitative assessments.
- Sector Adjustments: Adjusting the formula or using sector-specific metrics can make the Graham Number more applicable to modern companies.
- Technology and Tools: Modern financial tools and software can incorporate a broader range of metrics and provide a more comprehensive valuation.
Conclusion
While the Graham Number can still be a useful tool for identifying potentially undervalued stocks, it should not be used in isolation. Modern investors should consider it as one part of a broader toolkit that includes various quantitative and qualitative analyses. This balanced approach can help navigate the complexities of today’s financial markets more effectively.
Try TradingView, Our Recommended Tool for International Traders
Global Community, Charts, Screening, Analysis & Broker Integration

Global Financial Analysis for Free on TradingView
FAQ
What is the best software for screening and charting the Graham Number?
Stock Rover is the best software for screening and charting advanced financial metrics like the Graham Number. Our testing shows it offers the widest array of metrics and ratios available on the market today.
What is the formula for calculating the Graham number?
The formula is Graham Number = Square Root of (22.5 * Earnings per Share * Book Value per Share). This combines a company's earnings and book value to help determine its fair value.
How does the Graham Number compare to intrinsic value?
The Graham Number acts as a conservative estimate of a stock's fair value. Unlike intrinsic value, which may consider future growth and other factors, the Graham Number focuses on present financial metrics.
Is there a good screener available to identify the Graham Number?
Yes, Stock Rover provides a screener that can filter stocks based on their Price to Graham Number. It helps investors quickly identify undervalued companies.
Can you provide an example of how to apply the Graham number to a stock?
If a company has an Earnings Per Share (EPS) of $4 and a Book Value Per Share (BVPS) of $30, the Graham Number would be √(22.5*4*30) = 52.02. This suggests the stock is undervalued if its current market price is below $52.02.
Which stocks are considered the best when evaluated with the Graham number?
Companies with stable earnings and strong book values often perform well under Graham Number analysis. Stocks in mature industries like utilities or consumer goods are typically ideal candidates.
How accurate is the Graham number in modern stock analysis?
While the Graham Number is a solid starting point, it does not account for forward-looking factors such as market trends or future earnings potential. Therefore, the Margin of Safety and Intrinsic Value should be used with the Graham Number.
What are the limitations of using the Graham number as an investment screening tool?
The Graham Number relies on historical data and does not consider future growth or market trends. It is best used alongside other analysis methods. Additionally, changes in a company's earnings or book value can quickly affect the calculation's relevance.
My thorough testing awarded TradingView a stellar 4.8 stars!
With powerful stock chart analysis, pattern recognition, screening, backtesting, and a 20+ million user community, it’s a game-changer for traders.

Whether you're trading in the US or internationally, TradingView is my top pick for its unmatched features and ease of use.
Explore TradingView – Your Gateway to Smarter Trading!
