The Sharpe Ratio is a key metric used to measure the performance of an investment compared to a risk-free asset after adjusting for its risk.
The Sharpe Ratio provides insight into the return generated per unit of risk and is vital for both individual investors and financial professionals looking to optimize their portfolios.
A higher Sharpe Ratio indicates greater investment return for the risk undertaken, making it an attractive tool for comparing different investments.
According to recent studies, the Sharpe Ratio can reveal almost imperceptible performance differences between two investments. For this reason, it is commonly used in performance hypothesis testing.
Key Takeaways
- The Sharpe Ratio measures returns relative to risk.
- A higher Sharpe Ratio signifies better risk-adjusted return.
- It is useful for comparing different investments.
- The Sharpe Ratio can be used on a stock or across an entire portfolio.
The Sharpe Ratio efficient frontier shows the probability that an estimated ratio accurately represents the investment’s performance. It helps in identifying if the calculated measure is below a certain desired threshold, thus aiding in better decision-making processes for investors.

Using the Sharpe Ratio For Risk-adjusted Investment Returns
Understanding the Sharpe Ratio
The Sharpe Ratio is a vital tool for investors to evaluate the return on investment relative to its risk. This section breaks down the foundational concepts and the calculation method of the Sharpe Ratio.
The Sharpe Ratio, created by William F. Sharpe, helps investors understand an investment’s risk-adjusted performance. It’s crucial to compare different securities, such as stocks and bonds, by considering both return and volatility.
Investors use the Sharpe Ratio to determine whether an investment’s returns adequately compensate for the associated risk. A higher Sharpe Ratio indicates better risk-adjusted performance. Volatility is measured by the standard deviation of the investment’s returns. The ratio helps evaluate hedge funds, portfolios, and individual securities.
Calculation and Formula
To calculate the Sharpe Ratio, you need the investment return, risk-free rate, and the standard deviation of the investment returns. The formula is:
Sharpe Ratio = (Return of Investment - Risk-Free Rate) / Standard Deviation of Investment Returns.
Where:
- Return on Investment: Average return on the investment
- Risk-free rate (often a Treasury bill rate)
- Standard Deviation of Investment Returns is the volatility of the investment.
For example, let’s say an investment has an annual return of 15% and a risk-free rate of 3%. The standard deviation is calculated to be 10%. The Sharpe Ratio would be (0.15-0.03)/0.1 = 1.2.
Interpretation
As mentioned earlier, a higher Sharpe Ratio indicates better risk-adjusted performance. A ratio above 1 is considered good, while a ratio below 1 may not justify the level of risk taken on by the investor.
However, like any metric, it should not be used as the sole factor in making investment decisions. Other factors, such as the investment’s goals, risk tolerance, and portfolio diversification, must also be considered.
Furthermore, it’s essential to note that the Sharpe Ratio is not a predictor of future performance. It evaluates past returns and does not guarantee similar results in the future.
Excess return is the difference between the investment return and the risk-free rate. This formula summarizes how much additional return you receive for the extra volatility endured. Investors and analysts often use this metric to compare the performance of different investment funds and assets.
For example, if an investment portfolio has an annual return of 8%, a risk-free rate of 2%, and a standard deviation of 10%, the Sharpe Ratio is ((8 – 2) / 10 = 0.6). This indicates how well the returns compensate for the risk taken.
Usage in Portfolio Management
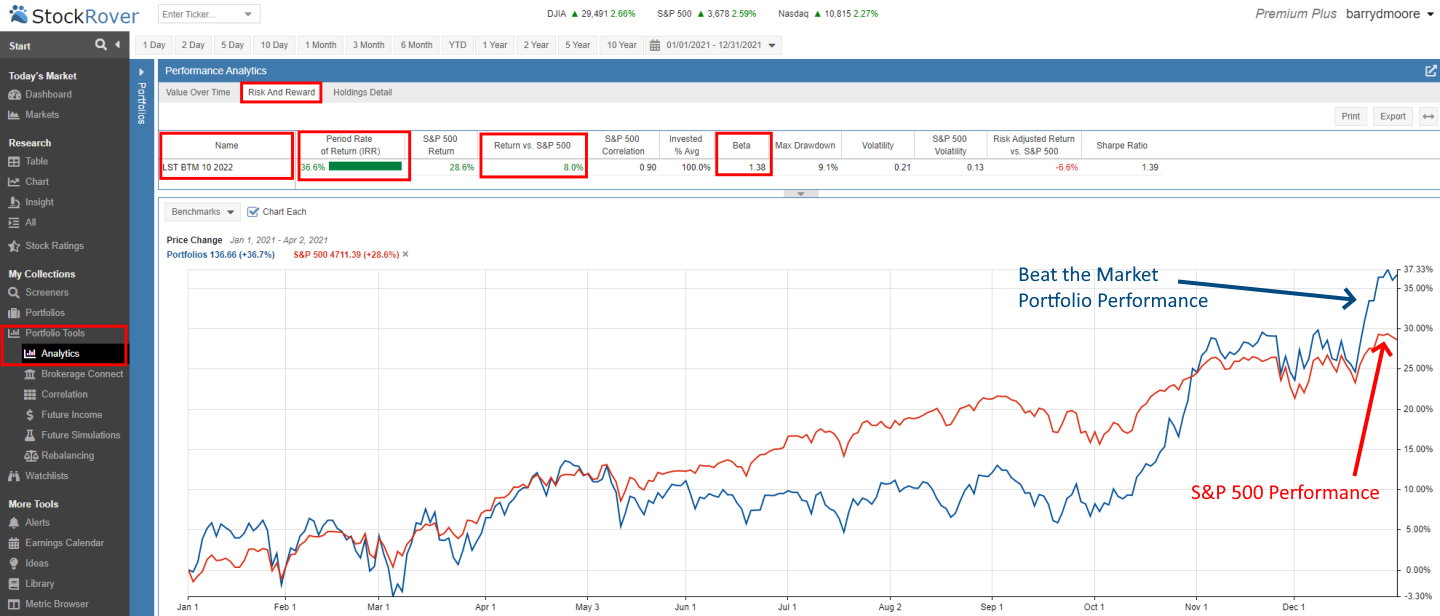
Using the Sharpe Ratio is key to good portfolio management. It helps investors evaluate a portfolio’s risk-return trade-off. Generally, higher Sharpe Ratios indicate a better risk-adjusted return.
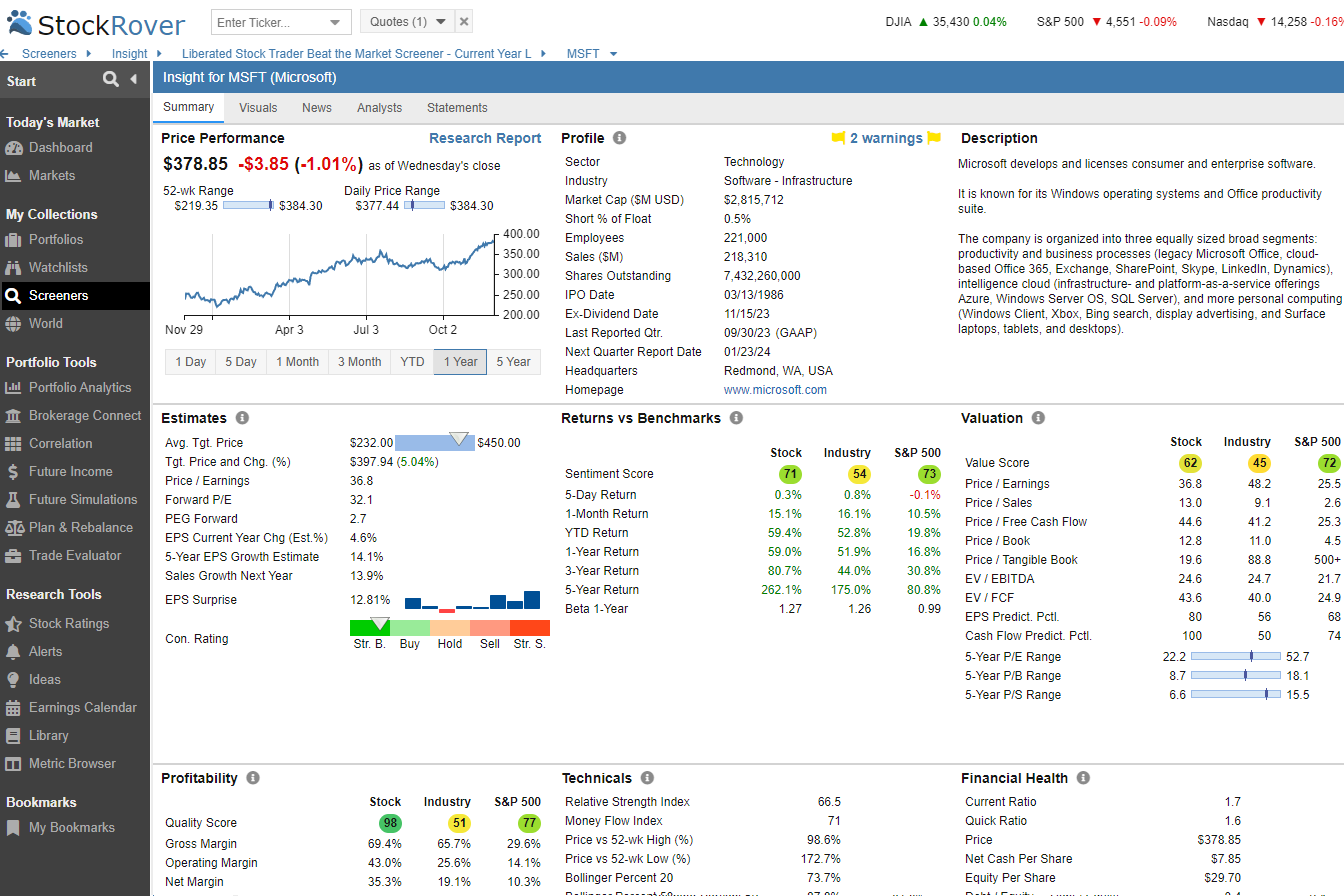
Stock Rover allows you to assess the Sharpe Ratio automatically for your entire portfolio. This allows you to compare the risk-adjusted performance of your investments and make informed decisions about adding or removing assets from your portfolio.
Additionally, Stock Rover provides historical Sharpe Ratio data for each asset in your portfolio, allowing you to track its performance over time and make adjustments as needed.
The Sharpe Ratio is also useful in comparing different investment strategies. For example, if an investor has two portfolios with similar returns but different levels of risk, the one with a higher Sharpe Ratio would be considered the better choice.
Get Sharpe Ratio Metrics in Stock Rover
Applying the Sharpe Ratio
Understanding how to apply the Sharpe Ratio can help investors make better decisions. It has key applications in portfolio management and comparing different investments.
Portfolio Management Insights
Portfolio managers use the Sharpe Ratio to assess an investment portfolio’s performance relative to its risk. A higher Sharpe Ratio indicates a better risk-adjusted return, which is important for asset allocation.
When managing a range of assets, financial analysts examine historical returns and compare them with potential future performance. This helps them select investments that might improve portfolio returns.
Example: If a manager has two funds, Fund A with a Sharpe Ratio of 1.2 and Fund B with 0.8, they may prefer Fund A. This suggests that Fund A has a better risk-return profile.
The measure also helps in understanding the correlation between different assets. If adding an asset increases the portfolio’s Sharpe Ratio, it’s considered a good addition. Negative Sharpe Ratios can signal problematic performance.
Comparing Investments and Performance
The Sharpe Ratio is valuable for comparing the performance of different investments. Financial research teams use it to compare asset returns.
For instance, two index funds can be compared based on their ratios. An index fund with a higher Sharpe Ratio is likely to provide better risk-adjusted returns. This is critical for investors seeking to maximize wealth while minimizing risk.
Transaction costs are another factor to consider. They can affect the Sharpe Ratio by impacting net returns. While higher ratios are preferable, it’s essential to look at the costs involved in trading assets.
Financial analysts also use the Sharpe Ratio alongside other metrics, like the information ratio, to get a comprehensive view of an investment’s performance. This holistic approach ensures thorough analysis, aiding in better decision-making.
Try Powerful Financial Analysis & Research with Stock Rover
Comparative Measures and Alternatives
Various alternative performance metrics exist that can complement or enhance the analysis provided by the Sharpe Ratio. These include the Sortino Ratio, which considers downside risk, and other performance metrics offering different insights into risk-adjusted returns.
Sortino Ratio and Adjusted Returns
The Sortino Ratio focuses on downside risk, providing a clearer picture of risk-adjusted returns by only considering negative volatility. This ratio is regarded as a more accurate measure for portfolios that do not follow a normal distribution, as it separates harmful volatility from the total volatility measured by the Sharpe Ratio.
Unlike the Sharpe Ratio, which penalizes upside and downside volatility equally, the Sortino Ratio considers downside deviation, aligning more closely with investors’ goals to avoid losses. It is calculated using the formula:
Sortino Ratio = (Expected Return - Risk-Free Rate) / Downside Deviation
By concentrating on negative performance, it offers a more realistic assessment for managers seeking to minimize losses. This measure can be particularly useful for comparing portfolios where downside risk is a critical factor.
Other Performance Metrics
Various other metrics complement the Sharpe Ratio, each with unique benefits and limitations. The Treynor Ratio is one such metric that considers systematic risk by adjusting returns based on the portfolio’s beta. It offers insights into how a portfolio performs relative to the market.
Another useful metric is the Omega Ratio, which evaluates the probability-weighted ratio of gains over losses. This can be particularly insightful for asset classes with skewed return distributions, unlike the normally distributed returns assumption required for the Sharpe Ratio.
The Capital Asset Pricing Model (CAPM) and Treynor Ratios incorporate market benchmarks and diversification benefits. The CAPM, for instance, adjusts performance relative to market risk, making it essential for understanding market-relative performance.
Lastly, measures such as the t-statistic and ex-post analysis help in performance appraisal over different frequencies, providing insights into both historical (ex-post) and expected (ex-ante) performance. These tools are invaluable for comprehensive portfolio management and making informed investment decisions.
Investing In Stocks Can Be Complicated, Stock Rover Makes It Easy.
Stock Rover is our #1 rated stock investing tool for:
★ Growth Investing - With industry Leading Research Reports ★
★ Value Investing - Find Value Stocks Using Warren Buffett's Strategies ★
★ Income Investing - Harvest Safe Regular Dividends from Stocks ★

"I have been researching and investing in stocks for 20 years! I now manage all my stock investments using Stock Rover." Barry D. Moore - Founder: LiberatedStockTrader.com
Constraints and Considerations
When using the Sharpe ratio, several constraints and considerations arise.
First, the presence of a risk-free asset is vital. This asset helps to compare the excess returns from the portfolio with the returns from a risk-free investment.
Leverage is another factor. Utilizing leverage can significantly alter the Sharpe ratio by increasing both risk and potential return.
Mutual funds often have restrictions on short-selling and leverage, which can impact their ability to optimize for the highest Sharpe ratio.
Financial analysts must consider downside risk when evaluating portfolios. The Sharpe ratio does not differentiate between upside and downside volatility, which can be a limitation in risk assessment.
The information ratio is a related metric that also needs consideration. While the Sharpe ratio compares returns to a risk-free rate, the information ratio compares returns to a benchmark index.
Risk-adjusted returns are central to portfolio management. The Sharpe ratio helps in understanding these returns by adjusting for the total risk taken.
Another aspect is correlation. A low or negative correlation between assets in a portfolio can improve the Sharpe ratio by reducing overall portfolio risk.
Financial analysts widely use risk-adjusted performance measures, like the Sharpe ratio, to allocate assets. These measures help create a balanced investment portfolio.
Lastly, it’s important to recognize the independence of returns over time and how subscriptions to mutual funds can affect asset allocation strategies.
Understanding these factors ensures a more nuanced approach to achieving optimal portfolios and enhances overall investment strategies.
FAQ
How is the Sharpe Ratio calculated?
The Sharpe Ratio is calculated by taking the difference between an investment's return and the risk-free rate and dividing that by the standard deviation of the investment's excess return. This formula helps us understand how much excess return is earned per unit of risk.
What is the best software for charting and analyzing the Sharpe Ratio?
Stock Rover is the best software for screening and charting advanced financial metrics like the Sharpe Ratio. Our testing shows it offers the widest array of metrics and ratios available on the market today.
What does a Sharpe Ratio indicate about an investment's performance?
A higher Sharpe Ratio indicates that an investment has a better risk-adjusted return. It shows that the investment is providing more return for each unit of risk taken. Conversely, a lower ratio suggests that the returns are not compensating for the risks involved.
Is there a good screener available to identify the Sharpe Ratio?
Yes, Stock Rover provides a screener that can filter stocks based on their YSharpe Ratio. It helps investors quickly identify undervalued companies.
How can one interpret a negative Sharpe Ratio?
A negative Sharpe Ratio means that the risk-free rate is higher than the investment's return. This usually indicates that the investment underperformed compared to a risk-free asset like Treasury bills. Investors should be cautious, as the investment did not provide sufficient returns to justify its risk.
In practical terms, what constitutes a 'good' Sharpe Ratio value?
A Sharpe Ratio above 1 is generally considered good, indicating that the investment provides a decent return for its risk. Ratios above 2 are considered very good, and values above 3 are considered excellent. These benchmarks help investors compare different investments' risk-adjusted returns.
What are the implications of a Sharpe Ratio that is less than one?
If an investment has a Sharpe Ratio of less than 1, it means the return doesn't adequately compensate for the risk. Such investments may not be favorable for risk-averse investors. They should seek higher ratios to ensure better risk-adjusted performance.
How does the Sharpe Ratio of the S&P 500 benchmark index typically compare to other investments?
The S&P 500 typically has a Sharpe Ratio that is used as a benchmark. Historically, its ratio ranges around 0.5 to 1.0. Individual stocks or investments with ratios significantly higher than this benchmark may be considered better-performing in terms of risk-adjusted returns.
My thorough testing awarded TradingView a stellar 4.8 stars!
With powerful stock chart analysis, pattern recognition, screening, backtesting, and a 20+ million user community, it’s a game-changer for traders.

Whether you're trading in the US or internationally, TradingView is my top pick for its unmatched features and ease of use.
Explore TradingView – Your Gateway to Smarter Trading!