Effective use of chart indicators is key to a profitable trading strategy. Not all indicators are profitable, and there are key methods to use to deploy them in a trading system.
Professional market analysts build effective trading strategies using techniques such as indicator divergences, multi-time frame analysis, indicator combinations, and rigorous backtesting.
As a certified market analyst, my 12 proven insights for using trading indicators like a professional will take your trading to a new level.
1. Understand How Indicators Are Calculated
Each chart indicator has a specific calculation designed to achieve a goal or provide insight into market supply and demand.
For example, to trade using the Relative Strength Index (RSI) indicator, traders will look for buy and sell signals based on the value of the RSI oscillator. When the RSI exceeds 70, it indicates an overbought market, meaning price increases may slow down and reverse. The typical trigger for selling an asset is the RSI line crossing down through the 70 mark.
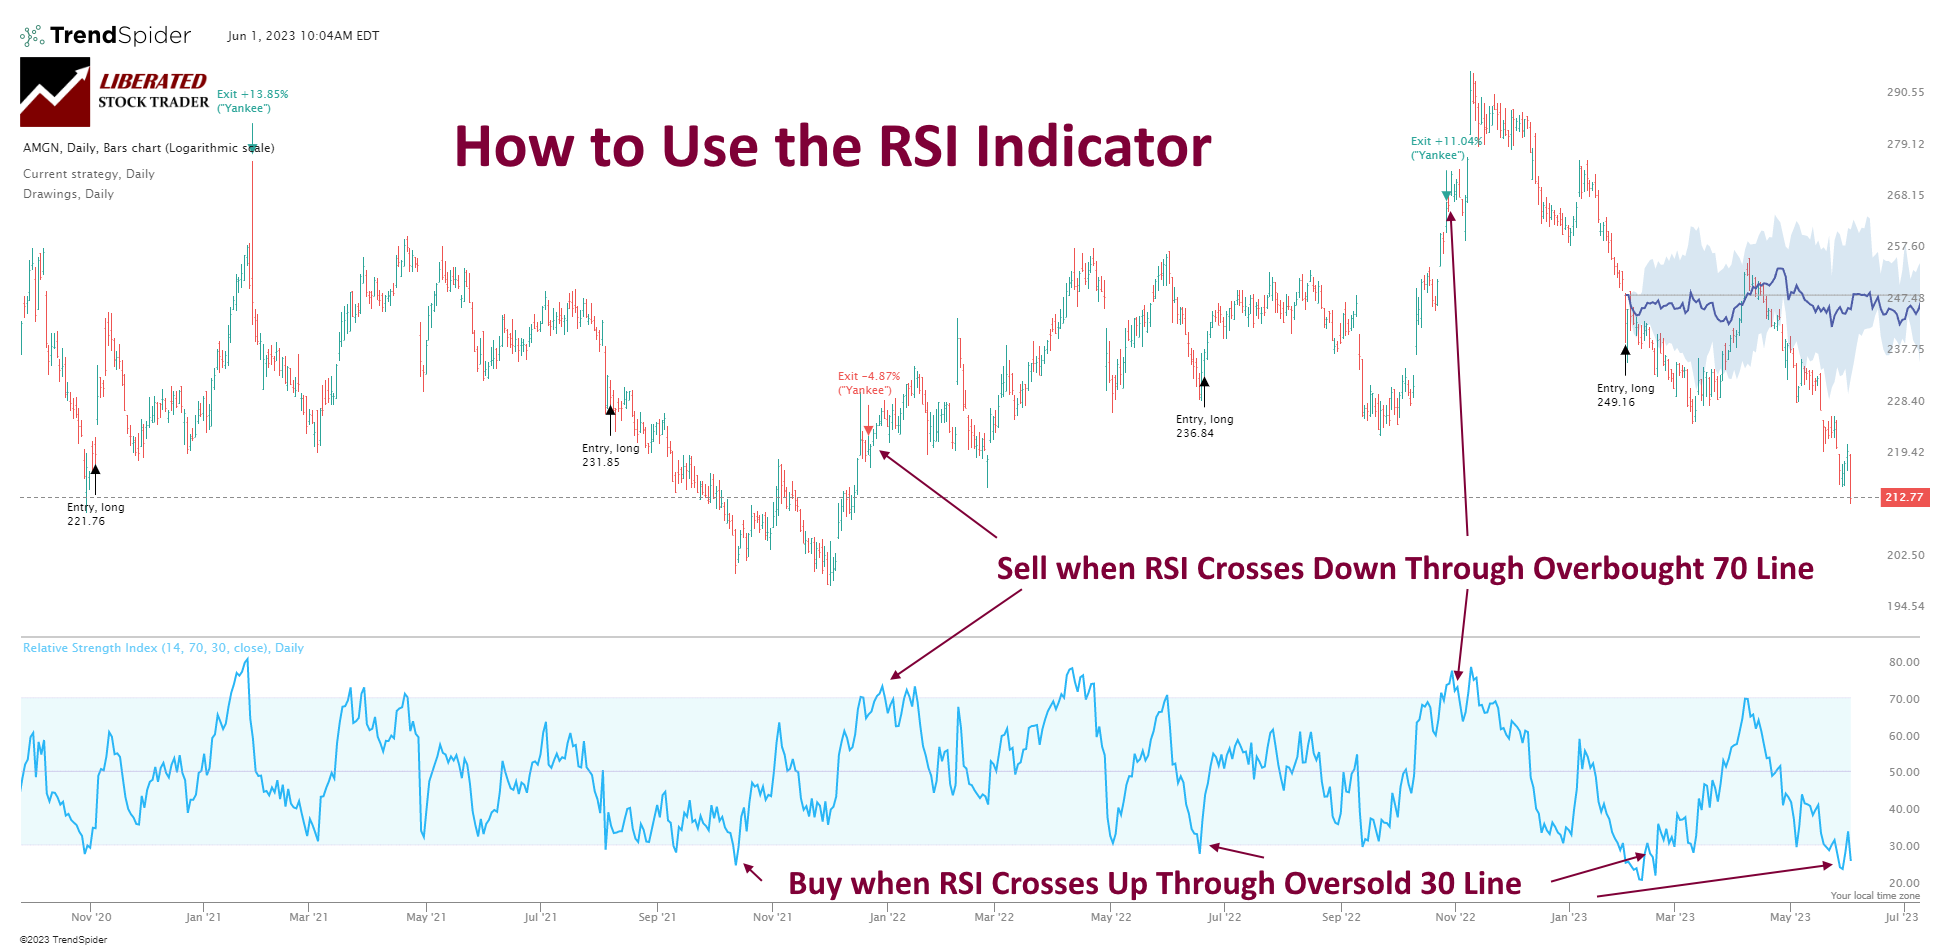
Chart Produced With TrendSpider
Understanding how an indicator is calculated and what it means helps you identify potential trading signals. Some indicators are price only, such as MACD; some use price and volume in the calculations, like Money Flow or OBV. Understanding this difference is key.
2. Use Indicators to Spot Divergences
A trading indicator divergence occurs when an oscillating indicator moves in the opposite direction to the price, e.g., diverges.
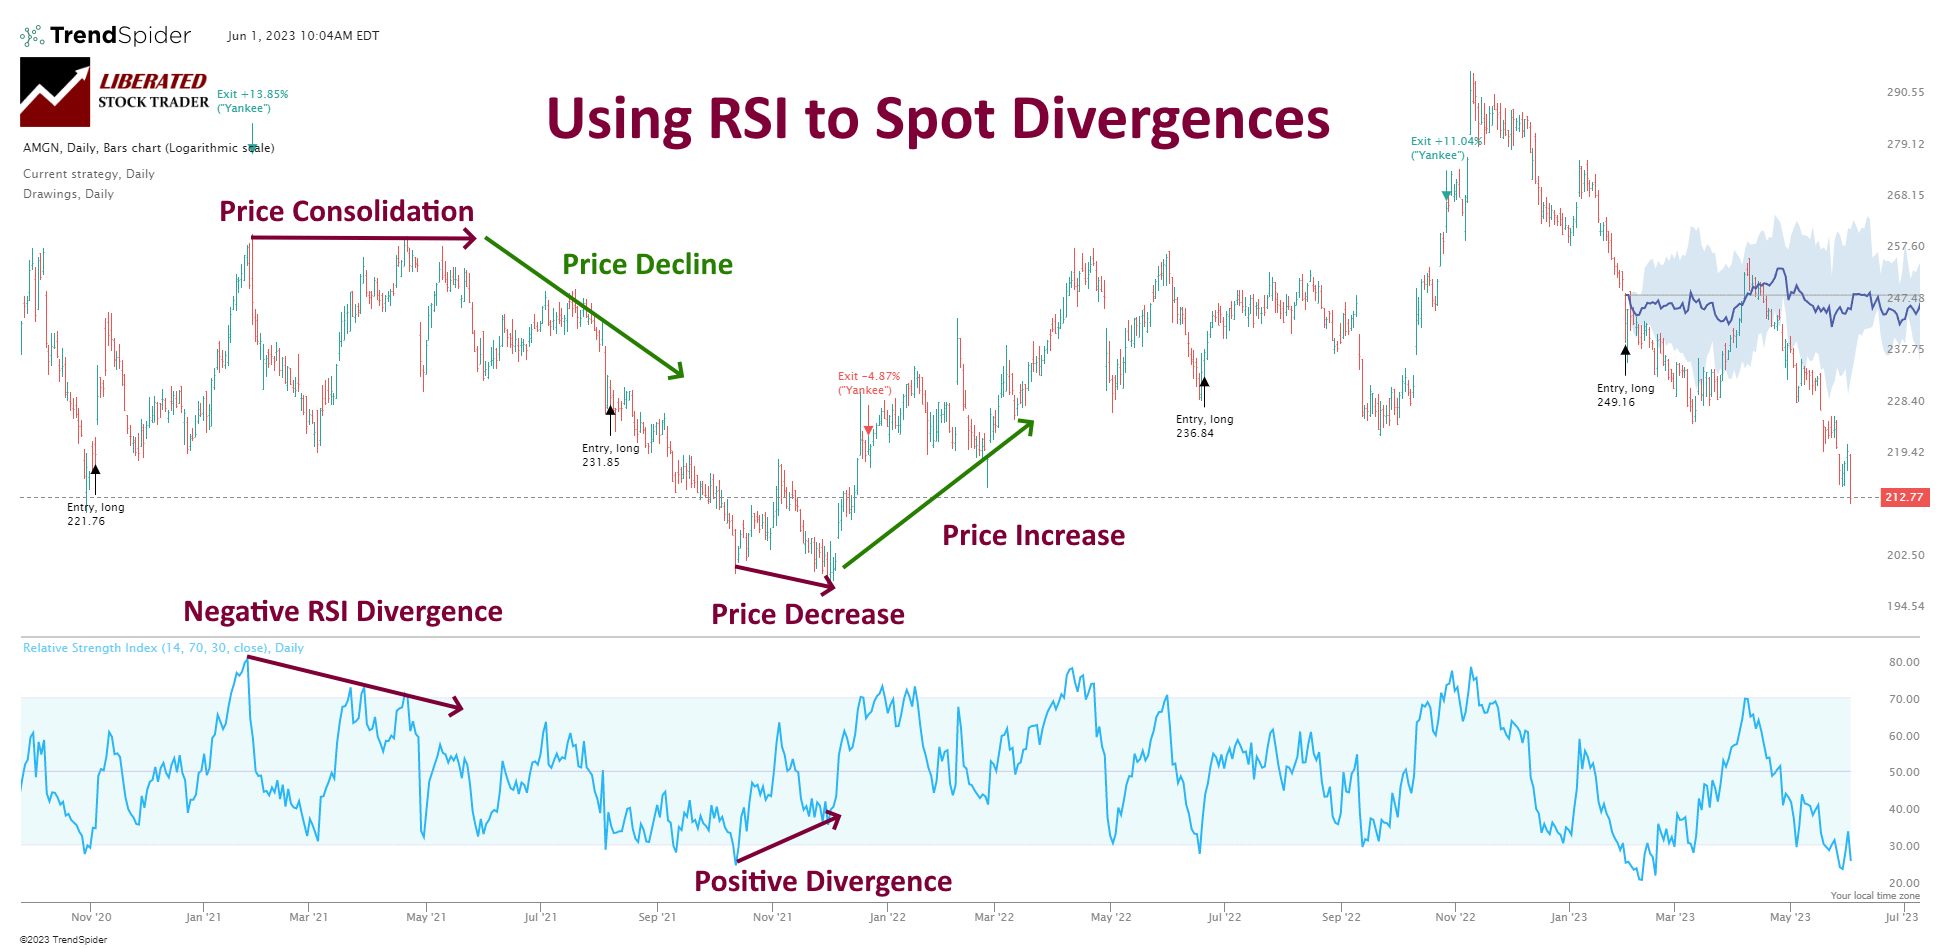
For example, let’s look for divergences between price and RSI. When the price makes a lower low, but the RSI doesn’t, this is called a bullish divergence. Conversely, with a bearish divergence, the price makes a higher high, but the RSI doesn’t.
Get Professional AI Charting With TrendSpider
These divergences indicate that the price and RSI are moving in different directions, which could indicate an upcoming reversal. The chart below illustrates a bullish divergence, with prices making lower lows and RSI making higher lows. This indicates the potential for the trend to reverse upward.
If you see a divergence, watch the market closely for potential trading opportunities. Confirmation of a reversal is best achieved by waiting for the price or RSI to break a support/resistance line and enter the new trend. If you get too eager and jump in before confirmation, you could find yourself on the wrong side of any upcoming price movement.
3. Backtest the Indicators
Many trading indicators are unprofitable. I have tested the efficacy of many indicators, and only a handful are reliable and accurate. Some indicators work on shorter timeframes, and others only on longer ones. Some indicators are unprofitable on all timeframes.
How do you know which trading indicators to use in your system? Enter backtesting.
Backtesting involves running a trading strategy through historical market data to gauge its accuracy and profitability. By simulating past trades, you can identify potential problems with your trading plan or see its profitability before risking real money in the live markets.
With backtesting, you can measure how well an indicator works with other indicators or trading strategies.
My thorough testing awarded TradingView a stellar 4.8 stars!
With powerful stock chart analysis, pattern recognition, screening, backtesting, and a 20+ million user community, it’s a game-changer for traders.

Whether you're trading in the US or internationally, TradingView is my top pick for its unmatched features and ease of use.
Explore TradingView – Your Gateway to Smarter Trading!
Example: Backtesting Trading Indicators
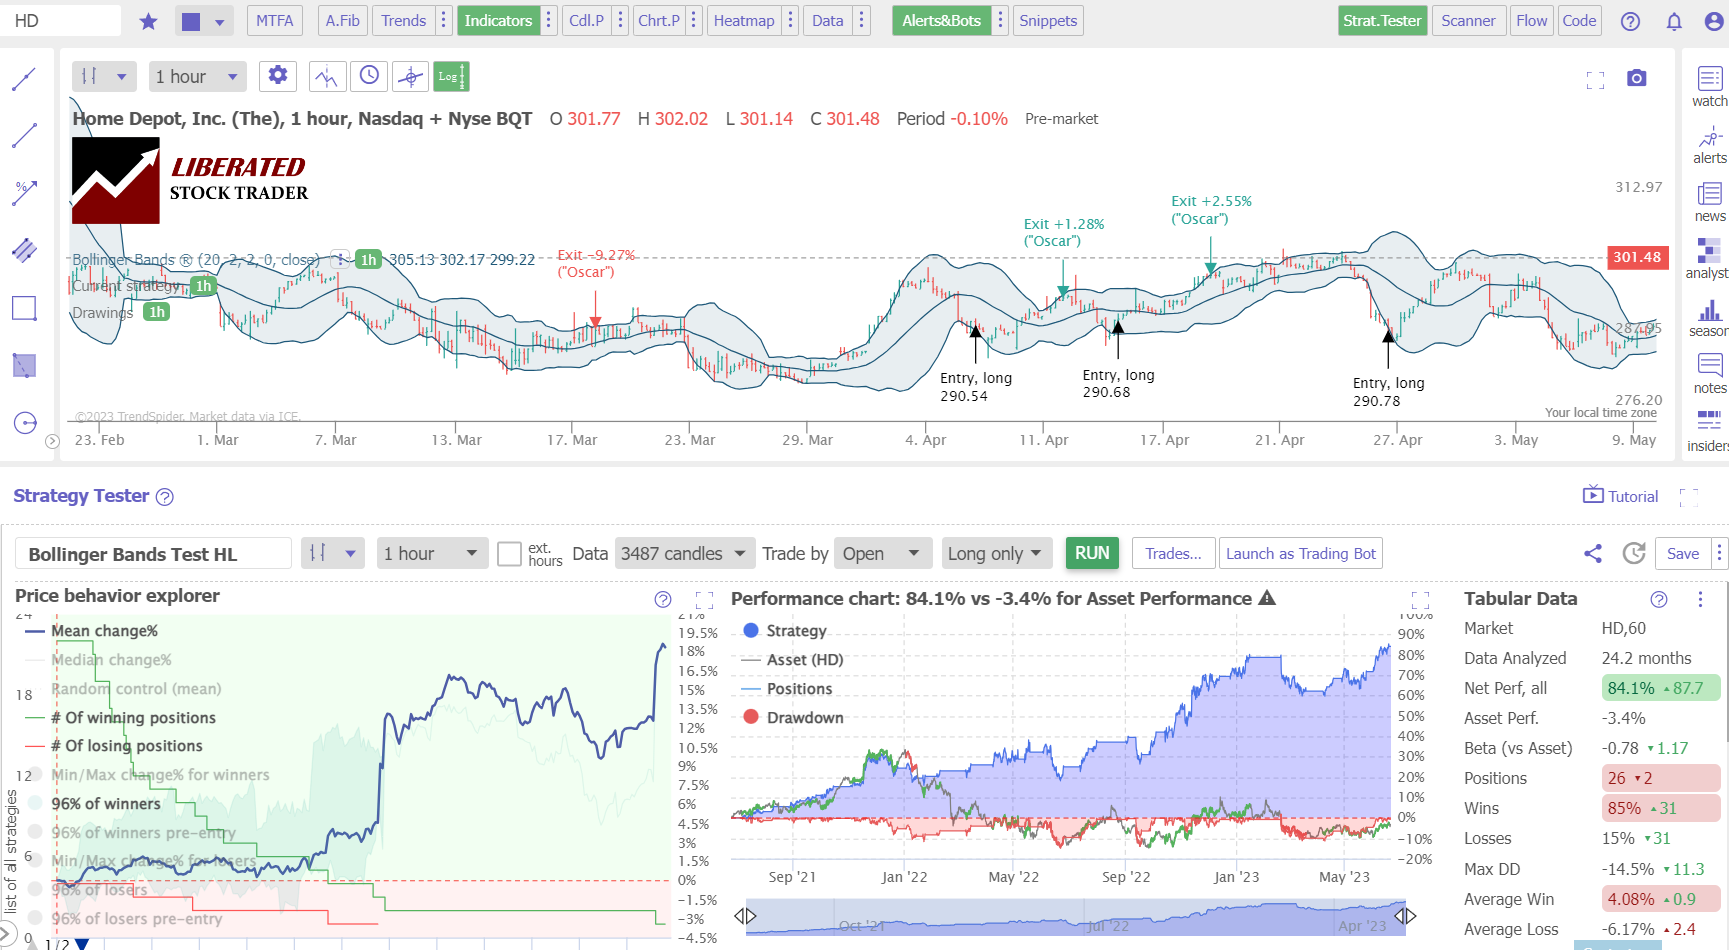
My testing of Home Depot (Ticker: HD) on a 1-hour chart over two years shows a Bollinger Bands strategy returning a profit of +84.1% versus the buy-and-hold return of -3.4%. There were 26 trades with an 85% Win Rate and an average win of 4.08% versus a loss of -6.17%.
An indicator that enables 85% of trades to be winners is rare, which made Bollinger Bands profitable on this stock. However, 53% of the Dow Jones 30 returned a loss using this strategy.
I Backtest Powerful Strategies on TrendSpider
4. Combine Trading Indicators
Expert analysts usually combine multiple indicators to help tell a complete picture of supply and demand. Ideally, combining a price/volume indicator with a price indicator would be best, mixing momentum and volume.
This will give you a good oversight of supply and demand.
For example, traders may want to combine the Aroon indicator with the Moving Average Convergence Divergence (MACD) indicator. Or combine the Commodity Channel Index with the Money Flow Index (MFI), a momentum oscillator.
Using multiple indicators can help provide traders with more information and a better chance of success in trading different stocks.
Never use one indicator alone; use multiple indicators. They should mostly confirm each other, meaning they move in the same direction. Use them as a suite of self-checks before making a decision.
5. Know Which Trading Indicators Are Profitable
This groundbreaking research, based on my extensive analysis of over 10,400 years of exchange data, unveils the most effective indicators for day trading.
These include the Price Rate of Change, VWAP, Weighted Moving Average, Hull Moving Average, Simple Moving Average, and Relative Strength Index.
Video: The Best Trading Indicators
Find Out More: The Most Reliable Trading Indicators Backed By Data.
11 Accurate Day Trading Indicators Tested & Proven with Data
6. Use the Best Software for Charting & Indicators
If you want to develop unique strategies and even your own trading indicators, TradingView is an excellent choice. TradingView has the broadest selection of trading indicators of any software provider, plus many exotic and unique chart types. I use TradingView daily with 10 million other traders; follow me on TradingView here.
7. Use Multi-Timeframe Analysis for Indicators
It is important to view charts and indicators on multiple timeframes, from 5-minute charts to weekly. Why?
Indicators and charts tell you different things when viewed through different time frames. An asset or stock could simultaneously be in a long-term uptrend and a short-term downtrend, making stock trend analysis confusing.
Luckily, TrendSpider, which I mentioned earlier as the best software for backtesting and trading, also has a hidden trick. It performs multi-timeframe analysis and plots trendlines from different time dimensions on the same chart. It’s like voodoo magic. Well, actually, it is intelligent AI algorithms.
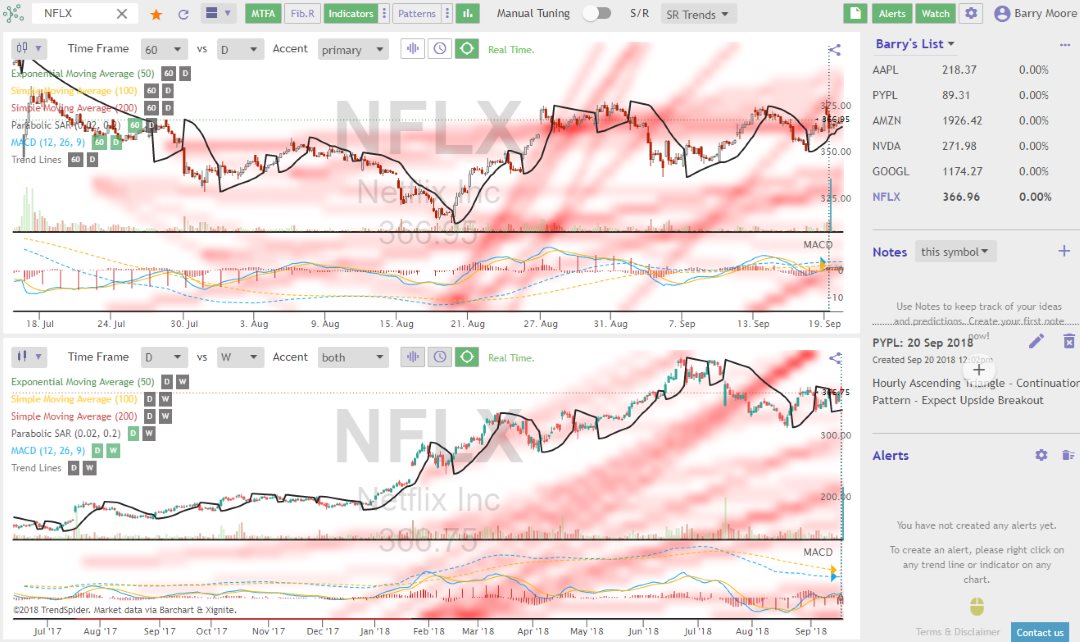
I Create Winning Strategies on TrendSpider
- Related Article: Automated Multi-Timeframe Analysis with TrendSpider
8. Use the Right Timescales
It would be best to tune the timescales or parameters on the indicators to reflect the timescale you want to invest in. For example, if you are a longer-term investor, you must plot the indicators on weekly timescales. If you’re a swing trader, look at the daily chart and combine those timescales.
Timeframes for investors
If you are buying a stock for the long term (2-10 years), use longer-term time frames and daily or weekly charts, and base your decisions primarily on fundamentals, long-term trends, and chart indicators.
Timeframes for swing traders
If you are swing trading in a short to medium timeframe, use hourly or daily charts over a 6-month to 2-year timeframe.
Timeframes for day traders
If you are day trading, you should use day trading indicators tuned to 1-minute or 5-minute timeframes.
11 Accurate Day Trading Indicators Tested & Proven with Data
9. Remember Price is the Most Important Indicator
Price should remain your most important indicator regardless of your timeframe or indicators. Price will always tell you the truth about what is happening in the market and any other indicators you use to confirm or deny that price action. Make sure to focus primarily on price when making decisions; it should be your primary consideration no matter what time frames and indicators you choose.
10. Test Your Indicators Across Bull & Bear Markets
It is important to test your indicators across different market conditions. You should try using them in both bull and bear markets to see how accurate they are in each environment. This will help you identify weaknesses or strengths and adjust accordingly when trading.
Example: Bull & Bear Market Indicator Backtest
You will need software that can backtest the entire history of a stock or index. Again, TrendSpider can backtest huge amounts of data. Here is an example of a 20-year backtest of the Ichimoku Cloud indicator on the S&P 500.
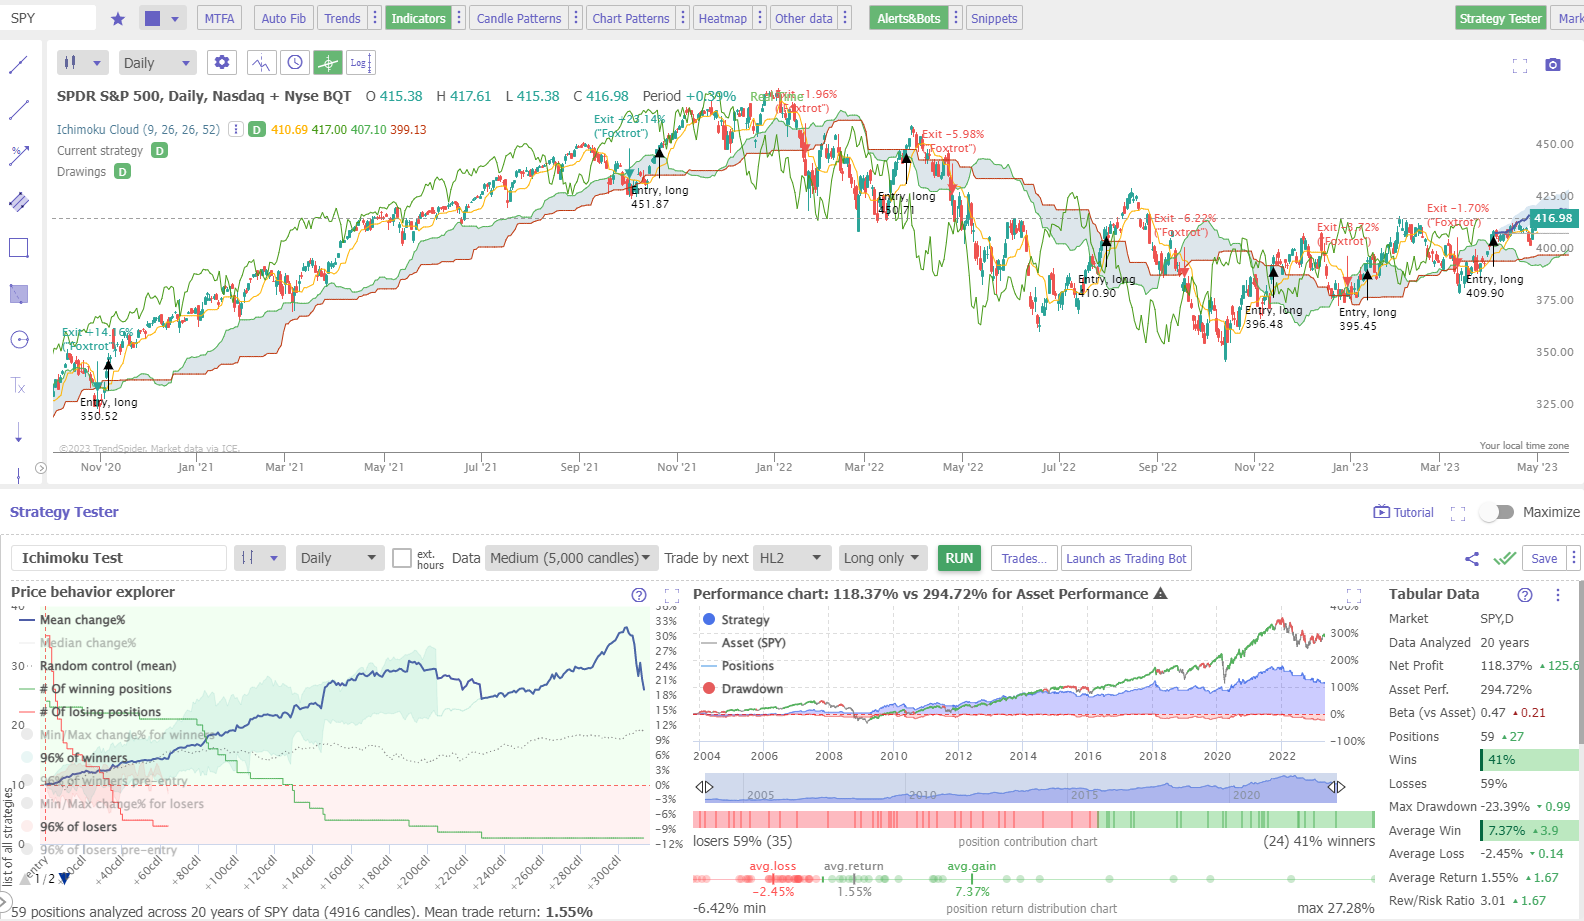
Long Term Backtesting with TrendSpider
Additionally, you may find that certain indicators work better in one market than the other, so it pays to be prepared for both types of market conditions.
Once you determine the timeframes and indicators that work best for you, set up a trading system and test it on historical data to ensure it produces positive results. If the results are not what you expect, you may need to adjust your strategy or settings.
11. Don’t Overlook the Fundamentals
Finally, remember to consider fundamental analysis when trading. A company’s fundamentals can tell you much about its prospects and potential stock price movements. Consider using financial statements and news releases to help inform your investment decisions. By analyzing these factors, you can better understand the company and its stock price movements.
12. Practice Proper Risk Management
No amount of testing and learning can guarantee an indicator is 100% successful. According to my extensive testing, a 70% accurate indicator is a wonderful result. This is when risk management is critically important.
Developing a profitable system is only half the battle; managing risk properly to ensure your capital remains safe is just as important.
You are wiped out if you are successful in 70% of your trades but lose all of your capital on the other 30%.
Therefore, it is essential to manage your risk properly. This means only trading with money you can afford to lose, using stop losses and appropriate position sizing, and investing a maximum of 5% of your capital on any single trade.
Final Thoughts
Finally, always remember that trading is a marathon – not a sprint. Building up experience and expertise to become a successful trader takes time and patience. Focus on honing your skills while developing essential psychological traits such as discipline, mental toughness, and risk management.
FAQ
What software is best for trading indicators?
The best software for a broad range of trading indicators is TradingView. It offers a wide range of technical analysis indicators, chart drawing tools, and real-time streaming of stock prices. Its intuitive user interface is also easy to use, even for novice traders.
What are Trading Indicators?
Trading indicators are mathematical calculations that traders use to forecast future price levels or the market's overall direction. They objectively measure different market conditions, supply and demand, and help formulate a strategy to profit from them.
What is the Purpose of Trading Indicators?
Trading indicators serve as valuable tools for traders, aiding them in recognizing trends and patterns within price movements. By leveraging these patterns, traders gain the ability to anticipate future price changes, empowering them to make well-informed decisions during securities transactions.
What software is best for backtesting trading indicators?
Backtesting trading indicators is best done with TrendSpider. It offers a comprehensive suite of technical analysis indicators and charting tools that enable traders to analyze past market data and simulate real-time trading scenarios.
How Many Types of Trading Indicators Exist?
There are four types of trading indicators: leading, lagging, price, and price/volume. Leading indicators anticipate future price movements, while lagging indicators confirm patterns or trends once they have started. Price indicators use only price in the calculations, whereas price/volume indicators use trading volume.
Can Trading Indicators Guarantee Profit?
No, trading indicators cannot guarantee profits. The best indicators are 70% accurate and reliable; at worst, they can cause you to lose money. Combining them with other aspects of technical analysis and risk management strategies is crucial.
How Do I Choose the Right Trading Indicator?
Choosing the right trading indicator depends on your trading style, risk tolerance, and the specific goals of your trading strategy. It's recommended to rigorously backtest different indicators and combinations to determine which ones work best for your circumstances.
Are Trading Indicators Useful for All Types of Trading?
Yes, trading indicators can be useful for all types of trading, including day trading, swing trading, and long-term investing. However, the effectiveness of a particular indicator may vary depending on the trading timeframe and the market's volatility.
