In this lesson, we discover the best stock market to invest in, look at stock market performance, and analyze some market statistics.
What are the best stock markets to invest in?
The North American, Australian, and European stock markets are the best to invest in regarding regulation and choice. With vast numbers of companies floated on these exchanges, you can always find companies that meet your investing criteria.
Regarding high-end growth, India’s Sensex has been one of the highest-performing stock markets since the financial crisis in 2008.

Do the global stock markets move in sync?
Do the global stock markets move in a synchronized manner with each other, and if so, why?
View this chart on TradingView
Do the global stock markets move in sync?
Do the global stock markets move in a synchronized manner with each other, and if so, why?
You can plot the chart to show a similar starting point: the bottom of the global financial crisis in 2008. This is a good starting point, as nearly all indexes crashed simultaneously. Also, as the comparison chart above does not show values but percentage change, March 2009 is the perfect point.
What do the global markets have in common?
Upon initially viewing the chart, you can see several important similarities.
- In general, they move in the same direction.
- Although a particular day may have a positive result for the Sensex and a negative result for the FTSE, we see that major fluctuations occur in a synchronized way. Perhaps this is because global news of serious macroeconomic significance ripples through the markets as they open for trading, causing the “Big Money” to make market corrections.
- There are key pivot points in the global economy where all markets will change direction simultaneously. For example, in March 2009 (direction up), June 2009 (direction down), July 2009 (direction up), Feb 2020 (direction down), and so on.
Performance is the difference in global markets.
We can plot some of the key global market reversals on the chart, as previously discussed. But it is also important to note that although the markets are roughly synchronized, the momentum that some indexes carry into the trend is much stronger than others. For example, the Sensex (India) exploded upwards in March 2009 for an 80% increase in just four months, leaving other indexes behind. Very dynamic!
Financial Market Statistics
The total world stock market capitalization is $116.78 trillion.
The total value of the world’s stock markets at the start of 2023 is $116.78 trillion. The world’s stock markets have grown 464% in 11 years, up from $25 trillion in 2009.
Source: Statista & LiberatedStockTrader
The US stock markets are 46% of the global market value.
The US NYSE & NASDAQ stock exchanges are 54% of the global stock market value, with a market capitalization of $41 Trillion.
Source: Visual Capitalist & LiberatedStockTrader
The US Stock Market is worth more than the next seven stock exchanges combined.
The USA is the most valuable and powerful place to trade stocks. The NYSE & NASDAQ combined is worth more than the next seven stock exchanges combined: Japan, China, Euronext, London, Hong Kong & Saudi & Canada.
Source: LiberatedStockTrader
The NYSE & NASDAQ dominate the world’s stock markets.
The two goliaths in the global stock markets are the New York Stock Exchange and the NASDAQ; they host most of the world’s largest companies and the largest technology giants like Microsoft, Apple, Google, Tesla, and Facebook.
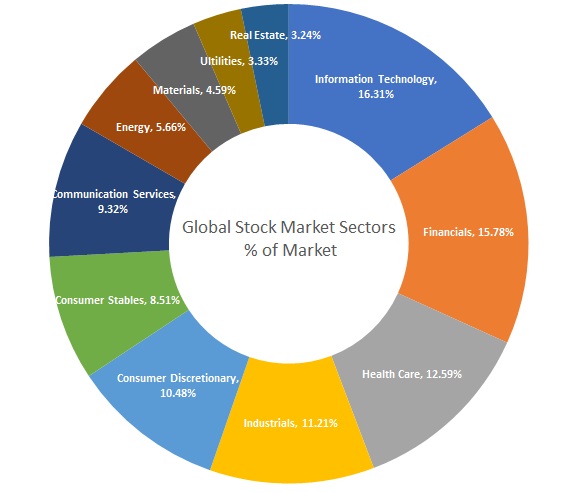
Information Technology, Financials, Communication, and Healthcare make up over 52% of the world’s companies by value.
Information Technology companies dominate all other industries at 16.31% 1 Real Estate accounts for a surprisingly low 3.24% of the global stock market (as weighted by MSCI)

| Stock Market Sector Statistics | % of the market |
| Information Technology | 16.31% |
| Financials | 15.78% |
| Health Care | 12.59% |
| Industrials | 11.21% |
| Consumer Discretionary | 10.48% |
| Consumer Stables | 8.51% |
| Communication Services | 9.32% |
| Energy | 5.66% |
| Materials | 4.59% |
| Utilities | 3.33% |
| Real Estate | 3.24% |
The fastest-growing stock sectors are Energy, Healthcare, and Technology in 2023
2023 is the year of Energy, Healthcare, and Tech Stocks. The energy sector usually lags way behind, but there is now a huge push into clean energy stocks; solar and electric power are fueling the rise, while oil companies are dropping.
Source: LiberatedStockTrader & TradingView Data
Investing Statistics
The Nasdaq 100 has returned 907% over 20 years to 2022, the India Sensex exchange grew by 1792%, while the UK FTSE only increased by 46%.
A NASDAQ 100 Index Tracking ETF would have made you 907% in 20 years.
Many say the stock market is too risky, and individual stock ownership is even riskier. Owning an index fund on a major world index, especially in the USA, is proven to yield a good profit over the long term.
- In the last 20 years, from 2002 to 2022, the best-performing major stock market index has been the NASDAQ 100, with a meteoric return of 907%.
- The next best is the Nasdaq Composite with 665%, the S&P500 with 307%, and the German DAX with 216%.
- The UK FTSE has managed a meager 46.48% growth over the last 20 years, and the Nikkei 225 has a 172% return.
- The best-performing index in the world for 20 years to 2022 is the Indian Sensex, with a 1792% increase.
Source: LiberatedStockTrader & TradingView Data
You have a 1 in 3 chance of selecting a stock that beats the market, and the US stock market goes up 55% of trading days.
You have a 32% chance of selecting a stock that will beat the S&P500
According to my research, out of 4,000 US major stocks, only 1,299 companies beat the S&P 500 index from January 2021 to January 2022. The average increase of these stocks was 38.4%. This means you have a 32% chance of selecting a stock that will beat the market.
Source: LiberatedStockTrader, StockRover, TradingView Data
The S&P 500 goes up 55% of trading days and down 45% of the time.
My research shows that the S&P 500 increased 55% of the time over the last ten years by an average of 0.2% per day, and the longest uninterrupted uptrend was eight days.
Source: LiberatedStockTrader Pro
