The Altman Z-Score is a crucial financial tool used to predict the likelihood of a company going bankrupt.
It combines 5 important metrics into a single score to gauge a company’s financial health.
Advanced long-term investors use the Altman Z-Score to determine whether a business is at risk of insolvency, reducing their investment risk.
The Altman Z-Score is derived using a combination of profitability, leverage, liquidity, solvency, and activity ratios. This makes it a comprehensive assessment tool that remains relevant in corporate fraud detection and investing risk reduction.
Key Takeaways
- Altman Z-Score predicts the likelihood of bankruptcy.
- It combines five crucial financial ratios into one score.
- Serious long-term investors use the Altman-Z score to ensure the financial health of any investment.

Knowing how to use the Altman Z-Score is essential for anyone involved in financial analysis or investment. It helps identify potential risks and make strategic decisions to safeguard investments.
Understanding the Altman Z-Score
The Altman Z-Score is a financial model designed to predict the likelihood of bankruptcy. Developed by Edward Altman in 1968, it’s widely used to assess the financial health of companies, particularly in the manufacturing sector. At the time, bankruptcy prediction was difficult, with few reliable tools available. Altman aimed to create a formula that could accurately predict a company’s financial distress.
He combined these ratios into a single formula known as the Z-Score. His initial focus was on manufacturing companies, but the model has since been adapted for use in non-manufacturing sectors.
Charting the Altman-Z Score
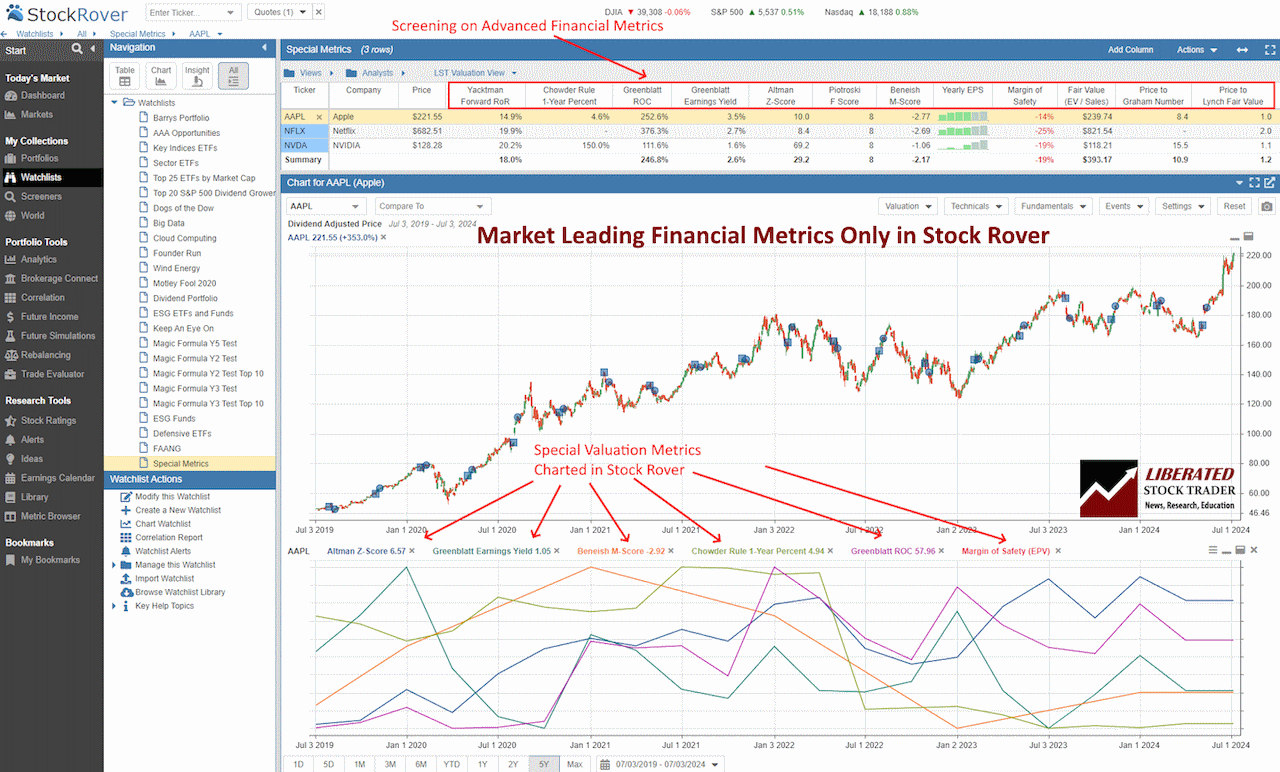
You do not need to calculate the Altman Z-Score manually; Stock Rover does it for you. Only Stock Rover provides advanced hybrid financial metrics, such as the Altman Z-Score, Piotroski F-Score, Beneish M-Score, Graham Number, Greenblatt Earnings Yield, Greenblatt ROC, Chowder Rule, Yacktman Forward Rate of Return and the Sharpe Ratio.
The chart screenshot below shows the Altman-Z Score plotted over time.

Chart & Screen the Altman-Z Score with Stock Rover
Core Components of the Formula
The Altman Z-Score formula includes several financial ratios that are combined to produce a single score. These ratios are:
- Working Capital / Total Assets (X1): Measures liquidity.
- Retained Earnings / Total Assets (X2): Indicates cumulative profitability.
- EBIT / Total Assets (X3): Reflects operational efficiency.
- Market Value of Equity / Total Liabilities (X4): Assesses leverage.
- Sales / Total Assets (X5): Demonstrates revenue generation ability.
Each ratio is multiplied by a respective coefficient and then summed to derive the Z-Score. The formula, in its original form for manufacturing firms, is:
Altman Z-Score = 1.2*1 + 1.4*2 + 3.3*3 + 0.6*4 + 1.0*5
Interpreting the Scores
The Z-Score values help assess the probability of bankruptcy. Here’s how to interpret the scores:
- Above 2.99: Indicates a financially sound company with low bankruptcy risk.
- 1.81 – 2.99: Suggests a cautionary zone, indicating some financial risk.
- Below 1.81: Signals high bankruptcy risk and potential financial distress.
Financial analysts use these scores to make informed decisions. The model’s high accuracy, especially for manufacturing firms, makes it a valuable tool in finance. Adjustments to the coefficients are recommended for non-manufacturing firms to maintain predictive accuracy.
Calculation of the Altman Z-Score
The Altman Z-Score is a formula used to predict the likelihood of a company going bankrupt within the next two years. It incorporates five key financial ratios that evaluate different aspects, such as profitability, leverage, and liquidity.
The Five Financial Ratios
The Altman Z-Score uses five financial ratios:
- Working Capital / Total Assets: This ratio measures liquidity by comparing working capital to total assets. A higher ratio indicates better liquidity.
- Retained Earnings / Total Assets: This indicates how much of a company’s profits are reinvested in assets.
- Earnings Before Interest and Taxes (EBIT) / Total Assets: This assesses profitability by showing how much earnings the assets are generating.
- Market Value of Equity / Total Liabilities: This evaluates leverage by comparing the market value of a company’s equity to its liabilities. A higher ratio suggests better financial stability.
- Sales / Total Assets: This ratio measures asset turnover by showing how effectively a company is using its assets to generate sales.
Sample Calculation
To calculate the Altman Z-Score, use the following formula:
Z = 1.2(WC/TA) + 1.4(RE/TA) + 3.3*(EBIT/TA) + 0.6*(MVE/TL) + 1.0*(S/TA)**
Where:
- WC is Working Capital
- TA is Total Assets
- RE is Retained Earnings
- EBIT is Earnings Before Interest and Taxes
- MVE is the Market Value of Equity
- TL is Total Liabilities
- S is Sales
Example: A company has:
- Working Capital of $1 million
- Retained Earnings of $2 million
- EBIT of $3 million
- Market Value of Equity of $4 million
- Total Liabilities of $5 million
- Sales of $6 million
- Total Assets of $10 million
Plugging these into the formula:
Z = 1.2(1/10) + 1.4(2/10) + 3.3*(3/10) + 0.6*(4/5) + 1.0*(6/10)**
Z = 0.12 + 0.28 + 0.99 + 0.48 + 0.60
Z = 2.47
A Z-Score above 2.99 indicates a low risk of bankruptcy, while a Z-Score below 1.81 suggests a high risk. In this example, with a Z-Score of 2.47, the company has a moderate risk of bankruptcy.

Try Powerful Financial Analysis & Research with Stock Rover
Altman-Z Score for Investors
The Altman Z-Score is a widely used model in financial analysis and investment decision-making. This section will cover its application in investment analysis and its limitations.
Use in Investment Analysis
Investors use the Altman Z-Score to measure a company’s financial stability. It analyzes various financial ratios to help predict financial distress. The model combines metrics like working capital, retained earnings, and market capitalization to assess a company’s solvency.
Working capital/Total assets indicates liquidity, while retained earnings/Total assets show profitability. Including market capitalization/total liabilities helps assess leverage. These metrics from the balance sheet provide insights into the company’s financial strength.
Due to the limited information available in emerging markets, this tool is used to gauge financial strength. The Altman Z-Score’s simplicity and effectiveness make it valuable for both large and small businesses.
Limitations and Considerations
While useful, the Altman Z-Score has limitations. It assumes financial ratios remain constant, which might not always be true. The model’s discriminant analysis works best for manufacturing firms but less so for service-based industries.
Financial stability can vary based on market conditions, making it necessary to update the Z-Score regularly. Investors should also consider other qualitative factors, such as management quality and market trends.
The model might not account for external factors affecting a business, like regulatory changes. Its effectiveness in predicting bankruptcy can vary across different economic environments. Users should understand the context of their analysis before relying solely on the Z-Score for decision-making.
My thorough testing awarded TradingView a stellar 4.8 stars!
With powerful stock chart analysis, pattern recognition, screening, backtesting, and a 20+ million user community, it’s a game-changer for traders.

Whether you're trading in the US or internationally, TradingView is my top pick for its unmatched features and ease of use.
Explore TradingView – Your Gateway to Smarter Trading!
FAQ
What is the best software for screening and charting the Altman-Z Score?
Stock Rover is the best software for screening and charting advanced financial metrics like the Altman-Z score. Our testing shows it offers the widest array of metrics and ratios available on the market today.
How is the Altman Z-Score calculated?
The Altman Z-Score is calculated using a formula including working capital to total assets, retained earnings to total assets, earnings before interest and taxes to total assets, market value of equity to book value of total liabilities, and sales to total assets.
What does an Altman Z-Score indicate when assessing a company's financial health?
A higher Altman Z-Score suggests a lower probability of bankruptcy, while a lower score indicates a higher risk. Specifically, a score above 2.99 indicates a safe zone. Scores between 1.81 and 2.99 represent a gray zone, and scores below 1.81 indicate financial distress.
Can the Altman Z-Score be used for private companies, and if so, how does the formula differ?
Yes, the Altman Z-Score can be adapted for private companies. The formula modifies the original by using book value of equity instead of market value, helping provide a more accurate measure for companies that do not have publicly traded shares.
What constitutes a good Z-Score in financial analysis?
A "good" Z-Score is typically above 2.99, indicating a low risk of bankruptcy. Firms with scores in this range are considered financially stable. Scores between 1.81 and 2.99 suggest moderate risk, requiring further analysis, while a score below 1.81 signals high bankruptcy risk.
How is the Altman Z-Score interpreted across different industries, such as for banks?
The Z-Score can vary in interpretation depending on the industry. For example, traditional Z-Score models may not be accurate for banks due to their unique balance sheets. Researchers often use modified versions of the Z-Score to fit specific sectors like banking better.
What implications arise from an Altman Z-Score of less than 1.81?
An Altman Z-Score of less than 1.81 indicates that a company is in financial distress and faces a high risk of bankruptcy. This score requires immediate attention and possibly restructuring or strategic changes to improve financial health.
