Barry D. Moore CFTe
422 POSTS
240 COMMENTS
With a wealth of experience spanning 25 years in stock investing and trading, Barry D. Moore (CFTe) is an author and Certified Financial Technician (Market Analyst) recognized by the International Federation of Technical Analysts (IFTA). Notably, he has also held executive positions in leading Silicon Valley corporations IBM Corp. and Hewlett Packard Inc.
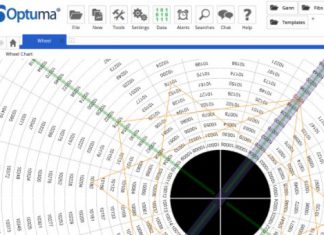
Optuma Review 2024: Pro Stock Chart Analysis Tested
This Optuma review reveals a comprehensive market analysis platform developed for professional technical analysts in financial institutions that is also available to retail investors.
TC2000 vs TradingView 2024: 20 Features Tested & Rated
TradingView scores 4.6/5 because it does well in community, charts, backtesting, news, and screening. TC2000 scores 3.7/5 because it lacks social community, news, backtesting, and pattern recognition capabilities.
Finviz vs Tradingview 2024: Tested, Rated & Ranked
TradingView scores 4.5/5.0 because it does everything well, and Finviz scores 3.6/5.0 because it lacks a community, live trading, and has inferior charts. However, Finviz excels at rapidly visualizing vast stock market data on a single screen.
6 Best Free Real-Time Stock Quotes & Charts 2024
Our tests show the best free real-time quotes and live stock charts are TradingView, Firstrade, TC2000, and Yahoo Finance. Real-time stock quotes cost money, but these companies provide exchange data and charts for free.
Top 4 Value Investing Screeners Tested by LiberatedStockTrader
The best value investing stock screener overall is Stock Rover because it has 650 screening metrics, including fair value, margin of safety, plus Graham and Greenblatt calculations.
TradingView vs StockCharts: Who’s the Boss in 2024?
Our comparative testing of TradingView vs. Stockcharts shows TradingView is a powerful global stock charting platform with 13 million active users, compared to StockCharts.com, which has expert commentary but only covers US markets.
Stock Rover vs. Finviz: Who is the King of Stock Screening?
Our comparison of Stock Rover vs Finviz reveals that Stock Rover is best for screening, stock research, and portfolio management. Finviz is better at stock pattern recognition and heatmaps. I wholeheartedly recommend Stock Rover.
How to Take Advantage of Qualified Dividends
Investors need to ensure that the stocks they hold meet specific criteria set by the IRS to take advantage of qualified dividends. These criteria include holding the stock for 60 days for common stock and 90 days for preferred stock.
Are Keltner Channels Worth Trading? Best Settings Tested
A Keltner Channel is a volatility-based trading indicator combining a simple moving average, exponential moving average, and average true range to plot a channel on a chart. It identifies trading signals using overbought and oversold conditions.
Advance/Decline (A/D) Line Explained by a Certified Analyst
The advance/decline (A/D) line indicator measures market breadth by identifying how many stocks participate in a market advance or decline. It is calculated by taking the number of advancing stocks minus the declining stocks.
MACD Strategy & Reliability Tested by LiberatedStockTrader
MACD is a trend-following momentum indicator used to identify price trends. We conducted 606,422 test trades to find the best settings and trading strategies.
Best Commodity Channel Index (CCI) Settings Tested on 43,297 Trades
Our test data shows that using the CCI indicator with a 50 setting on the S&P 500 index stocks over 20 years was incredibly profitable, returning a 1,108% profit compared to the market, which returned 555%.
7 Parabolic SAR Trading Strategies Tested by LiberatedStockTrader
The Parabolic Stop and Reverse (PSAR) technical indicator identifies asset price reversals. Relying on parabolic time/price systems it creates effective trailing stop-losses for trading signals.
Bollinger Band Trading Strategies Tested by LiberatedStockTrader
Our reliability testing of Bollinger Bands on the S&P 500, using 13,360 years of data, suggests it is an unreliable, unprofitable indicator for traders. However, Bollinger Bands can be profitable, but you need to know how it works, how to trade it, and the optimal settings.
Rate of Change Indicator Test: Trading a 66% Success Rate
The Rate of Change (ROC) is a momentum indicator that measures the speed and direction of asset price movements. It helps traders determine whether a security is trending and how quickly its price changes.
Stochastic Oscillator Explained: Best Strategy & Settings Tested
The Stochastic Oscillator momentum indicator compares an asset's closing price to a range of its previous prices. It oscillates between 0 and 100; below 20 indicates oversold, and above 80 suggests an overbought market.
4 Experts Reveal Favorite Dividend Investing Strategies
All dividend stocks share one big similarity: their ability to produce earnings. Pay attention to the history and safety of these companies' dividend payments and the potential for these payments to grow, and increasing wealth follows from there.
10 Tips For Investing In Dividend Stocks Like A Pro
The best way to build long-term wealth is to invest discretionary income into high-quality dividend stocks, reinvest dividends, and let the magic of compounding work over time.
The Realities of Margin Trading Investigated & How to Avoid Lossess.
Our research shows that overconfidence and a lack of a robust trading plan are the biggest reasons traders lose when trading with margin or leverage.
16 Insights To Trade Leveraged ETFs Successfully
To successfully trade leveraged ETFs, you must understand the importance of ETF decay, liquidity, volume, fees, assets under management, and potential risks.


