The Bat Pattern is a harmonic trading strategy used in technical analysis to identify potential trend reversals in equities, currencies, or commodities.
The Bat pattern is defined by four price movements that create a shape reminiscent of a bat’s wings, hence its name.
A Bat Pattern is one of six harmonic chart patterns used to predict potential reversals in market trends. Identifying these patterns can provide an edge when trading stocks, forex, and futures.
Harmonic patterns, including the Bat Pattern, are based on precise Fibonacci retracement and extension levels. Traders who master the Bat Pattern can sometimes spot trend reversals before they happen, allowing them to enter or exit positions at optimal times.
There is little evidence of structured backtesting on the Bat pattern. I attempt to discover if it really works and if you should trade it.
Key Takeaways
- Bat Patterns help predict trend reversals.
- The pattern resembles a bat’s wings.
- Harmonic bat patterns rely on Fibonacci levels for support and resistance.
- Backtesting reveals considerable variation in reliability.
- The bat is not one of the most profitable patterns.
- The bullish Bat averages a high 66% win rate on the Nasdaq 100, with a 6.24% average win per trade.
- Testing the bearish Bat showed it should be avoided. It achieved its price target only 37% of the time, with a 1.68% average return per trade.
- Traders can use a TradingView Harmonics indicator to identify and backtest the pattern on charts automatically.
Understanding Bat Patterns
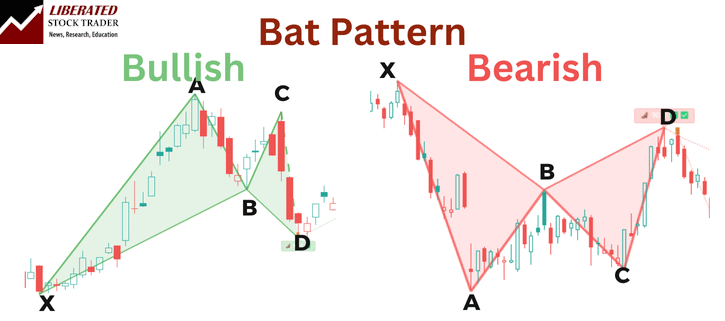
Bat patterns are harmonic chart patterns composed of four legs (XA, AB, BC, and CD). They are often used in trading to predict reversals. They rely heavily on Fibonacci ratios for their formation and identification, which helps determine potential entry points.
Scott M. Carney discovered the bat pattern in 2001 and published it in his book Harmonic Trading Volume One.
However, when I read the book, no backtesting was performed, and there was little evidence that this pattern actually works consistently. In this article, I will attempt to quantify its importance in trading.
Identifying the Bat Pattern
Identifying a Bat Pattern requires pinpointing the four distinct legs (XA, AB, BC, and CD).
- The key leg to recognize is the XA leg, setting the foundation.
- Next, the AB leg should retrace around 38.2% to 50% of the XA leg.
- The BC leg typically retraces from 38.2% to 88.6% of the AB leg.
- The CD leg is crucial as it completes the pattern, often extending to 88.6% of XA.
Automating Bat Pattern Identification
Harmonic patterns like the bat are difficult to identify manually. However, you do not need to manually search and draw them because TradingView has a special indicator that can detect all harmonic patterns automatically.
I have tested most of the harmonic indicators in TradingView, and the best one to enable is below.
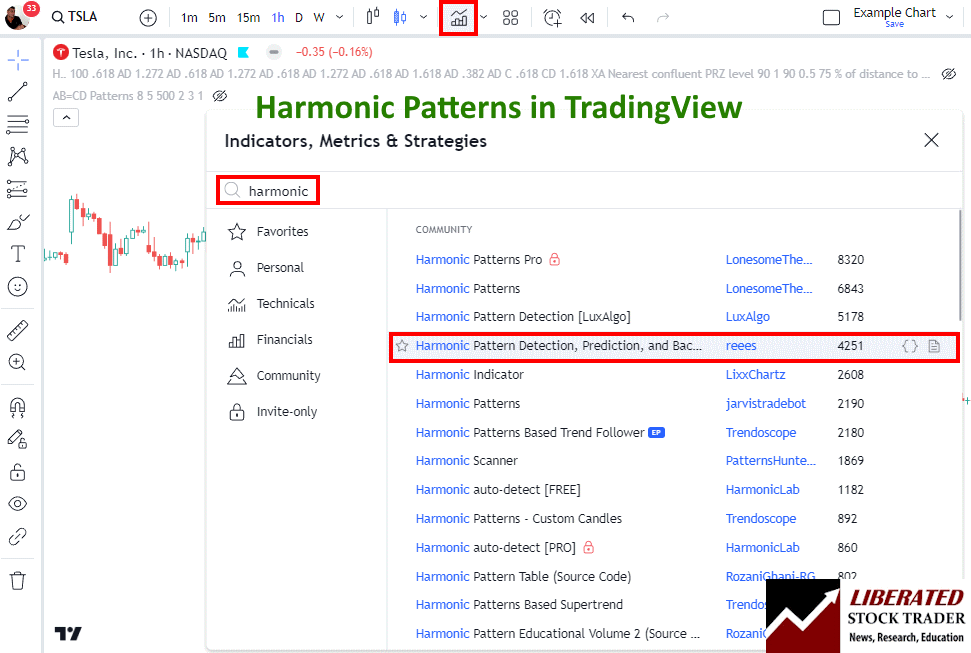
To enable automated harmonic pattern detection in charts, follow these steps:
- Visit TradingView
- Select Indicators -> Search for Harmonic
- Select Harmonic Pattern Detection by User “Reees”
This script not only identifies the patterns but also performs backtesting automatically.
Bat Pattern Fibonacci Ratios
Fibonacci ratios are the backbone of Bat Patterns. The 0.886XA retracement ratio is critical when identifying the CD leg’s potential reversal point. Additionally, the AB leg and BC leg often align with ratios like 1.618, providing further validation. Fibonacci measurements ensure the pattern aligns harmonically, enhancing predictive accuracy in trading strategies.
| Bat Pattern Leg | Retracement/Extension |
|---|---|
| XA | Foundational Leg |
| AB | 38.2% to 50% of XA |
| BC | 38.2% to 88.6% of AB |
| CD | Completes at 88.6% of XA |
By adhering to these ratios and understanding the framework, traders can utilize Bat Patterns effectively to anticipate future market movements.
Trading with Bat Patterns
Bat patterns in trading help traders identify potential reversal zones (PRZ) to help improve trading outcomes. These patterns consist of specific points, including Point D, where traders can strategically enter or exit trades.
Strategies for Trading Bullish Bats
This bullish pattern typically forms during a downtrend and signifies a potential reversal to an uptrend. It should be traded in a downtrend during a bull market.
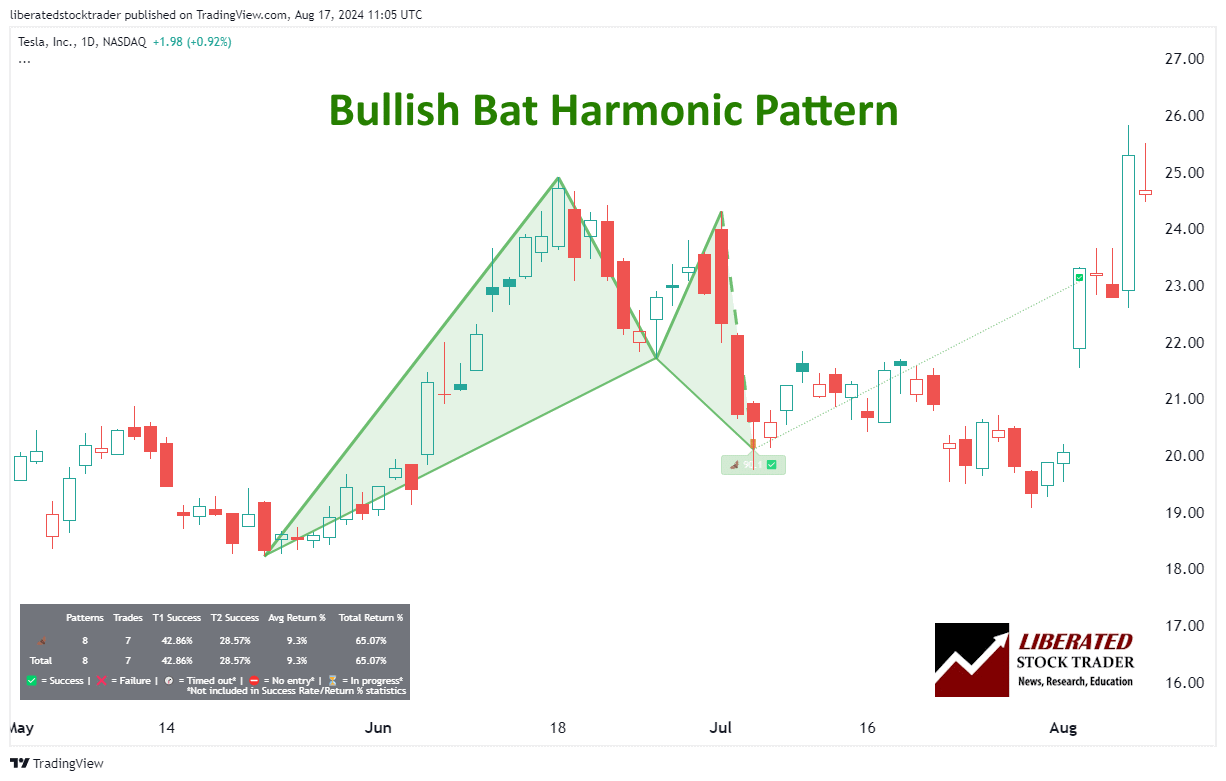
Automatic Bat Pattern Recognition with TradingView
6 Steps for Trading a Bullish Bat
- Ensure the pattern occurs in a downtrend in a bull market.
- When point D is confirmed, wait for a price increase to begin.
- Set a stop-loss between point D and point X.
- The initial price target is a Fibonacci retracement of 61.8% of point CD. That means if point C was $10 and D was $5, you can expect the price target to be approximately $8.09. ($10-$5)*0.618 + $5 = $8.09
- Once the price reaches the initial target, consider taking partial profits and trailing your stop-loss to secure any gains.
- If the price continues to rise, you can use additional Fibonacci retracement levels as potential exit points or set a new take-profit point at a key resistance level.
Is the Bullish Bat Reliable or Profitable?
Yes, based on our backtested trades, the Bullish bat is reliable. Based on 23 years of Nasdaq 100 exchange data, the bullish Bat pattern achieved its price target 66.6% of the time, with a 6.24% average return per trade.
Performance varies incredibly for each stock; for example, Tesla had only a 25% win rate and a 5.12% average loss per trade.
Trading the Bullish Bat with Microsoft Corp. would have resulted in 63% of trades hitting the price target, which produced an average return per trade of 8.38%.
Because of these mixed results, traders should ensure they trade stocks in a strong uptrend.
Strategies for Trading Bearish Bats
This bearish pattern forms in an uptrend, signaling a potential move to the downside. The structure is similar but in reverse, indicating sell positions at Point D.
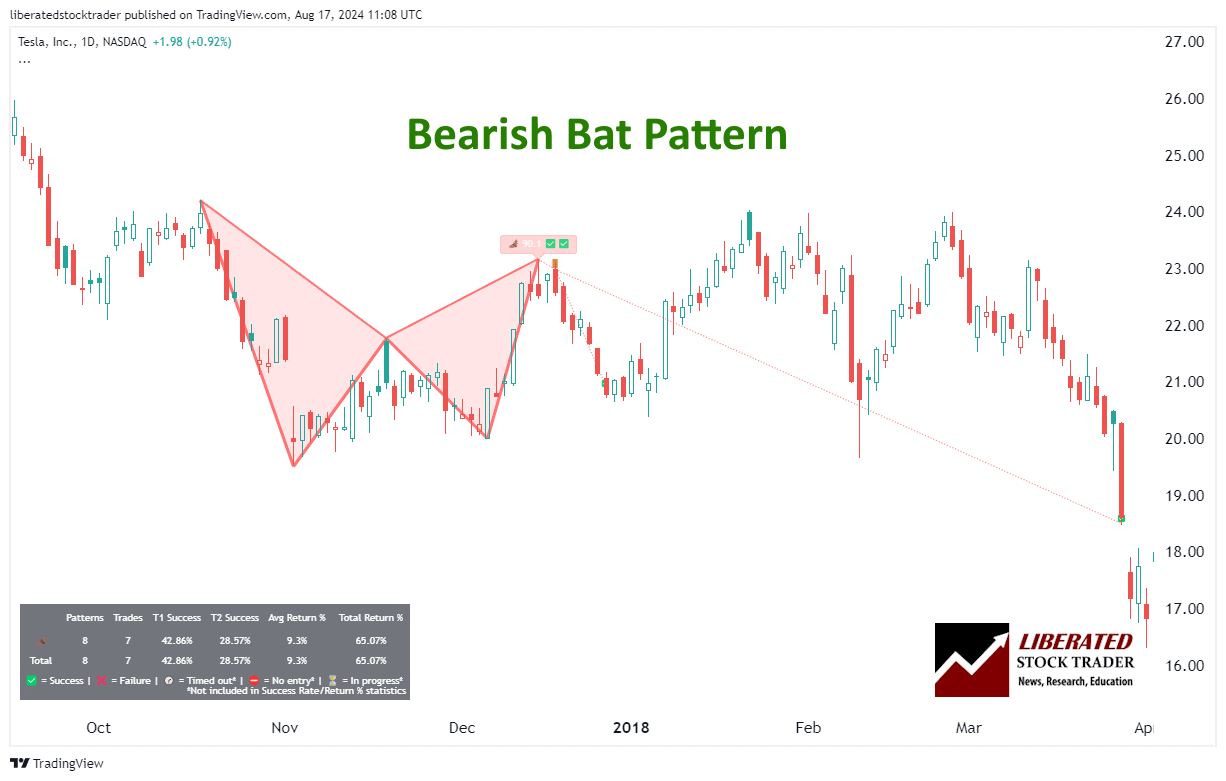
6 Steps for Trading a Bearish Bat
- Ensure the pattern occurs in an uptrend in a bear market.
- When point D is confirmed, wait for a price decrease to begin.
- Set a stop-loss between point D and point X.
- The initial price target is a Fibonacci retracement of 61.8% of point CD. That means if point C was $10 and D was $15, you can expect the price target to be approximately $13.36 ($15-$10)*0.618 + $10 = $11.91
- If the price reaches the initial target, consider taking partial profits and trailing your stop-loss to secure any gains.
- If the price continues to decrease, you can use additional Fibonacci retracement levels as potential exit points or set a new take-profit point at a key support level.
Is the Bearish Bat Reliable or Profitable?
No, trading the bearish bat pattern is not reliable. Based on our backtested trades on 23 years of Nasdaq 100 exchange data, the bearish bat pattern achieved its price target only 37% of the time, with a 1.68% average return per trade.
Performance varies incredibly for each stock; for example, Tesla had a 66% win rate and a 28.52% average win per trade.
However, trading the bearish bat with Microsoft Corp. would have resulted in only 37% of trades hitting the price target, which produced an average return per trade of 1.65%.
Because of these mixed results, traders should use this pattern only in strong downtrends.
Setting Stop Loss and Take Profit
Stop-loss Orders are crucial for risk management in Bat pattern trading. Traders place stop-loss orders slightly below the PRZ in a bullish pattern or above the PRZ in a bearish pattern. This setup minimizes potential losses if the market moves against the trade.
Take Profit levels should be strategically placed at Fibonacci retracement levels from the pattern’s swing points. For instance:
- First level: 38.2%
- Second level: 61.8%
Using these levels allows traders to secure profits incrementally, enhancing the risk-reward ratio.
Combining Bat Patterns With Other Indicators
Using highly profitable chart indicators, such as VWAP, Stochastics, and the Alligator in bat pattern trading, could strengthen the trading strategy. You can test these combinations using TradingView.
Trading Bats in Forex and Futures
Bat patterns can also be used in Forex trading. My backtesting on the EUR/USD revealed a 52% chance of the price target being achieved and a 2.01% average trade return. For the USD/EUR, the success rate was much lower at 44.67%, with a 0.4% average return per trade.
Do Bat Patterns Work?
Yes, Bat patterns work well on indices, but only between 26% and 64% of the time on individual stocks. The profit per trade can vary widely between stocks, from fractions of a percent to 8% per trade.
Testing the bat on major Forex pairs did not yield strong results, with an average win percentage of 45% and an average return between 0.4% and 2%.
Is the Bat Pattern a Good Trade?
No, in my opinion, the Bat pattern has very mixed results, with some highly profitable trades and some losers. Additionally, it is quite a rare pattern that occurs infrequently in charts.
What are the Most Reliable Chart Patterns?
Decades of research reveal the Head and Shoulders as the most reliable chart pattern, boasting an impressive 89% success rate. Following closely are the Double Bottom at 88% and the Triple Bottom and Descending Triangle at 87%. The Rectangle Top emerges as the most profitable, yielding an average win of 51%, closely trailed by the Rectangle Bottom at 48%.
Find out more about reliable chart patterns in this article.
Other Harmonic Patterns
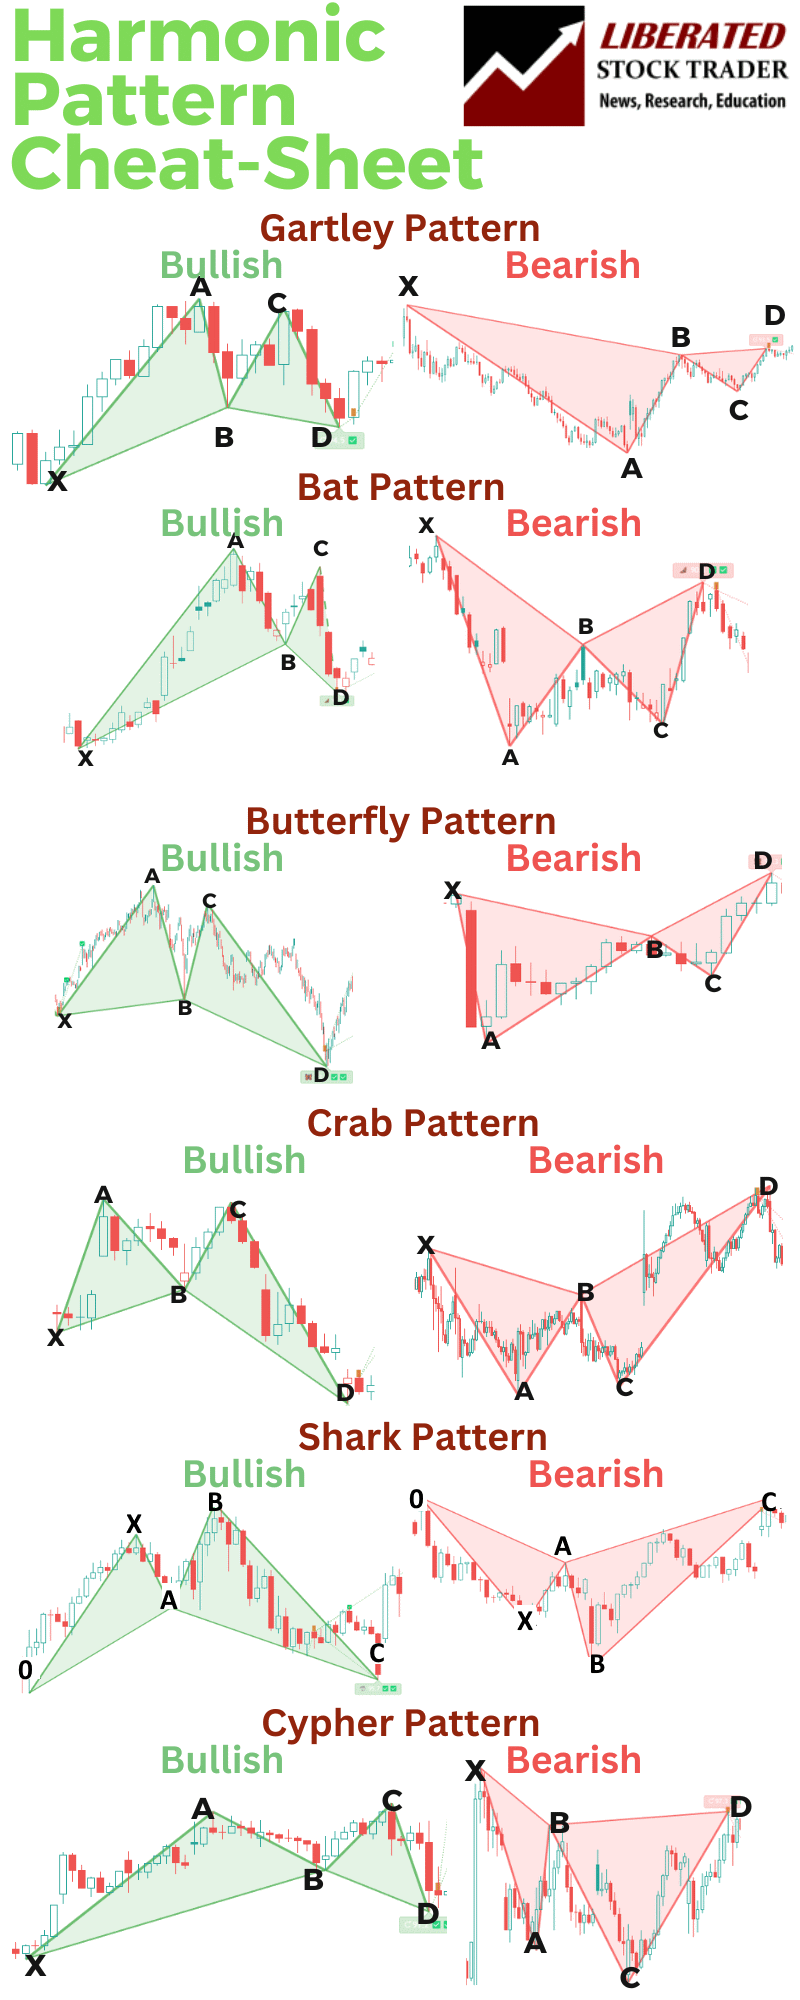
The six key harmonic patterns in technical analysis are Gartley, Bat, Crab, Butterfly, Shark, and Cypher. While the Bat pattern is widely used, understanding all patterns is crucial for harmonic traders.
Our Harmonic Patterns Cheat Sheet
FAQs
What is the best software for trading a Bat chart pattern?
After extensive testing, I personally use TradingView to backtest and trade harmonic patterns like the bat. Its custom indicator, Harmonics, automatically detects all harmonic patterns.
What are the critical levels in a bat pattern retracement?
Critical levels for a bat pattern include the retracement points of 38.2% to 50% of the initial XA leg for point B and 88.6% of XA for point D. These levels are pivotal in determining the validity of the bat pattern in trading scenarios.
What is the difference between a bat and a gartley pattern?
A significant difference between a bat and a gartley pattern lies in the Fibonacci retracement levels. In a bat pattern, the D point is at an 88.6% retracement of XA, whereas in a Gartley pattern, the D point typically completes at a 78.6% retracement of XA.
How do you identify a bat pattern on charts?
I recommend using TradingView to identify bat patterns automatically. To do it manually, look for a five-point retracement structure labeled XABCD. The B point retraces 38.2% to 50% of XA, the C point must extend to at least 38.2% but not beyond 88.6% of AB, and the D point is located at the 88.6% retracement of XA.
How can one use bat patterns for trading strategy development?
Traders can use bat patterns to identify potential reversal zones and make strategic entry and exit decisions. Bat patterns can also help traders set stop-loss and take-profit levels more effectively based on past market movements' historical performance.
What are the potential risks when trading with the bat pattern?
The primary risk of trading with bat patterns is the high possibility of false signals, which can lead to losses if the pattern fails to predict a price movement. For me, the risk outweighs the benefits of this pattern.
