The Beneish M-Score is a calculation used to detect earnings manipulation in financial statements.
The Beneish M-Score uses credit, margins, assets, sales, and leverage financial ratios to help identify companies that may be falsifying their earnings.
Its effectiveness lies in its ability to highlight unusual patterns in financial data.
For many investors and analysts, the Beneish M-Score provides an early warning system against potential fraud. By analyzing specific metrics, the model calculates a score that signals whether a company is likely to manipulate its earnings. This information can be crucial for better long-term investment decisions and reducing risk.
Key Takeaways
- Beneish M-Score helps detect earnings manipulation in financial statements.
- It provides early warnings for potential financial fraud.
- Knowing how to interpret the M-Score is crucial for accurate financial analysis.
- Companies with an M-Score exceeding -2.22 may be manipulating their earnings.
Anyone involved in financial analysis must understand how to use and interpret the Beneish M-Score. It helps differentiate between genuine financial reports and manipulated ones, offering a clearer picture of a company’s true financial health.

Understanding the Beneish M-Score
The Beneish M-Score is a mathematical tool for detecting fraud in financial statements. It uses eight distinct variables to identify companies that might be manipulating their earnings.
It is named after Professor Messod Beneish, who developed the model. It aims to uncover fraud in financial statements by analyzing various financial ratios. The formula integrates multiple financial metrics to give an overall score, which indicates the likelihood of fraud.
Companies with an M-Score above -2.22 are likely manipulating their earnings. This threshold helps investors and analysts identify risky investments.
The Eight Variables of the M-Score
The formula consists of eight variables, each capturing different elements of potential fraud:
- Days Sales in Receivables Index (DSRI): Measures how sales on credit have changed.
- Gross Margin Index (GMI): Compares gross margins over time.
- Asset Quality Index (AQI): Assesses how asset quality changes.
- Sales Growth Index (SGI): Examines fluctuations in sales growth.
- Depreciation Index (DEPI): Looks at changes in depreciation rates.
- Sales, General, and Administrative Expenses Index (SGAI): Tracks administrative costs.
- Leverage Index (LVGI): Evaluates changes in debt levels.
- Total Accruals to Total Assets (TATA): Measures accruals relative to total assets.
These variables are computed from a company’s financial statements to give the M-Score, indicating potential red flags.
Beneish M-Score Formula
M-Score = -4.84 + 0.92 * DSRI + 0.528 * GMI + 0.404 * AQI + 0.892 * SGI + 0.115* DEPI – 0.172 * SGAI + 4.679 * LVGI – 0.327*TATA
Beneish M-Score Calculation Explained
The Beneish M-Score is a financial model designed to identify potential earnings manipulation by companies. Professor Messod D. Beneish developed it in 1999, and it has been used as a tool for forensic accounting and fraud detection.
The M-Score is calculated using eight different financial ratios, which are combined to generate a single score that indicates the likelihood of fraudulent activity within a company’s financial statements. These ratios include the ones mentioned above – DSRI, GMI, AQI, SGI, DEPI, SGAI, LVGI, and TATA.
A high M-Score (above -2.22) suggests a higher probability of earnings manipulation or accounting irregularities. On the other hand, a low M-Score (below -2.22) indicates a lower likelihood of fraudulent activity.
Companies with high M-scores may be using techniques such as inflating revenues, understating expenses, or manipulating reserves to artificially boost their earnings. These techniques include aggressive revenue recognition, cookie jar accounting, and improper capitalization of expenses.
Investors should pay attention to companies with consistently high M-Scores and investigate further before making any investment decisions. It is also important to note that the M-Score does not provide definitive evidence of fraud but rather serves as an indicator for further investigation.
Charting & Screening the Beneish M-Score
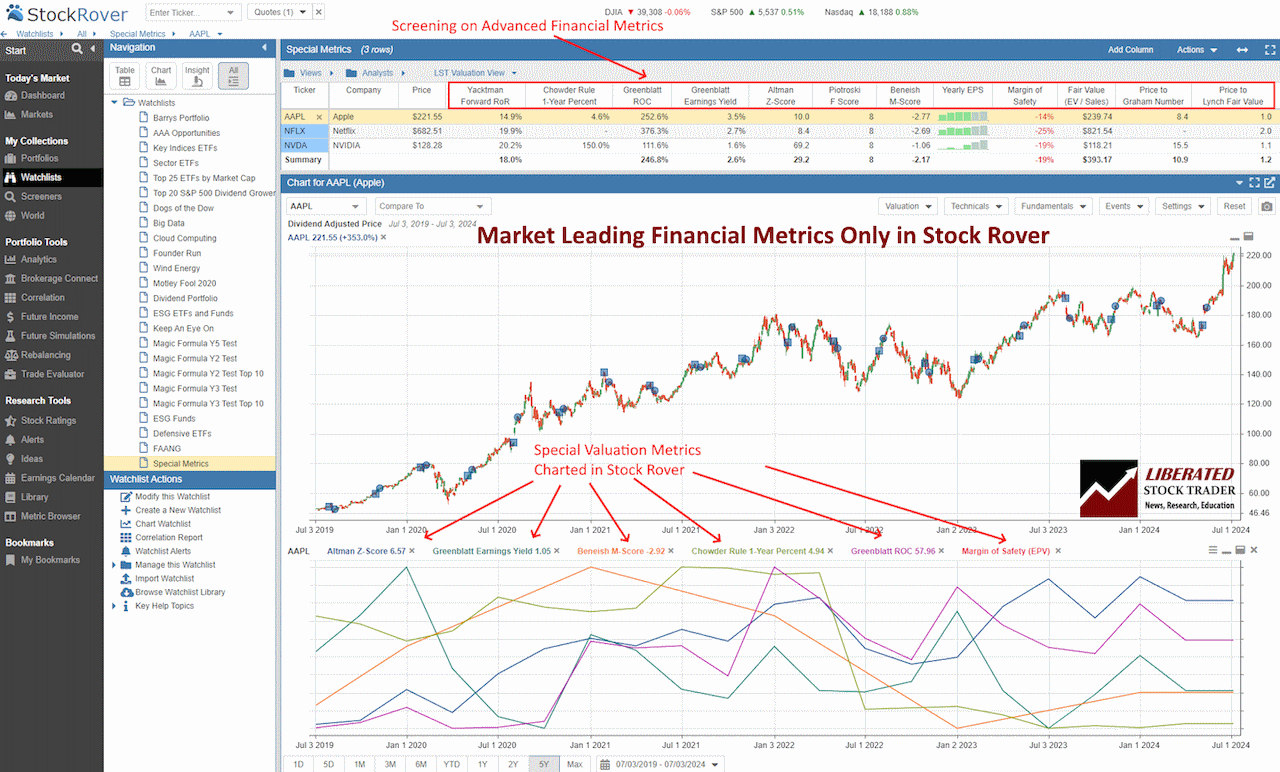
You do not need to calculate the Beneish M-Score manually; Stock Rover does it for you. Only Stock Rover provides advanced hybrid financial metrics, such as the Beneish M-Score, Altman Z-Score, Piotroski F-Score, Graham Number, Greenblatt Earnings Yield, Greenblatt ROC, Chowder Rule, Yacktman Forward Rate of Return and the Sharpe ratio.
The chart screenshot below shows the Beneish M-Score plotted over time.

Chart & Screen the Beneish M-Score with Stock Rover
M-Score Rating Table
| M-Score Range | Rating |
| Below -2.22 | Low likelihood of fraudulent activity |
| -2.22 to -1.78 | Moderate likelihood of fraudulent activity |
| -1.78 to -1.22 | Potential fraudulent activity detected |
| -1.22 and above | High likelihood of fraudulent activity |
How the Beneish M-Score Works
The Beneish M-Score is a statistical model for determining if the company’s earnings have a high probability of accounting manipulation. An M-Score rating over -1.78 suggests possible earnings manipulation. Professor Beneish found that investing in low M-Score stocks and shorting high M-Score stocks would have outperformed the market by about 15% over the 7-year period he studied.
Application and Limitations
The Beneish M-Score is widely used for financial analysis. It has been applied to detect fraud in various industries, including small and medium enterprises and the banking industry.
However, it is not foolproof. The model may miss some instances of fraud or falsely flag legitimate companies. Analyst judgment and additional tools are often needed to confirm findings.
Understanding these limitations helps users apply the M-Score more effectively and interpret its results with caution.
Additionally, a 2020 study suggested that the predictability of fraud detection using the Beneish M-score is less reliable than that of the Altman Z-score. Research findings did not validate the effectiveness of the Beneish model in anticipating fraudulent financial statements. Ultimately, the selection of forensic tools significantly impacts the outcomes of fraud detection.
Interpreting the Beneish M-Score
The Beneish M-Score is a mathematical model used to detect potential earnings manipulation in a company’s financial statements. It is especially valuable for understanding reported earnings and comparing them against established threshold values. This section explains how to assess the probability of earnings manipulation, define benchmarking, and explore historical and current case studies.
Assessing Probability of Earnings Manipulation
The Beneish M-Score uses eight financial metrics to identify the likelihood of earnings manipulation. These metrics include Days Sales in Receivables Index and Gross Margin Index. A high M-Score suggests a higher probability of manipulation.
The model’s formula incorporates these metrics into a score that can indicate risk. An M-Score greater than -1.78 typically raises red flags, suggesting further investigation. Financial analysts and auditors use this to pinpoint discrepancies in reported earnings.
Benchmarking and Threshold Values
Benchmarking involves comparing a company’s M-Score against critical threshold values. The primary threshold is -2.22, above which companies are considered likely to manipulate earnings. This benchmark was established through statistical analysis and back-testing.
Accuracy in interpreting M-Score values is key. An M-Score is not foolproof and can yield false positives. Therefore, while an M-Score above -2.22 indicates potential manipulation, it should be corroborated with additional analysis to avoid mistakenly flagging compliant companies.

Try Powerful Financial Analysis & Research with Stock Rover
Case Studies: From Enron to Contemporary Examples
Enron Corporation is a well-known case that illustrates the Beneish M-Score’s application. Before its collapse, Enron’s M-Score suggested the significant risk of earnings manipulation. Analysts later confirmed these suspicions through deeper financial investigations.
Contemporary examples, like those occurring with companies such as Tesla, also serve as important case studies. Evaluating recent financial statements with the Beneish model helps detect any anomalies in their reported earnings. This historical and modern application demonstrates the model’s continued relevance and utility in the field of financial analysis.
By applying the Beneish M-Score model to both historical and modern cases, financial professionals can better understand and interpret potential financial misrepresentations.
Using the Beneish M-Score in Financial Analysis
The Beneish M-Score is a powerful tool used by investors and financial analysts to detect earnings manipulation in a company’s financial statements. It uses a probabilistic model to assess the likelihood of fraud, helping analysts make more informed decisions.
Financial Tools Supporting the Beneish M-Score
The Beneish M-Score can be calculated using various online calculators or Excel spreadsheets. However, these tools are inefficient for compiling financial statement data, such as receivables, sales, and depreciation.
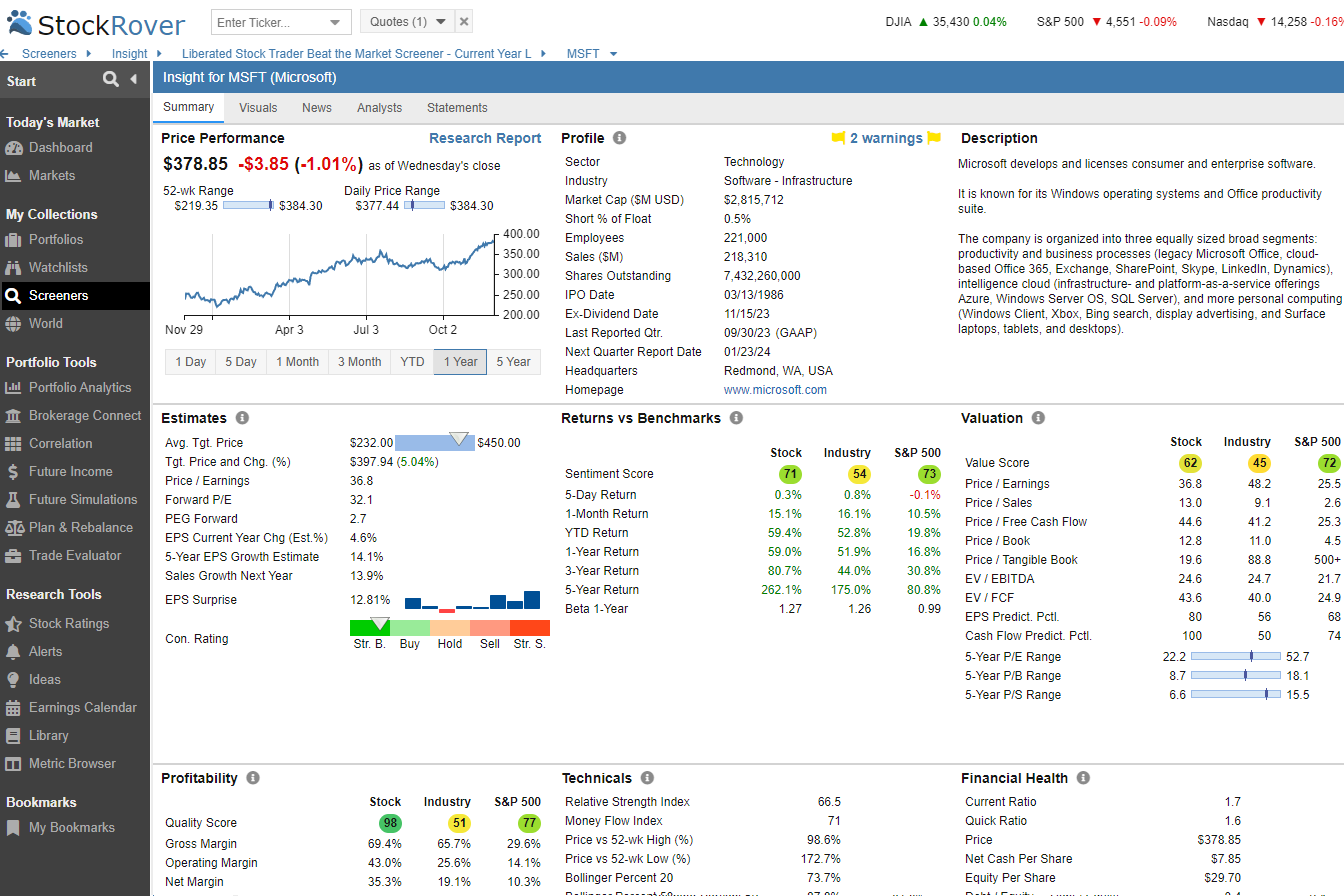
The best way to automate the calculation of complex financial metrics is to use Stock Rover. It is a powerful stock research platform that compiles financial statement data and applies the Beneish M-Score to provide a more accurate assessment of a company’s financial health. It also compiles and flags any financial warnings in its research reports.
Integration with Other Financial Instruments
The Beneish M-Score is often used in conjunction with other financial instruments to provide a more comprehensive view of a company’s health. For example, the Piotroski F-Score and Altman Z-Score are frequently used alongside the Beneish model.
By combining these tools, analysts can cross-verify their results, thereby increasing the reliability of their financial analysis. This holistic approach aids in the better assessment of portfolios, ensuring that potential investments are sound. Financial firms and investors alike benefit from such integration, making more accurate predictions regarding the company’s future performance. This layered approach is crucial for thorough due diligence and risk management.
Beyond the Beneish M-Score: Related Concepts
Fraud detection involves more than just the Beneish M-Score, with complementary tools and additional metrics providing a fuller picture of a company’s financial health.
Complementary Tools in Fraud Detection
Several models and tools work well with the Beneish M-Score to detect financial fraud. One such tool is the Piotroski F-Score. This score evaluates nine factors in three categories: profitability, leverage/liquidity, and operating efficiency. It helps assess a company’s financial strength.
Another useful metric is the Dechow F-Score. Similar to the Beneish M-Score, it focuses on accrual-based financial statement manipulations but includes additional components like cash flows and discretionary expenses.
Combining these tools can provide a robust framework for identifying anomalies in a company’s financial statements, increasing the chances of detecting fraudulent activities.
Additional Accounting Metrics for Investment Decisions
Investors often use extra accounting metrics to make informed decisions. The Gross Margin Index (GMI) is one such metric. It highlights inconsistencies in a company’s gross margins over time, which could indicate potential earnings manipulation.
Another important metric is the Asset Quality Index (AQI). This index measures the proportion of assets that are less likely to generate future earnings. A high AQI could suggest aggressive accounting practices.
Sales Growth Index (SGI) and Depreciation Index (DEPI) also provide insights into cash flow stability and asset management. The Leverage Index (LVGI) and Total Accruals to Total Assets (TATA) are equally important in assessing the company’s leverage and total accruals relative to its total assets, respectively. These metrics collectively contribute to a comprehensive analysis of a company’s financial health, guiding better investment decisions.
Investing In Stocks Can Be Complicated, Stock Rover Makes It Easy.
Stock Rover is our #1 rated stock investing tool for:
★ Growth Investing - With industry Leading Research Reports ★
★ Value Investing - Find Value Stocks Using Warren Buffett's Strategies ★
★ Income Investing - Harvest Safe Regular Dividends from Stocks ★

"I have been researching and investing in stocks for 20 years! I now manage all my stock investments using Stock Rover." Barry D. Moore - Founder: LiberatedStockTrader.com
FAQ
What is the best software for screening and charting the Beneish M-Score?
Stock Rover is the best software for screening and charting advanced financial metrics like the Beneish M-Score. Our testing shows it offers the widest array of metrics and ratios available on the market today.
How is the Beneish M-Score calculated?
The Beneish M-Score is calculated using eight financial ratios. These include Days Sales in Receivables Index (DSRI), Gross Margin Index (GMI), and Asset Quality Index (AQI). Each ratio is used to gauge different aspects of a company's financial health, which are then combined to give the final M-Score.
What does the Beneish M-Score indicate about a company?
A Beneish M-Score helps identify the likelihood of a company manipulating its earnings. A higher score suggests that the company might be manipulating its earnings, while a lower score indicates a lower likelihood of earnings manipulation.
Is there a reliable screener available to identify stocks with high Beneish M-Score?
Yes, Stock Rover provides a screener that can filter stocks based on their Beneish M-Score. It helps investors quickly identify companies with high scores and strong financial health.
Can the Beneish M-Score be used to screen for earnings manipulation?
Yes, the Beneish M-Score can be used to screen companies for potential earnings manipulation. Analyzing the financial ratios can help investors and analysts flag companies that may require further investigation.
How can one interpret the results of a Beneish M-Score computation?
The M-Score usually has a threshold, typically -2.22. If a company's M-Score is above this threshold, it suggests potential earnings manipulation. Conversely, an M-Score below this threshold indicates the financial statements are less likely to be manipulated.
What are the implications of a high or low M-Score on a company's financial health?
A high M-Score may imply financial distress or aggressive accounting practices, which could be a red flag for potential financial fraud. A low M-Score suggests that the company's financial health is more stable and transparent, indicating a lower risk of manipulation.
How accurate is the Beneish M-Score in detecting financial fraud?
Research supports the accuracy of the Beneish M-Score in detecting financial fraud, but it is not foolproof. Studies show that it can be effective in identifying financial statement manipulation, but it should be used as part of a broader analysis rather than a standalone tool. For example, the Beneish M-Score model was effective in the early detection of misstatements at Comscore, Inc.
