Professionally trading in financial markets involves analyzing patterns and understanding their probability of success.
Among all the patterns, indicators, and charts I have tested, harmonic patterns stand out due to their Fibonacci-based mathematical symbolism.
Do Harmonic chart patterns actually work in trading and technical analysis? The answer is yes, but not all patterns are effective under scientific testing. The difference is in the data.
In this article, I will introduce you to six harmonic patterns. These patterns have been backtested extensively with decades of data to test their effectiveness in different market conditions.
Key Takeaways
- Harmonic patterns help predict trend reversals.
- Specific harmonic patterns are highly profitable, others not.
- Identifying harmonic patterns manually on a chart is difficult and time-consuming.
- Traders can use a TradingView Harmonics indicator to identify and backtest the pattern on charts automatically.
Automating Harmonic Pattern Identification
Harmonic patterns are difficult to identify manually. However, you do not need to search for them and draw them on a chart because TradingView has a special indicator that can detect all harmonic patterns automatically.
I have tested most of the harmonic indicators in TradingView, and the best one to enable is below.
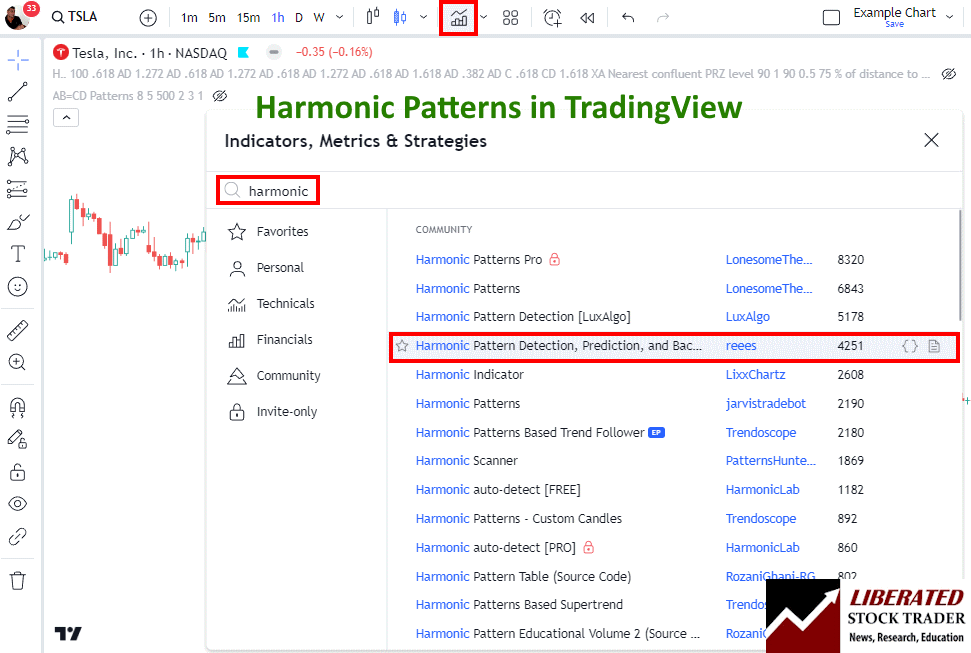
To enable automated harmonic pattern detection in charts, follow these steps:
- Visit TradingView
- Select Indicators -> Search for Harmonic
- Select Harmonic Pattern Detection by User “Reees”
This script not only identifies the patterns but also performs backtesting automatically. All the testing and images used in my research are from TradingView.
1. Shark Pattern
The Shark Pattern is one of the most reliable and profitable harmonic patterns in trading. It stands out due to its unique Fibonacci ratios and wave structure.
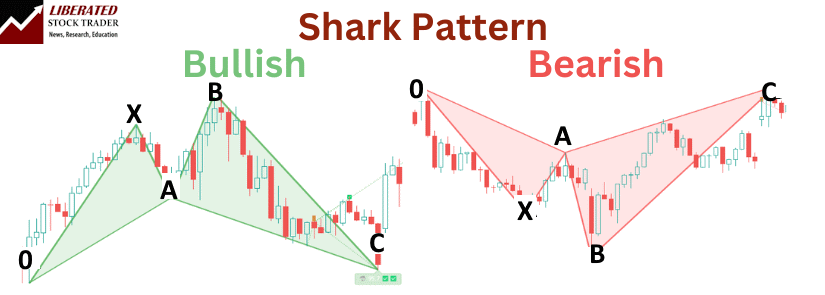
The shark pattern consists of five points labeled O, X, A, B, and C. It mainly predicts trend reversals. Key Fibonacci levels include an 88.6% retracement at point C.
To trade this pattern, I consider entering at point C and setting a stop-loss at point D or the 113% Fibonacci level of the XA leg. Data shows that the bullish shark pattern is profitable, hitting targets 66.75% of the time on the Nasdaq 100 index, with an average gain of +2.94%.
Do Shark Patterns Work?
Yes, bullish shark patterns work well on indices, usually between 54% and 66% of the time. On individual stocks, the profit per trade can vary widely from fractions of a percent to 8% per trade. But avoid trading bearish shark patterns.
Testing the shark on major Forex pairs did yield strong results on some currency pairs and not on others. Average win percentages varied between 45% and 55%, with average returns between 0.1% and 1.2%.
Using the Shark Pattern helps identify potential reversals effectively. Though it is a newer pattern, its precise geometrical and Fibonacci alignments have made it a favored choice in technical analysis trading. By carefully analyzing and applying this pattern, I can enhance my chances of making profitable trades.
2. Cypher Pattern
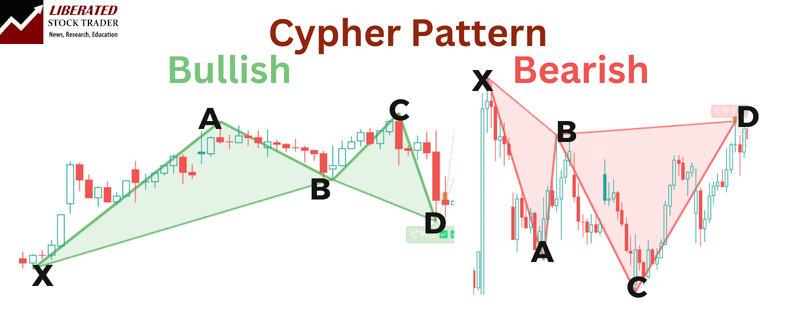
I find the Cypher pattern to be one of the more intriguing harmonic patterns in trading. The cypher pattern indicates potential price reversal zones (PRZ) with four Fibonacci swings labeled X-A, A-B, B-C, and C-D. My testing shows it is profitable in the right conditions.
Smarter Trading with TradingView
Do Cypher Patterns Work?
Yes, cypher patterns work well on major indices, hitting targets 60% of the time and averaging a 2.5% average profit per trade. On individual stocks, the profit per trade can vary widely from +10% to -5% losses.
Testing the cypher on major Forex pairs did yield strong results, with an average win percentage of 53% and an average return between 0.6% and 1.3%.
In my experience, the bullish pattern is more reliable than the bearish version. Research shows that the bullish Cypher hits its target 73% of the time, with an average gain of 5.24% on the Nasdaq 100 index (source).
3. Butterfly Pattern
The butterfly pattern is one of my favorite harmonic patterns. It’s a reversal pattern used to spot potential market turning points. The pattern’s name comes from the shape it forms on the chart, which resembles a butterfly.
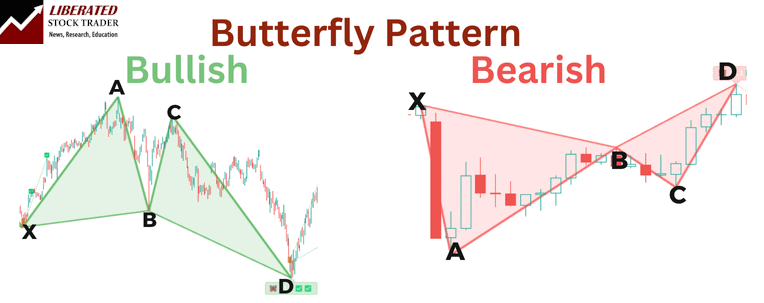
This pattern consists of four price swings: X-A, A-B, B-C, and C-D. Each leg corresponds to specific Fibonacci ratios. Accurate identification of these points is key to successful use.
The bullish butterfly pattern can indicate a strong buying opportunity when it forms at the end of a downtrend. On the other hand, a bearish Butterfly signals a potential selling opportunity at the end of an uptrend.
Do Butterfly Patterns Work?
Yes, bullish Butterfly patterns work, but only between 48% and 80% of the time on individual stocks. The profit per trade can vary widely between stocks, from fractions of a percent to 6 or 7% per trade.
Testing the butterfly on major Forex pairs did not yield strong results, with an average win percentage of 45% and a 0.29% average return.
Backtesting data on the Nasdaq 100 shows that the bullish butterfly pattern has been reliable and profitable over 23 years. This makes it a useful tool for traders looking to identify trend reversals.
Although it appears complex, once you learn to spot the XA, AB, BC, and CD legs, your trading strategy can greatly improve.
Trading Butterfly Patterns: I Test the Best Settings & Strategies
4. Gartley Pattern
The Gartley Pattern is a well-known harmonic pattern in trading. It consists of a five-point structure that helps traders identify potential buy and sell points in various markets.
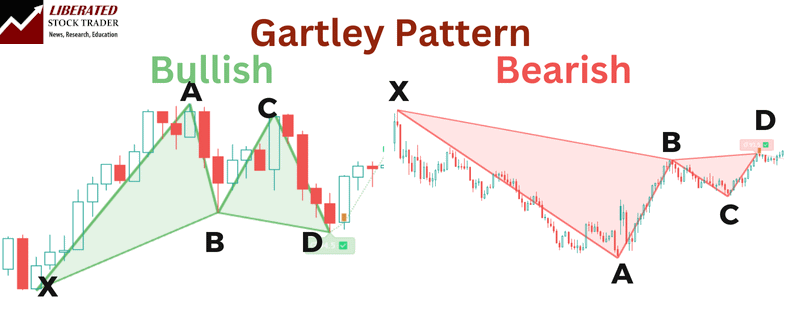
The pattern includes points labeled X, A, B, C, and D. Each point represents a pivot high or low, forming a specific shape. I often look for this pattern to pinpoint potential market reversals.
The Gartley Pattern follows specific Fibonacci ratios. Typically, point B retraces 61.8% of the XA leg. Point C moves from 38.2% to 88.6% of the AB leg. Point D is crucial; it ends around 78.6% of the XA leg.
Knowing the profit targets is important when trading the Gartley pattern. For a bullish Gartley, I aim for the 61.8% to 100% extension of the CD leg. For a bearish pattern, I look in the opposite direction.
Do Gartley Patterns Work?
Yes, Gartley patterns work, but only between 36% and 60% of the time. The profit per trade can vary widely between stocks, from fractions of a percent to 4 or 5% per trade.
However, my backtesting confirms it does not occur very often. Combine that with a low reward-to-risk ratio, and it might be worth avoiding.
Backtesting shows the bullish Gartley pattern hit its targets about 60% of the time, offering decent reliability. Studies reveal varied performance across different stocks, such as a 42% success rate for Tesla.
How to Trade the Gartley Pattern. I Test If It Really Works!
5. Bat Pattern
The Bat Pattern is one of the harmonic patterns discovered by Scott Carney in 2001. It is popular among traders for its precision in identifying potential market reversals.
This pattern has specific Fibonacci retracement levels. The XA wave represents a normal price swing, while the AB wave retraces between 38.2% and 50% of the XA wave. These measurements help pinpoint precise entry and exit points.
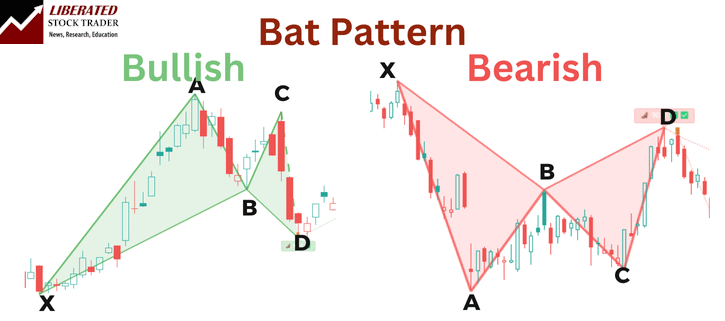
My Bat Pattern’s studies have shown it can achieve its price targets around 66.6% of the time when applied to the Nasdaq 100 over 23 years. This data highlights the pattern’s reliability in real-market conditions.
Using the Bat Pattern requires attention to details, such as exact swing points and retracements. This precision is essential for setting up trades that align with market trends and reversals.
Do Bat Patterns Work?
Yes, Bat patterns work well on indices, but only between 26% and 64% of the time on individual stocks. The profit per trade can vary widely between stocks, from fractions of a percent to 8% per trade.
Testing the bat on major Forex pairs did not yield strong results, with an average win percentage of 45% and an average return between 0.4% and 2%.
In my opinion, the Bat pattern has very mixed results, with some highly profitable trades and some losers. Additionally, it is quite a rare pattern that occurs infrequently in charts.
Try TradingView, Our Recommended Tool for International Traders
Global Community, Charts, Screening, Analysis & Broker Integration
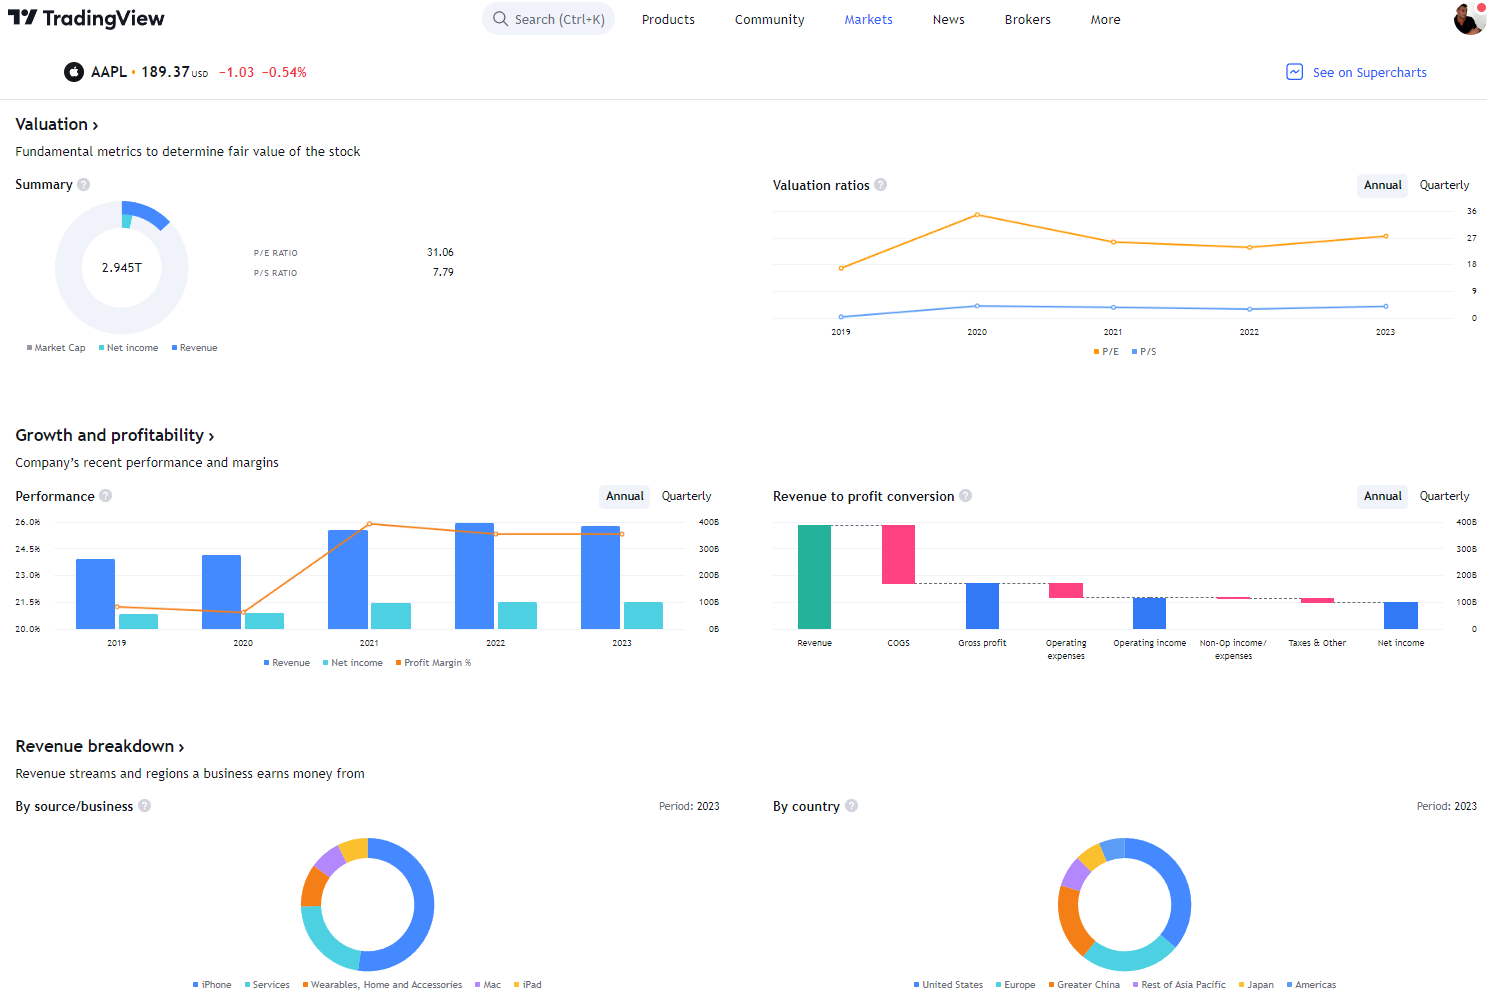
Global Financial Analysis for Free on TradingView
6. Crab Pattern
Traders use the Crab Pattern to spot potential trend reversals, but they probably shouldn’t. The pattern is complex and yields little reward.
The crab is another harmonic pattern identified by Scott Carney in 2000 but not thoroughly tested in his books. This pattern includes specific legs XA, AB, BC, and CD, each with particular retracement and extension levels.
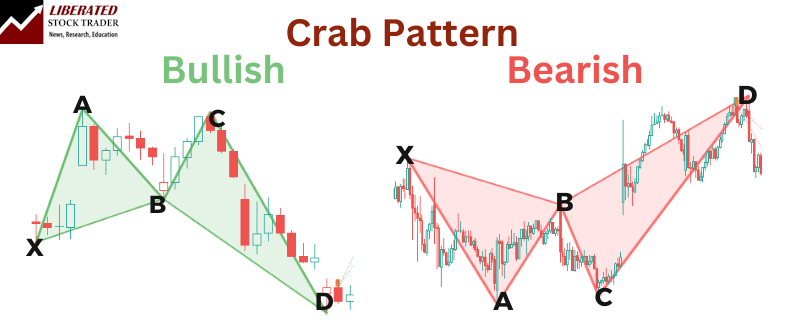
Do Crab Patterns Work?
No, you should avoid trading with the Crab pattern. My testing shows that it occurs infrequently and that when it appears, it is no better than flipping a coin.
Testing the crab on major Forex pairs like the USD/EUR yielded losses, or at best, tiny marginal gains of 0.59% average win on the EUR/USD that make it not worth trading.
Is the Crab Pattern a Good Trade?
No, in my opinion, the crab pattern occurs rarely, and when it provides a signal, it often results in minor losses.
I found that backtested data indicates it might not always be reliable. For instance, the bullish crab appeared just once in 23 years of Nasdaq 100 data. However, knowing its detailed structure can still be beneficial for making well-informed decisions.
FAQ
What is the best trading software for harmonic patterns?
After extensive testing, I personally use TradingView to backtest and trade harmonic patterns. Its custom indicator, Harmonics, automatically detects and backtests all harmonic patterns seamlessly.
What criteria define a reliable harmonic trading pattern?
A reliable harmonic trading pattern has precise symmetry and strict ratio alignments based on Fibonacci numbers. It should clearly follow predefined structural points without much deviation. Patterns like the Gartley Pattern and the Butterfly Pattern are often highlighted for their reliability.
How do harmonic patterns enhance technical analysis in trading?
Harmonic patterns help identify potential reversals and continuations in the market. They offer traders specific entry and exit points. Using patterns like the Cypher Pattern can assist in setting accurate stop-loss levels and profit targets, increasing the precision of trading strategies.
How do you identify harmonic patterns on charts?
I suggest leveraging TradingView to detect harmonic patterns automatically. Manual identification is highly time-consuming and error-prone.
Can you identify the harmonic pattern with the highest success rate?
The harmonic patterns with the highest success rates and average return per trade are the shark, cypher and butterfly. Each pattern is robust and reliable, but you should always test before deploying them.
In what ways can trading with harmonic patterns be profitable?
Trading with specific harmonic patterns can be profitable because they offer high reward-to-risk ratios. For example, the Shark Pattern can provide clear reversal points, allowing for timely market entries and exits. However, some harmonics do not work.
What are the critical rules to follow when identifying harmonic patterns?
When identifying harmonic patterns, follow strict Fibonacci ratio measurements and look for clear pattern formations. Ensure that patterns, such as the Bat Pattern, align perfectly with their respective D points within the correct range. Deviations might render the pattern invalid.
