The Bollinger Bands technical analysis indicator measures volatility and identifies overbought and oversold market conditions. It has three bands, a 20-period SMA, and upper and lower bands plotted two standard deviations away. These bands expand and contract based on price volatility.
Our reliability testing of Bollinger Bands on the S&P 500, using 13,360 years of data, suggests it is an unreliable, unprofitable indicator for traders. However, Bollinger Bands can be profitable, but you need to know how it works, how to trade it, and the optimal settings.
Bollinger Bands are a popular chart indicator for beginner investors, but do they provide traders with valuable buying and selling signals? Our research suggests Bollinger Bands are an unreliable indicator if traded with the default settings.
Are you keen on trading with Bollinger Bands? Dive deep with me and learn how to use them like a pro!
What are Bollinger Bands?
Bollinger Bands are a technical analysis chart indicator designed to show when there is an oversold or overbought condition in the markets. The bands resemble trendlines and consist of three lines; the middle line is a 20-day simple moving average, and the upper and lower lines are two standard deviations +/- the SMA.
How to Use Bollinger Bands?
Bollinger Bands can be used in various ways to identify trading opportunities. Traders often use the distance between the outer bands to measure volatility and look for potential trade entry points. If prices move outside of the indicator’s upper or lower limits, it could signal that the price is either overbought or oversold, and a trader could take advantage of these situations. Additionally, Bollinger Bands can help you identify price action trends and potential support and resistance levels.
Bollinger Bands are usually one of the first indicators beginner traders learn to use, but is it profitable?
Key Takeaways
- Bollinger Bands measure volatility using the standard deviation between the upper and lower bands.
- Bollinger Band trading opportunities can be identified when prices move outside the upper or lower bands.
- Overbought and oversold conditions can be detected and taken advantage of.
- Tuning the standard deviations +/- and the SMA may enhance their accuracy.
- Based on our testing, Bollinger Bands have a low success rate.
- Selecting the right timeframe and settings for Bollinger Bands can be profitable.
How do Bollinger Bands Work?
Bollinger Bands are constructed using a moving average (SMA) and two upper and lower bands. The SMA is usually set to a 20-period simple moving average, although it can be adjusted according to your trading strategy. The upper band is calculated by taking the SMA plus two standard deviations, while the lower band is determined by subtracting two standard deviations from the SMA.
The two standard deviations provide a range that prices rarely move outside of. If the price moves beyond these bands, it is usually a sign of an upcoming trend change or reversal. When the price moves close to either band, this can be seen as an overbought and oversold signal, depending on whether the price is near the upper or lower band. Traders can use Bollinger Bands to trade reversals or continuation patterns depending on the price position relative to the bands.
How to Trade Bollinger Bands
We tested the many ways to trade Bollinger Bands, but the research shows that none are more than 47% successful. This is because Bollinger Bands produce many false signals.
One popular way to trade Bollinger Bands is to buy when the price crosses above the lower band and sell when it crosses below the upper band. This strategy works best in trending markets, as it will help traders capture larger gains from long-term trends.
We independently research and recommend the best products. We also work with partners to negotiate discounts for you and may earn a small fee through our links.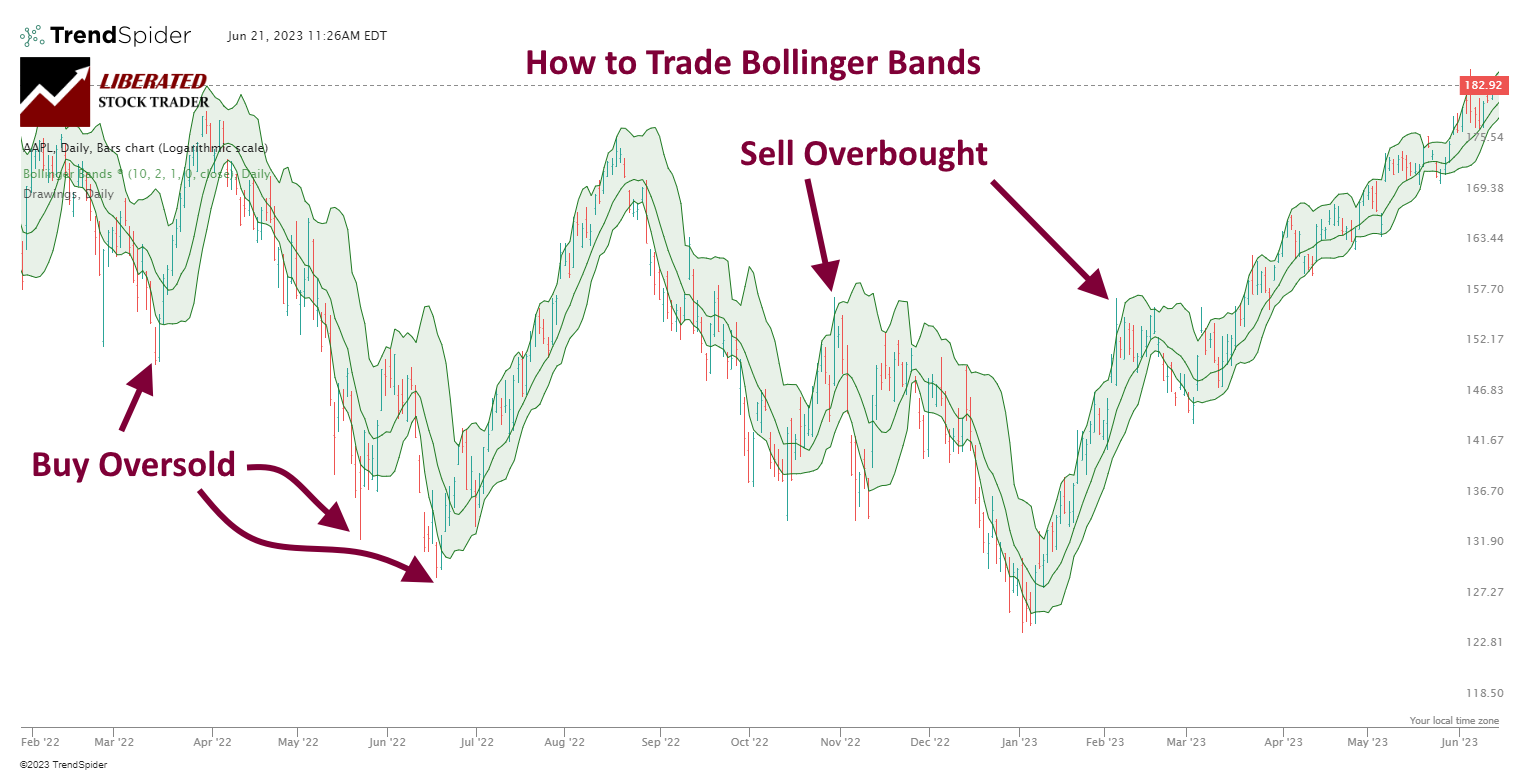
Chart Produced with TrendSpider
How to Read Bollinger Bands
To read Bollinger Bands for a short-term trading strategy, look for breakouts outside the bands. If the price breaks above the upper band, traders can enter a long trade, and if it breaks below the lower band, they can enter a short trade. This strategy is best avoided when markets are ranging or consolidating, as there will be more opportunities for false breakouts and losing trades.
Traders can use Bollinger Bands to identify reversals in the market. If the price touches the lower band and reverses higher, traders can enter a long trade, and if it touches the upper band and reverses lower, they can enter a short trade. This strategy works best when markets are ranging or consolidating – in these conditions, Bollinger Bands act like support and resistance levels.
With this strategy, traders may look for additional signals to confirm the reversal. This could include using other indicators or chart patterns, such as a double bottom or candlestick pattern. Traders should also pay attention to volume when trading with Bollinger Bands – higher volume often confirms a valid reversal signal.
Although these Bollinger Band trading strategies are popular, we could not demonstrate any success with our testing.
But the big question is, are Bollinger Bands’ buy-and-sell signals profitable, like the RSI indicator or Donchian Channels, or are they another chart indicator that does not work, such as moving averages?
Keep reading to find out how to trade Bollinger Bands profitably.
My thorough testing awarded TradingView a stellar 4.8 stars!
With powerful stock chart analysis, pattern recognition, screening, backtesting, and a 20+ million user community, it’s a game-changer for traders.

Whether you're trading in the US or internationally, TradingView is my top pick for its unmatched features and ease of use.
Explore TradingView – Your Gateway to Smarter Trading!
How to Calculate the Bollinger Bands Indicator
Standard Bollinger Bands are calculated by taking a 20-day simple moving average of the current price and adding an upper and lower band offset from the moving average by two standard deviations.
Bollinger Bands Formula
Upper Band = 20-day SMA + 2(20-day standard deviation of price)
Middle Band = 20-day SMA (simple moving average)
Lower Band = 20-day SMA – 2(20-day standard deviation of price)
This means when the current price action is one standard deviation above the middle band, it is said to be overbought. When the current price action is one standard deviation below the middle band, it is considered oversold.
Pros
The Bollinger Bands indicator gives traders a view of the current price action and how volatile the price is. Since standard deviation uses historical data, it can be used to spot potential reversals or breakouts in advance before they occur. Additionally, traders can use this indicator to identify entry and exit points and set stop-loss orders.
Cons
The biggest disadvantage of Bollinger Bands is the number of false signals. Our testing shows that trading any of the three main Bollinger Band strategies resulted in an average success rate of only 33%; this is very poor performance.
Additionally, the Bollinger Bands indicator is a lagging indicator, which means it will only provide signals after the price action has already occurred. This can lead to traders entering and exiting trades too late or missing out on potentially profitable opportunities. Additionally, since the bands consider historical prices, they may not be as effective in markets with high levels of volatility.
How I Set Up Bollinger Bands Backtesting
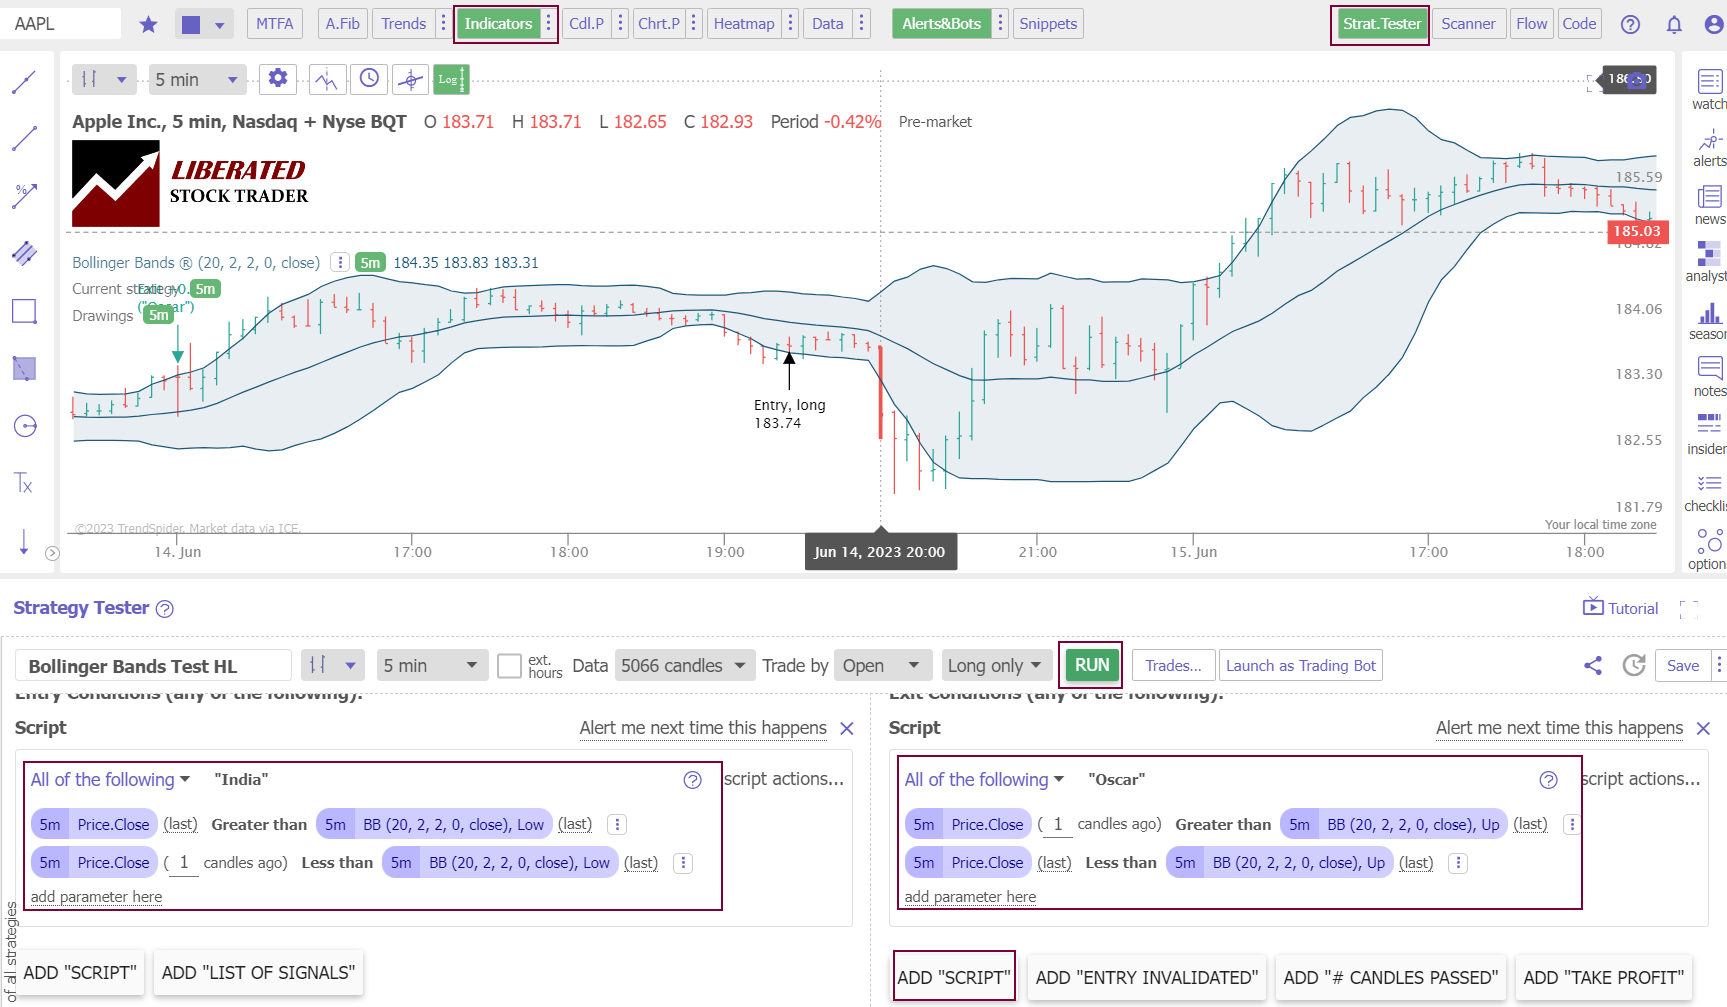
To set up Bollinger Bands backtesting in TrendSpider, follow these steps.
- Register for TrendSpider.
- Buy Signal: Select Strategy Tester > Entry Condition > Add Script > Add Parameter > Condition > Price. Close > Greater than > Bollinger Bands (20,2,2,0 Close), Low.
- Sell Signal: Select > Add Script > Add Parameter > Condition > Price. Close > Greater than > Bollinger Bands (20,2,2,0 Close), Up.
- Finally, click “RUN.”
Backtest Your Strategies on TrendSpider Now
Want to test any indicator, chart pattern, or performance for any US stock? The award-winning TrendSpider software makes it easy! Our Trendspider review unveils insights into discovering the most powerful trading strategy development and testing service.
Bollinger Bands Backtesting Results
I tested the standard settings of Bollinger Bands (20,2,2) on the Dow Jones Industrial Average stocks on four timeframes: 1-minute, 5-minute, 1-hour, and daily charts, and the performance results were poor. On a 1-minute chart, Bollinger Bands produced a 23% success rate, which is very low. On an hourly chart over two years, Bollinger Bands produced a 47% win rate versus a buy-and-hold strategy.
| Bollinger Bands | OHLC Chart | Duration | % Winners | Avg # Trades |
| 20,2,2 | 1-min | 20 Days | 23% | 42 |
| 20,2,2 | 5-min | 60 days | 30% | 26 |
| 10,2,1 | 5-min | 60 days | 37% | 27 |
| 20,2,2 | 1-hour | 2 Years | 47% | 18 |
| 10,2,1 | 1-hour | 2 Years | 27% | 24 |
| 20,2,2 | Daily | 12 Years | 33% | 29 |
| 10,1.5,2 | Daily | 20 Years* | 55% | 102 |
| Average | 36% | 38 |
*20-Year Test S&P 500 Winning Strategy
Testing another Bollinger Bands setting of 10,2,1 also produced low success rates of 37% and 27% and 5-minute and 1-hour charts.
I also tested buying the upper Bollinger Band price breakout and even selling the upper band breakout, but none of the standard strategies were successful.
The Best Bollinger Bands Settings
Our 360 years of TrendSpider backtests conclusively revealed that the best setting for Bollinger Bands is SME 20, with two standard Deviations on a 60-minute chart. This produced a win rate of 47% versus a buy-and-hold strategy. That might not seem like more than a 50-50 chance of success, but the profitable stocks were incredibly successful, and overall, the strategy is successful.
Next, I will show a selection of those successful trades.
Bollinger Bands Test: 60-Minute Chart
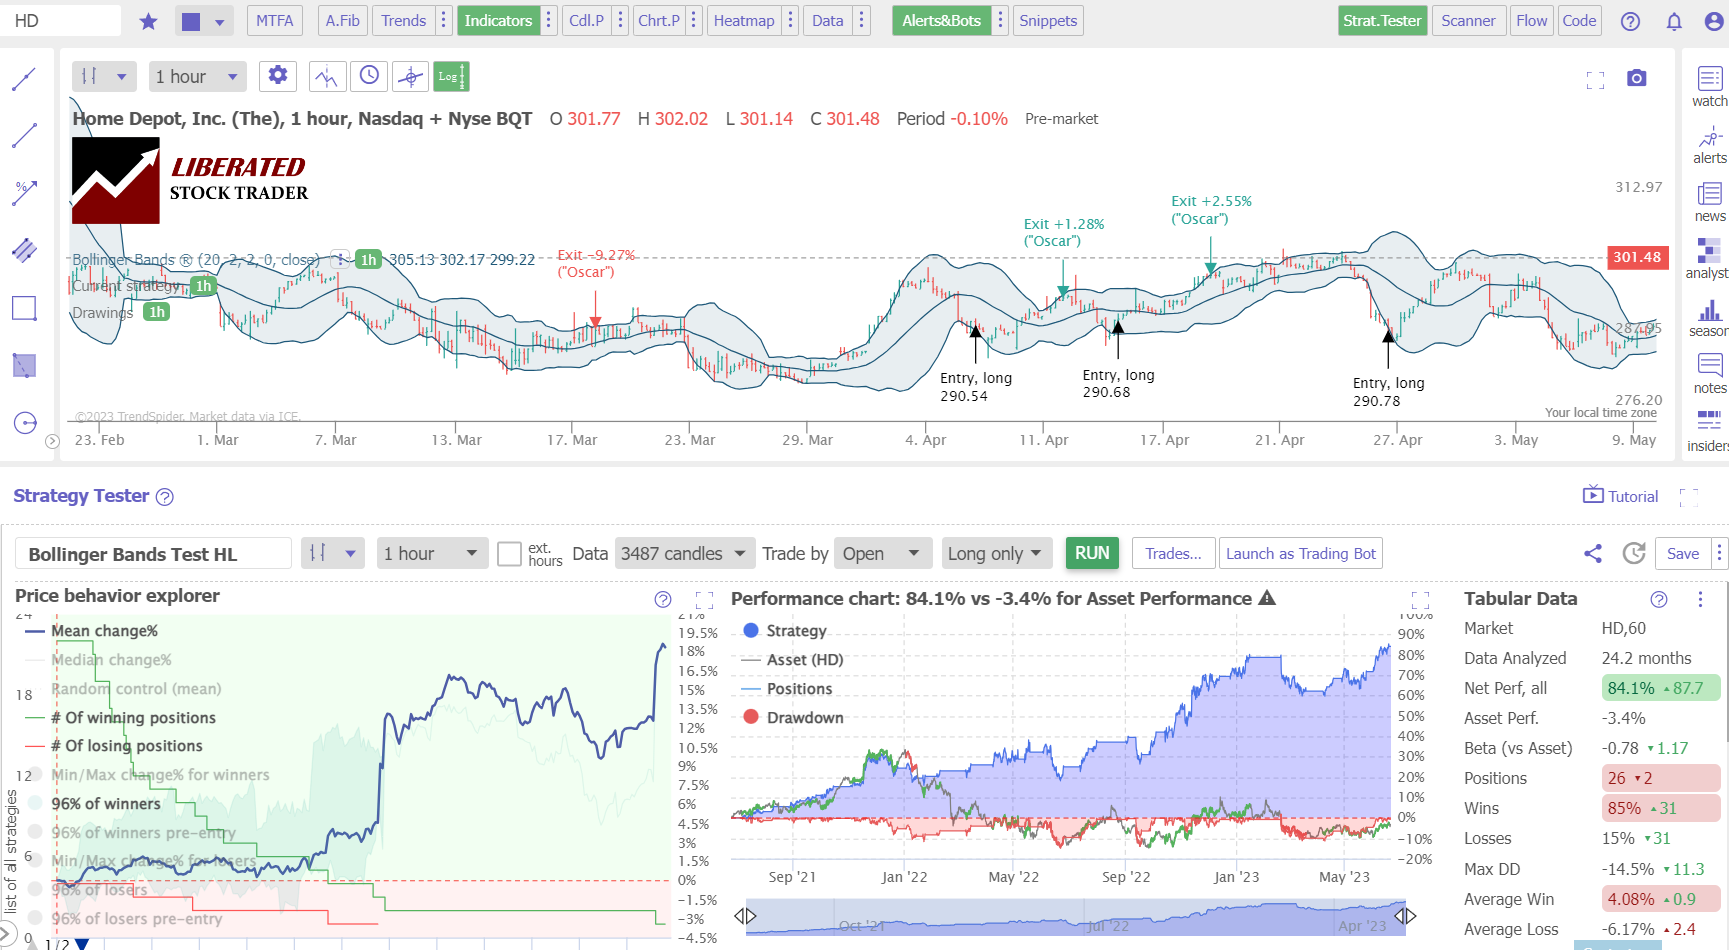
Our testing of Home Depot (Ticker: HD) on a 1-hour chart over two years shows a Bollinger Bands strategy returning a profit of +84.1% versus the buy-and-hold return of -3.4%. There were 26 trades with an 85% Win Rate and an average win of 4.08% versus a loss of -6.17%.
An indicator that enables 85% of trades to be winners is rare, which made Bollinger Bands profitable on this stock. However, 53% of the Dow Jones 30 returned a loss using this strategy.
Backtest Powerful Strategies on TrendSpider Now
Bollinger Band Test on a 1-Minute Day Trading Chart
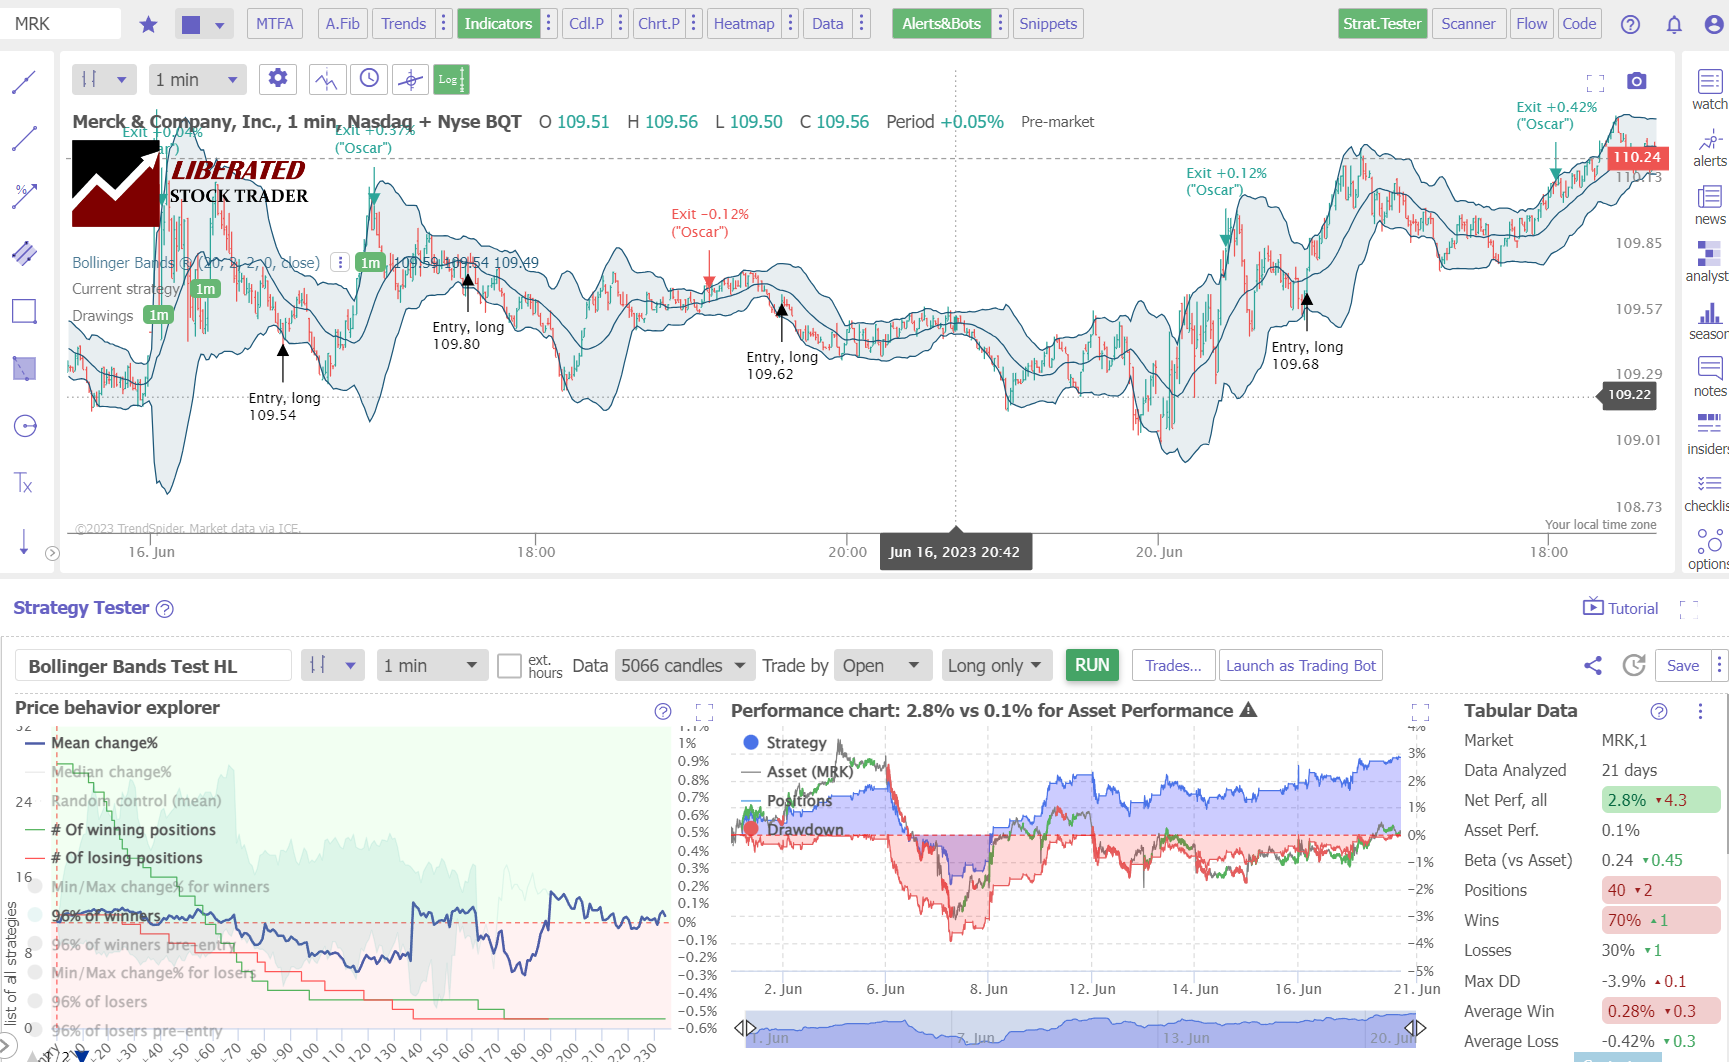
Our testing of Merck. (Ticker: MRK) over 21 days shows the Bollinger Bands strategy returned a profit of +2.8% versus a buy-and-hold return of 0.1%. This is a good return, with 40 trades, 70% of them were profitable, and the average profit was 0.28%
Get Point & Click Backtesting on TrendSpider
While this specific ticker was successful, Bollinger Bands’ overall performance was very poor on a 1-minute chart, with 77% of stocks on the DJ-30 resulting in a loss.
Bollinger Bands Test: Daily Chart
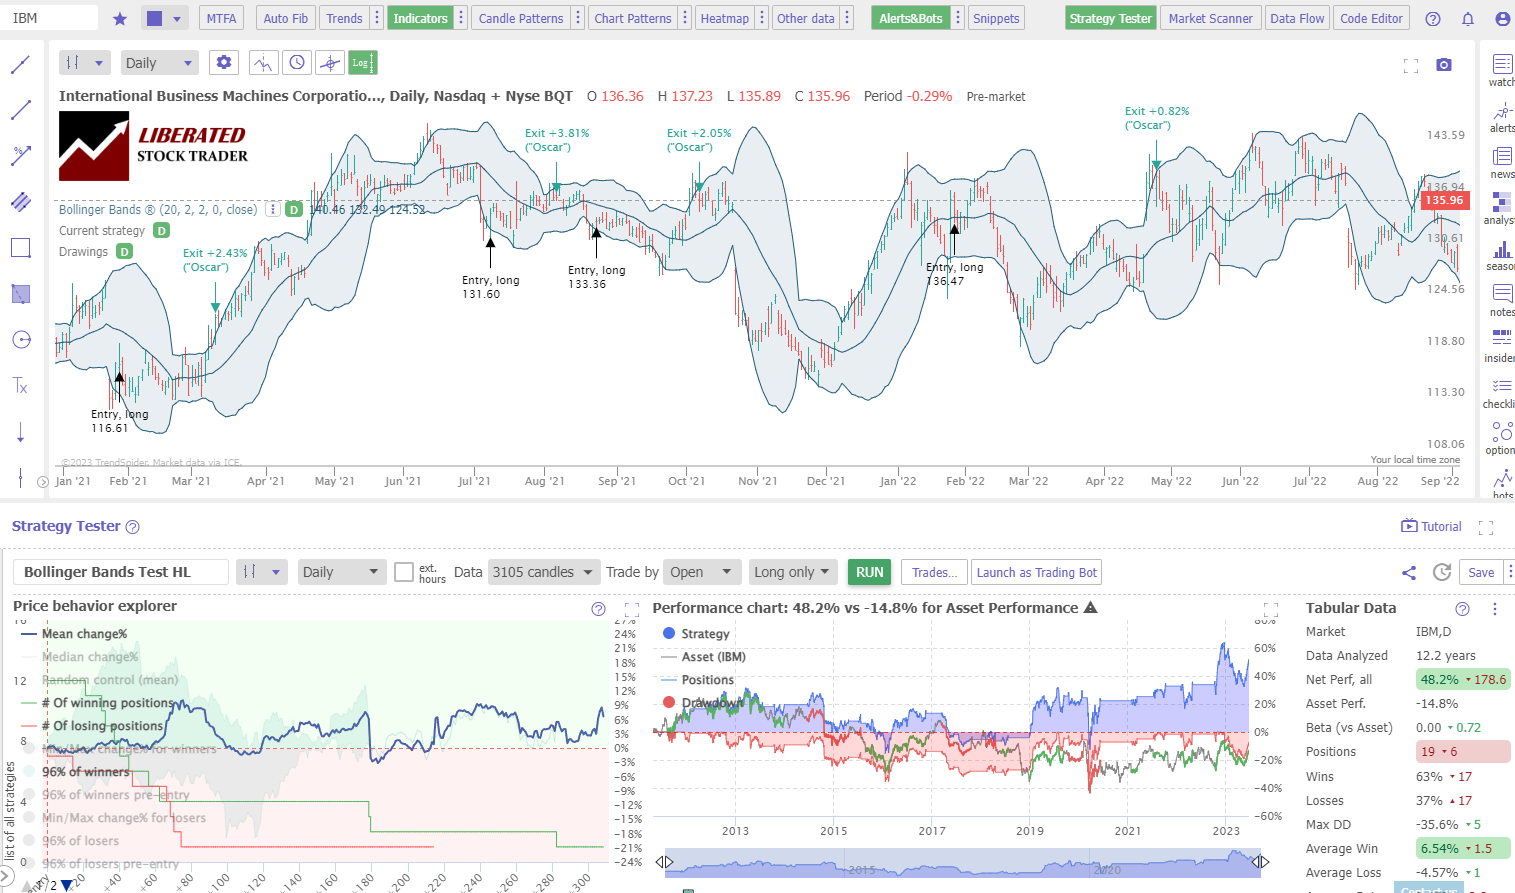
Standard Bollinger Bands setting worked well on IBM, returning 48.2% over 12 years, versus buy and hold return of -14.8%. But again, the strategy failed across the entire DJ-30 Index of stocks with a 67% failure rate, meaning 67% of the stocks trading with Bollinger Bands failed to beat the underlying asset’s performance.
A Winning Strategy
After weeks of testing, I found a winning Bollinger Band trading strategy. It outperformed the S&P 500 by 211% over 20 years, with 55% of successful trades and a yearly growth rate of 12.73%. The strategy and performance results are explained below.
Profitable Bollinger Bands Settings
According to our testing, the only way to trade Bollinger Bands successfully is to use settings (10, 1.5, 2) and buy when the lower band exceeds the price. This means using a 10-day simple moving average and a 1.5 and 2 standard deviation for the upper and lower bands.
When this trade is open, the only way to profit is to set a 5% rolling stop-loss. Using Bollinger Bands for a profitable trade exit is extremely difficult and only results in losses.
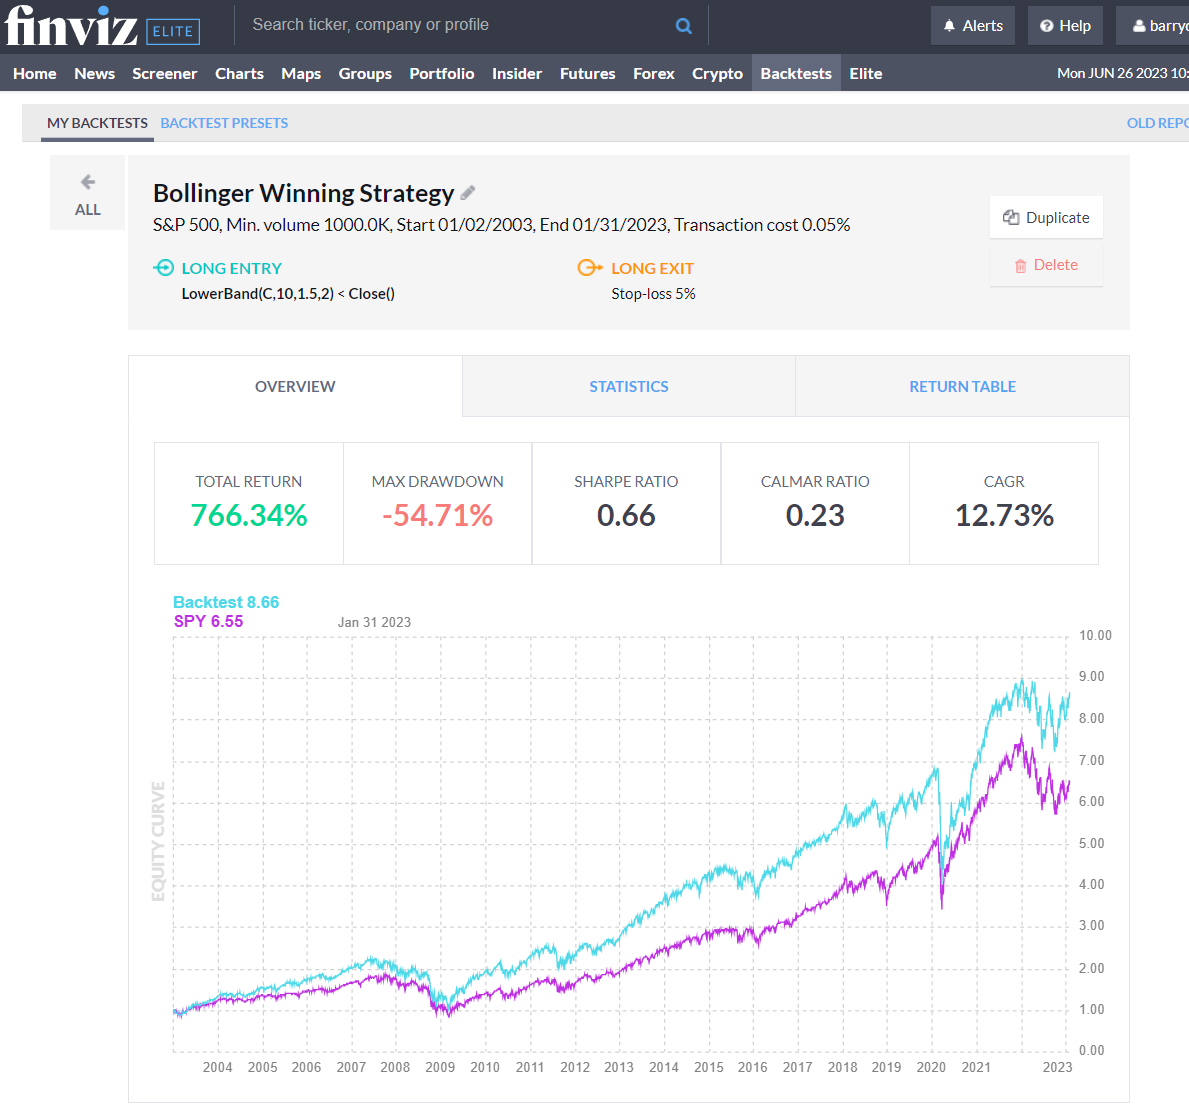
To test the Bollinger Bands on the 500 largest US stocks in the S&P 500, I used the excellent backtesting solution provided by FinViz Elite. Finviz’s point-and-click backtesting engine allowed me to test Bollinger Bands-14 on a daily chart over the previous 20 years. Here are the results.
Profitable Bollinger Bands Strategy Results
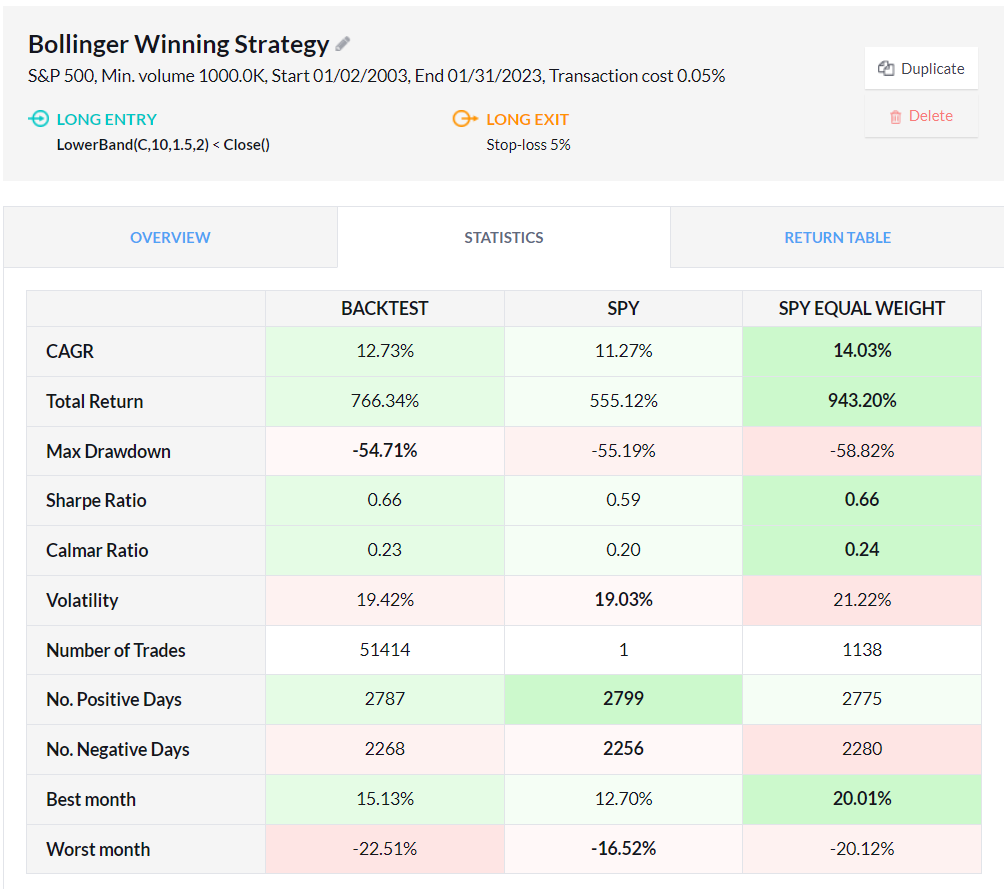
Bollinger Bands outperformed the S&P 500 stocks over 20 years, making a total return of 766% versus a buy-and-hold strategy profit of 555%. There were 51,414 trades, and 55% of trading days were winners.
Over 20 years, Bollinger Bands has produced 211% more profit than a buy-and-hold strategy, which makes this Bollinger Bands strategy the best I have tested.
Get FinViz Elite Backtesting & Screening
While this specific Bollinger Bands strategy was successful, most configurations failed badly. I prefer using a better-performing indicator, such as the Money Flow Index.
Backtest Bollinger Bands Using FinViz Elite.
To set up a profitable Bollinger Bands backtest, follow these five steps:
- Register for FINVIZ ELITE
- Select Backtests > Index=S&P500 >
- Choose Long Entry When > Indicator > Bollinger Bands LowerBand < Close
- Select Long Exit = Stop-Loss 5%
- Finally, click “Run Backtest.”
Combining Bollinger Bands with Other Indicators
Bollinger Bands can be combined with other technical indicators for a more profitable trading strategy. For example, using the MACD or Moving Average Convergence Divergence indicator, you can set up a strategy that buys when the Bollinger Bands reaches positive values. At the same time, the MACD crosses above its signal line. Additionally, you can use the MACD’s Histogram to signal when a trade should be exited. Alternatively, combine the Bollinger Bands with the Price Rate of Change, Money Flow Index, or bullish chart patterns.
To test whether combining Bollinger Bands with other indicators is profitable, I suggest using TrendSpider, our recommended stock research, and AI-powered trading software.
Can Bollinger Bands be used for Buy and Sell Signals?
Yes, Bollinger Bands can be used for buy and sell signals. However, our 20-year test on the S&P 500 suggests Bollinger Bands should only be used for a buy signal on a daily chart with a simple moving overage of 10 and a standard deviation of 2. This generates a market-beating 766% profit versus an index investing return of 555%.
Should You Use the Bollinger Bands?
No, our testing shows that Bollinger Bands is an unreliable indicator, using standard settings on all timeframes, from 1-minute to daily charts. Bollinger Bands only has a 33% success rate across the Dow Jones 30 stocks.
Are Bollinger Bands Accurate?
No, overall, Bollinger Bands are not accurate using the standard configuration, with a 67% failure rate across the 30 Dow Jones stocks. Using Bollinger Bands with an SMA 10 and only using it as a buy signal when the price crosses the lower band improves accuracy to 55%.
Limitations of Using Bollinger Bands
According to our testing, Bollinger Bands used in isolation perform poorly, so you should combine them with different chart patterns and indicators. This will help you avoid more false signals and larger losses.
Disclaimer: Trading involves a substantial risk of loss and is unsuitable for all investors. Past performance is not indicative of future results.
Are Bollinger Bands Reliable?
No, Bollinger Bands are unreliable for buying and selling signals using the standard settings (20,2,2). Our testing shows that Bollinger Bands used with standard settings on 1- and 5-minute charts have only a 27% reliability.
Summary
After testing three strategies across 13,360 years of data, we confirm Bollinger Bands are generally a losing trading strategy. Use this indicator only on daily charts, using the 10,2,2 settings, buying when the price crosses above the lower band, and selling on a 5% rolling stop-loss to improve your chances of trading profitability up to 55%.
I have researched and tested many technical analysis indicators, and many indicators, such as moving averages and Bollinger Bands, underperform.
We have shown the Bollinger Bands can be tuned into a successful tool for traders looking to enhance their trading strategies. Its accuracy and ability to produce strong buy signals can make it a valuable addition to any investor’s toolkit, but avoid it for sell signals.
FAQ
Are Bollinger Bands good for trading?
No, our research shows that Bollinger Bands is a poor indicator on all timeframes from 1 minute to daily charts. Bollinger Bands produced a weak 33% average success rate versus a long-term buy-and-hold strategy. Our 12-year tests of the 30 Dow Jones Industrial Average stocks prove Bollinger Bands should be avoided.
What is the best setting for Bollinger Bands?
Our testing shows that the best setting for Bollinger Bands is 10,2,2 on an OHLC daily chart which yields a 55% win rate. Using this setting, use Bollinger Bands only for buy signals when the price crosses up through the lower band. On all other timeframes, Bollinger Bands underperformed the average stock market returns.
What indicators are better than Bollinger Bands?
Bollinger Bands is an unprofitable indicator, but others have higher success rates, such as Heikin Ashi charts, combined with the rate of change, RSI, and bullish chart patterns. Our testing has proven these indicators to be more effective, work on many timeframes, and are more successful in trading strategies.
Is Bollinger Bands the best indicator?
No, Bollinger Bands is a poor indicator for trading, with a 67 percent failure rate; bullish chart patterns such as the Double Bottom have an 88 percent success rate. I recommend learning to backtest and fine-tune your trading strategies.
What is the best timeframe for Bollinger Bands?
The best timeframe for Bollinger Bands is on an hourly chart or daily chart. Hourly charts produce a 47% success rate, and a daily chart, defined in our Winning Bollinger Bands strategy, produced a 55% success rate.
How reliable are Bollinger Bands?
Bollinger Bands is an unreliable technical analysis chart indicator. Our 60 years of backtested data on 30 major US stocks show a 33% chance of beating a buy-and-hold strategy across all chart timeframes.
What is the best software for trading and testing Bollinger Bands?
When conducting our in-depth Bollinger Bands trading analysis, we relied on TrendSpider - an industry-leading trading tool for backtesting and strategy development. I was impressed by its power and simplicity!
Which is better, Bollinger Bands or Moving Averages?
Bollinger Bands' low average success rate of 33% is still better than the moving average performance of 10% on standard OHLC charts based on 5,640 years of backtested exchange data. Our research indicates that an exponential moving average of 20 on a Heikin Ashi chart outperforms Bollinger Bands with an 83% success rate.
How to read the Bollinger Bands chart?
To read a Bollinger Bands chart, look at the price action in relation to the upper and lower bands. If the price is closed above the upper band, it indicates an overbought condition. Conversely, if the price closes below the lower band, it signals an oversold condition. It's also important to note that when prices hit either of these bands, they are likely to reverse direction.
What is the best software for trading Bollinger Bands indicators?
TrendSpider is hands-down the top software for trading and backtesting Bollinger Bands; with point-and-click backtesting requiring no coding, it's my go-to software! TradingView is also good, offing pine code backtesting and global stock exchange, crypto, and forex coverage.
Is Bollinger Bands the same as Stochastics?
No, Bollinger Bands and Stochastics are two different indicators. Bollinger Bands measure volatility using upper and lower bands around a moving average. Stochastics is an oscillator that measures momentum and helps identify overbought or oversold conditions. Both are tools for technical analysis, but they have distinct differences.
Do Bollinger Bands work?
Yes, Bollinger Bands works reasonably well, but only with a specific configuration using SMA 10 and two standard deviations on a daily chart. This setup is tested to have a 55% success rate and outperforms the S&P 500 stocks. All other standard settings on OHLC/ candlestick charts are not profitable.
How accurate are Bollinger Bands?
Bollinger Bands is inaccurate, especially with a standard OHLC, line, or candlestick chart. Our research indicates that Bollinger Bands has a 33 percent average win rate. The rate of change indicator on a Heikin Ashi chart is more effective at 66 percent.
How to make money trading Bollinger Bands?
Making money using the Bollinger Bands is difficult. However, it is possible. The best way to succeed with Bollinger Bands is by using a specific setup tested for higher reliability. This involves using the settings detailed in our Winning Bollinger Bands Settings section.
Is Bollinger Bands effective for day trading?
No, standard Bollinger Bands are not effective for day trading. Our test results on 1-minute charts show a low success rate of 23 percent, and a 5-minute chart had a 30 percent success rate. You can develop, fine-tune and test your unique day trading Bollinger Bands strategy by backtesting.
You want to be a successful stock investor but don’t know where to start.
Learning stock market investing on your own can be overwhelming. There’s so much information out there, and it’s hard to know what’s true and what’s not.
Liberated Stock Trader Pro Investing Course
Our pro investing classes are the perfect way to learn stock investing. You will learn everything you need to know about financial analysis, charts, stock screening, and portfolio building so you can start building wealth today.
★ 16 Hours of Video Lessons + eBook ★
★ Complete Financial Analysis Lessons ★
★ 6 Proven Investing Strategies ★
★ Professional Grade Stock Chart Analysis Classes ★

