★ Chart Pattern Research & Guides ★
- 22 Proven Stock Chart Price Patterns
- 10 Accurate Bullish Chart Patterns
- 1. Cup & Handle (95%)
- 2. Inverse Head & Shoulders (89%)
- 3. Double Bottom (88%)
- 4. Triple Bottom (87%)
- 5. Descending Triangle (87%)
- 6. Rectangle Bottom (85%)
- 7. Bull Flag (84%)
- 8. Ascending Triangle (83%)
- 9. Rising Wedge (81%)
- 9. Falling Wedge (74%)
- 10. Bull Pennant (54%)
- Bonus Indicator: The Wyckoff Method
- 8 Accurate Bearish Chart Patterns
- Top 6 Profitable Harmonic Patterns
- Candlestick Patterns Guide
- 10 Profitable Candle Patterns Tested
- 1. Inverted Hammer (60%)
- 2. Shooting Star (57.1)
- 3. Gravestone Doji (57%)
- 4. Bearish Engulfing (57%)
- 5. Bearish Harami Cross (57%)
- 6. Marubozu (56.1)
- 7. Spinning Top (55.9%)
- 8. Doji (55.6%)
- 9. Bullish Harami Cross (55.3%)
- 10. Dragonfly Doji (55.3%)
- 11. Bullish Engulfing (55%)
- 12. Hammer (52.1%)
- 13. Tweezer Top (44%)
- Next Section – Trading Guides >>
Chart Pattern Research
Chart patterns are visual cues that traders use when analyzing stock prices. They’re important because they can indicate what might happen in the future.
We publish original research on important stock chart patterns, success rates, reliability, and profitability so that you can trade better.
12 Accurate Chart Patterns Proven Profitable & Reliable
Research shows that the most reliable chart patterns are the Head and Shoulders, with an 89% success rate, the Double Bottom (88%), and the Triple Bottom and Descending Triangle (87%). The Rectangle Top is the most profitable, with an average win of 51%, followed by the Rectangle Bottom with 48%.
22 Best Stock Chart Patterns Proven Reliable By Data Testing
Published research shows the most reliable and profitable stock chart patterns are the inverse head and shoulders, double bottom, triple bottom, and descending triangle. Each has a proven success rate of over 85%, with an average gain of 43%.
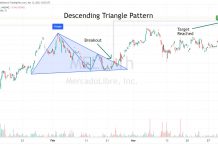
How to Trade a Descending Triangle’s 87% Success Rate
Twenty years of trading research show the descending triangle pattern has an 87% success rate in bull markets and an average profit potential of +38%.
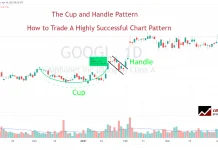
How to Trade a Cup and Handle’s 95% Reliability & 54% Profit
Twenty years of trading research show that the cup and handle pattern has a 95% success rate in bull markets and returns an average profit of +54%.
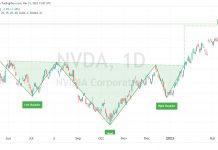
How to Trade the Inverse Head & Shoulders with 89% Accuracy
The inverse head and shoulders pattern is one of the most accurate technical analysis reversal patterns, with a reliability of 89%. It occurs when the price hits new lows on three separate occasions, with two lows forming the shoulders and the central trough forming the head.
Top 10 Best Bullish Patterns Tested & Proven Reliable
My research shows the most reliable and accurate bullish patterns are the cup-and-handle, with a 95% bullish success rate, head-and-shoulders (89%), double-bottom (88%), and triple-bottom (87%).


