103-10 – 5 Important Stock Chart Indicators
The most popular and important stock chart indicators are moving averages, rate of change, relative strength, MACD, and stochastic. Using these indicators can provide insights into stock price trends and direction.
103-23 Fibonacci Trading: Using Fibonacci Strategy in Stocks
The Fibonacci sequence is a series of numbers that describe the natural world and are used in technical analysis to plot stock chart patterns. Italian mathematician Leonardo Pisano Fibonacci (1170-1250) introduced the Fibonacci sequence to the Western world, and his work was adopted by financial traders in the late 19th century.
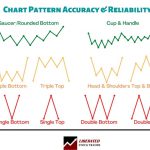
103-20 Do Chart Patterns Work? The Truth About Accuracy & Reliability
Chart patterns in technical analysis can be reliable and accurate, but they never work 100% of the time. Undoubtedly, stock chart patterns are a...
103-19 Understanding Stock Chart Patterns
The importance of the head and shoulders pattern should not be under-estimated—one of the most reliable patterns in technical analysis, yet one of the most misunderstood.
103-15 RSI Indicator: How To Use RSI To Improve Your Stock Trading
RSI, or Relative Strength Index, is a momentum oscillator that measures the speed and change of asset price movements. Used correctly, RSI can dramatically improve your stock trading results with its 53% win rate and 61% average winning trades.
103-14 Stochastic indicator: Using stochastics in stock trading
The stochastic indicator is a momentum indicator that measures the strength of recent price movements to identify possible overbought or oversold conditions in the market. The indicator is based on the premise that prices tend to close near the highs in an up-trending market and near the lows in a down-trending market.
103-13 MACD Explained: What Is MACD & How To Use It For Trading?
The MACD indicator is a technical analysis tool that is used to identify trend reversals and to measure the strength of a trend. It can be used on all time frames, from intraday to long-term charts.
103-12 Volume – An Important Stock Chart Indicator
What is volume in stock charts?
Volume is the number of securities traded within a certain time frame. It is usually represented by the size...
103-22 What Are Gaps in Stock Charts & How To Trade Them?
Gaps in stock charts are an incredibly predictive way to assess the possible direction of stock prices. Gaps show extreme fear or greed in investor sentiment and provide a unique buying or selling opportunity.
103-09 Ichimoku Cloud Trading Strategy
Ichimoku clouds are a technical analysis tool used in stock trading and other investment fields. The clouds are composed of five lines that can be used to identify current trends, support and resistance levels, and price targets.
103-21 What are chart continuation patterns and how do they work?
There are two types of continuation patterns: bullish and bearish. Bullish continuation patterns occur when the market is trending upwards, while bearish continuation patterns happen when the market is trending downwards.
103-08 Elliott Wave Theory
Elliott Wave Theory is a way of predicting the movement of the stock market. It says that prices move in waves, and by understanding these waves you can better predict where prices are going to go.
103-06 How To Do Stock Market Trend Analysis
Stock market trend analysis is the application of mathematics and charts, to imply a historic trend and potential future probability of the trend's direction.
103-05 How to Read & Understand Stock Charts
Reading stock charts may seem daunting at first, but with a little practice, it can be an incredibly useful tool for investors. By understanding the basics of how to read and interpret stock charts, you can gain valuable insight into a company's financial health and performance.
103-04 Advanced Stock Charts Used By Pros
There are a few other types of charts that you probably have never heard of before. They are very useful; you would be required...
103-03 How to Use Volume Stock Charts
Volume is the number of securities traded within a certain time frame. It is usually represented by the size of the bars on a...
103-02 – The 4 Basic Types of Stock Chart
There is more than one way to skin a cat, goes the old saying; quite why someone would want to skin a cat is...
103-01 What is technical analysis of stocks?
Stock Market Technical Analysis is the study of supply and demand in the stock market, by comparing the history of stock price movements & volume.
103-11 Moving Averages: How to Use & Calculate Moving Averages
Moving average indicators are used to automatically plot a moving trendline on a chart, which enables the analysis of stock trends and direction. Moving averages are a simple and popular stock chart indicator.
103-16 ROC Indicator: How to use Rate of Change in Stock Trading
The Rate of Change (ROC) indicator is a technical momentum oscillator that measures the percentage change in price between two points in time. The ROC indicator can be used to identify overbought and oversold conditions and trend reversals.


