5 Moving Average Indicators Tested on 43,770 Trades
The best moving average settings are SMA or EMA 20 on a daily chart, which achieves a 23% win rate. At settings 50, 100, and 200, it is better to use the Hull moving average, which has win rates of 27%, 10%, and 17%, respectively.
What is EMA? Best Exponential Moving Average Settings Tested
An exponential moving average (EMA) technical indicator reduces the lag associated with simple moving averages (SMA) by applying a multiplier to the most recent data. EMAs provide improved sensitivity, enhancing the accuracy of trend analysis.
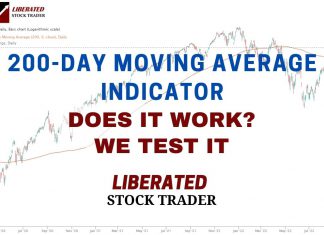
Is the S&P 500 200-Day Moving Average Profitable? I Test It!
Our testing of the 200-day MA on the S&P500 over 16 years revealed that using this indicator is a losing proposition. A buy-and-hold strategy made a profit of 192% vs. the 200-day MA, which made only 152%.
Simple Moving Average Trading Settings & Strategy Tested
The simple moving average (SMA) technical analysis indicator helps identify stock price trends. It calculates an arithmetic average of prices, offering a smooth line that eliminates short-term price volatility.
How to Trade a Falling Wedge: A 74% Chance of a...
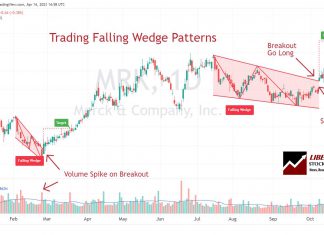
A falling wedge is a technical analysis pattern with a predictive accuracy of 74%. The pattern can break out up or down but is primarily considered bullish, rising 68% of the time.
How to Identify & Trade Seasonal Trends in Financial Markets
Seasonal trends refer to certain sectors, like retail, which often perform better during holiday seasons, while agricultural products might see spikes during harvest times.
Using Seasonality Stock Charts to Improve Market Timing
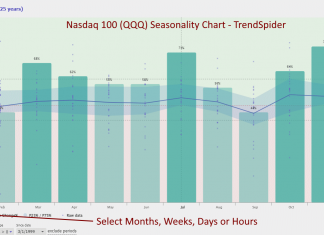
Seasonality charts provide predictable patterns that stocks follow during specific days, weeks, and months of the year. These trends are influenced by recurring events or cycles.
How to Trade Market Sentiment Using Live Chart Examples
Successful traders use market sentiment to gain a competitive edge and improve their chances of making profitable trades.
5 Keys to Master Stock Market Trend Analysis for Investors
Professional analysts define all stock market trends using timeframe and direction: Timeframes are short-term, medium-term, and long-term. Direction is described using uptrend, downtrend, or consolidation.
Our Epic 14-Video Guide to Technical Analysis for Traders
Our ultimate guide to technical analysis, with its 14 videos and detailed examples covering charts, trends, indicators, patterns, and tools, will fast-track your knowledge.
Revealed: Top Price Action Trading Indicators, Patterns & Setups
Price action trading is a method of day trading that relies on technical analysis but ignores conventional fundamental indicators, focusing instead on the movement of prices.
12 Proven Ways to Trade Stock Chart Indicators Profitably
Professional market analysts build effective trading strategies using techniques such as indicator divergences, multi-time frame analysis, indicator combinations, and rigorous backtesting.
KDJ Indicator Explained: Best Settings & Strategy Tested
The KDJ is a stochastic oscillating technical analysis indicator that helps traders predict price reversals. According to our research, the KDJ has a 63% success rate if configured correctly.
Top 4 Best Momentum Indicators Explained & Tested
In technical analysis, momentum indicators help traders identify the strength and direction of a stock's price. We explain and test three popular momentum indicators for reliability.
11 Accurate Day Trading Indicators Tested & Proven with Data
Our research on 10,400 years of exchange data shows the best day trading indicators are the Price Rate of Change, VWAP, Weighted Moving Average, Hull Moving Average, Simple Moving Average, and RSI.
12 Accurate Chart Patterns Proven Profitable & Reliable
Research shows that the most reliable chart patterns are the Head and Shoulders, with an 89% success rate, the Double Bottom (88%), and the Triple Bottom and Descending Triangle (87%). The Rectangle Top is the most profitable, with an average win of 51%, followed by the Rectangle Bottom with 48%.
A Market Analyst’s Guide to Stock Volume Indicator Trading
Stock volume measures the number of shares traded and indicates market strength. Rising markets with increasing volume are viewed as bullish, and falling prices on higher volume are bearish.
LiberatedStockTrader’s Guide to Backtesting Trading Strategies
Experienced investors backtest their trading strategies to optimize their portfolios. Backtesting is a critical step that enables traders to assess the potential viability of a trading strategy by applying it to historical data.
6 Principles of Dow Theory Explained by LiberatedStockTrader
Dow theory's six principles underpin technical analysis: The market discounts everything; it has three trends and phases; the averages must confirm each other; volume confirms the trend and a trend continues until it reverses.
Donchian Channels Indicator Explained & Profitability Tested
The Donchian Channels indicator in technical analysis helps traders understand market trends and potential price breakouts. It consists of three lines formed by taking the highest and lowest low of a predetermined number of periods, typically 20.


