Top Bearish Chart Patterns Video
Decades of research have proven the most predictable bearish patterns are the inverted cup-and-handle, with an average price decrease of 17%, the rectangle top (-16%), head-and-shoulders (-16%), and the descending...
Top Stock Chart Patterns for Traders Video
Research indicates that the most reliable and profitable stock chart patterns include the inverse head and shoulders, double bottom, triple bottom, and descending triangle....
10 Bullish Chart Patterns Video: Verified By Testing
Research shows the most reliable and accurate bullish patterns are the cup-and-handle, with a 95% bullish success rate, head-and-shoulders (89%), double-bottom (88%), and triple-bottom (87%).
Drawing Trendlines Video: How to Get It Right
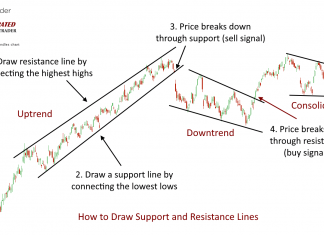
Trendlines visually represent the market's trend direction. They are created by connecting two or more significant highs or lows on a stock chart, forming a diagonal line that reflects the asset's general price movement.
Free Video Library: Stock Chart Analysis
Our video library of chart types and analysis techniques contain original research into their accuracy and profitability. Its a valuable resource for investors and traders.
Wyckoff Method Video: Understanding Market Lifecycles
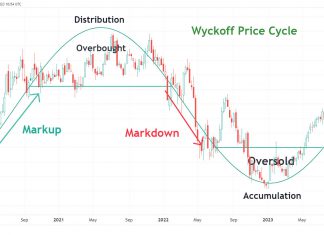
The Wyckoff Method offers a thorough approach to stock market analysis, and it has stood the test of time as a fundamental aspect of technical analysis. Wyckoff's strategy centers on the concept of market cycles, comprising the phases of accumulation, markup, distribution, and markdown.
KDJ Indicator Video: How to Trade It Based on The Data
My comprehensive research highlights that the KDJ can be highly effective, boasting a 63% success rate when properly configured.
Hull Moving Average Video: Is It The Best Indicator?
Our research shows the Hull Moving Average surpasses other moving averages. It is considered an enhancement over traditional moving averages, and our tests indicate it offers slightly better performance.
Weighted Moving Average Video: Is it Worth Trading?
My research indicates that the WMA performs poorly compared to other moving averages, achieving only a 7% win rate on a standard OHLC chart....
Parabolic SAR Video: How to Trade It Based on Data
I conducted a comprehensive backtest on seven Parabolic SAR trading setups, ranging from 1-minute to daily charts, across the DJ30 stocks over 12 years....
RSI Indicator Video: Settings & Strategy Explained
I conducted a backtest of four RSI trading setups on charts ranging from 1-minute to daily intervals across the DJ30 stocks, spanning from 1 month to 27 years, resulting in over 820 years of testing data.
Simple Moving Average Video: Indicator Trading & Testing
But does the SMA truly work? Is it a trustworthy and profitable tool for traders? To answer these questions, I conducted a backtest of 960 years of data, encompassing 68,040 trades.
Exponential Moving Average Video Lesson: How to Trade It
This video lesson delves into trading with the exponential moving average (EMA). An exponential moving average (EMA) is a trend-following indicator that tracks the average price of an asset over a given period.
MACD Indicator Video: Shocking Performance Data
The Moving Average Convergence Divergence (MACD) is a widely used tool in technical analysis, yet it frequently falls short of expectations. Many traders mistakenly believe this indicator guarantees profits.
Rate of Change Indicator Video: How to Trade the ROC
The Rate of Change is a momentum indicator that evaluates the speed and direction of asset price movements. It aids traders in discerning whether a security is trending and the velocity of its price changes.
Ichimoku Cloud Video: How to Trade this Indicator?
I performed a backtest of the Ichimoku Cloud strategy on the DJ-30 Index stocks over a 20-year period, equating to 600 years of data and 15,024 trades.
Money Flow: Video Guide to This Profitable Indicator
My extensive testing has demonstrated the profitability of the Money Flow Index. Over 26 years, it significantly outperformed S&P 500 stocks, achieving a total return of 1,690%, compared to an 881% gain from a simple buy-and-hold strategy.
Aroon Indicator Video Lesson? How to Trade It?
This video lesson explores trading using the Aroon indicator. In technical analysis, the Aroon indicator detects trend reversals and assesses trend strength.
Stochastic Oscillator Video Lesson: Testing & Trading
Through extensive backtesting of the Stochastic Oscillator on 1, 5, and 60-minute as well as daily charts for DJ30 stocks over 12 years—amounting to...
CCI Indicator Video: It is Worth Trading?
My evaluation of the CCI's reliability involved analyzing 530 DJ30 and S&P 500 stocks using 10,600 years of data. After extensive testing, I confirm...


