Bollinger Bands Video: It is Profitable?
My extensive analysis of Bollinger Bands on the S&P 500, covering 13,360 years of data, indicates it is generally an unreliable and unprofitable tool...
Video: Testing the 200-Day Moving Average
This video lesson delves into trading the 200-day moving average. The 200-day moving average is a key long-term chart indicator used to evaluate a stock's trend.
How to Trade Moving Average Indicators Video
The five widely used moving averages among traders are the Simple Moving Average (SMA), Exponential Moving Average (EMA), Weighted Moving Average (WMA), Exponentially Weighted Moving Average (EWMA), and Hull Moving Average (HMA). I analyzed 43,770 trades to determine which of these performs best.
Top TradingView Indicators Video: Which Ones to Trade
This video covers the best TradingView indicators. Our tests reveal that the top TradingView indicators for advanced analysis are Volume Profile HD, VWAP, Supertrend, ATR, Relative Volatility, and RSI.
Keltner Channels Video: Should You Trade It?
My reliability testing of Keltner Channels using 1,800 years of DJIA data indicates that it's not generally a reliable indicator. However, it can be profitable when used with optimal settings.
Volume Indicator Video: How Pro Stock Analysts Use It
This video lesson explores my research on the volume indicator. Market analysts consider volume a vital indicator in stock charts, used to evaluate the supply and demand of a particular stock or index.
Fibonacci Trading Video: Does It Work?
This video lesson explores trading using Fibonacci patterns. In technical analysis, traders utilize Fibonacci retracement to forecast support and resistance levels by drawing horizontal lines based on the Fibonacci sequence.
Pivot Point Trading Video: How to Trade It
Traders often use pivot point indicators to forecast stock price reversals. But do they truly work? I analyzed 66,480 trades spanning 210 years of...
OBV Indicator Video: How to Trade It Professionally
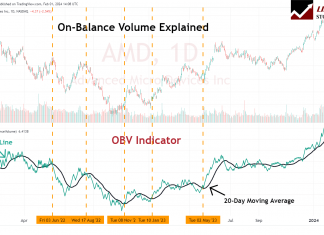
On-balance volume (OBV) is a momentum chart indicator used in technical analysis. It tracks cumulative volume flows, providing traders with insights into the conviction behind a price trend and indicating whether the trend is likely to continue or reverse.
Supertrend Indicator Video: How to Trade It!
This video lesson delves into trading with the Supertrend indicator. In technical analysis, the Supertrend indicator gauges price momentum and identifies buy and sell signals within a trending market.
Donchian Channels Indicator Trading Video
This video lesson delves into trading with the Donchian Channels indicator. After 360 years of data research into Donchian Channels, it has been found that only 35% of trades are profitable, with a reward-to-risk ratio of 2.4:1.
VWAP Indicator: Volume Weighted Average Price Trading Video
This video lesson delves into trading with the VWAP indicator. The Volume Weighted Average Price (VWAP) is a sophisticated indicator that evaluates a stock by considering both volume and price.
ATR Indicator Video: Trading ATR Based on Tested Data
This video lesson delves into trading with the ATR indicator. The average true range (ATR) is a nondirectional momentum indicator that effectively measures price volatility. In my analysis of 1,205 test trades, we achieved a robust reward-to-risk ratio of 1.77, with the average winning trade yielding an 8.5% return.
Volume Profile Indicator: Learn Trading Video
This video lesson delves into trading with the Volume Profile indicator. The Volume Profile Indicator provides a visual representation of trading activity at specific price levels over a defined period.
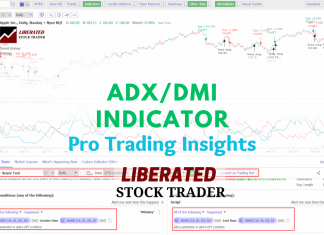
DMI Indicator Video: How to Trade It Profitably
This video lesson delves into trading with the Directional Movement Index (DMI) indicator. My analysis, involving 9,764 trades over 25 years, confirms that the DMI indicator is both profitable and dependable, surpassing the performance of the S&P 500 index.
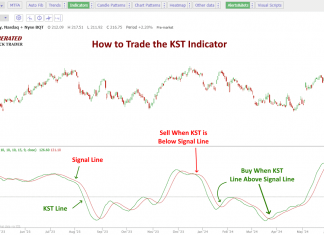
KST Indicator: Trading & Strategy Video
This video lesson delves into trading with the Know Sure Thing (KST) indicator. My testing has demonstrated that the Know Sure Thing (KST) Oscillator is a dependable tool for technical analysis. It effectively interprets market momentum and generates buy and sell signals.
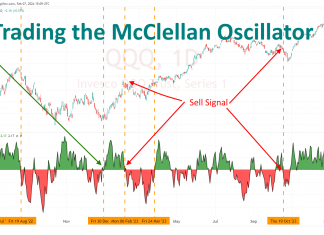
McClellan Oscillator Trading Video
The McClellan Oscillator is renowned for its capacity to identify overbought or oversold market conditions. It can also signal potential trend reversals.
Read the full...
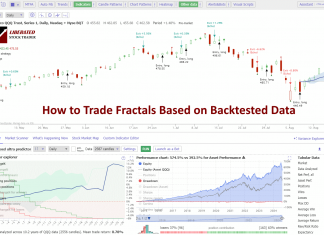
Fractal Patterns: Trading Fractals Video Lesson
This video lesson covers how to trade Fractal patterns. Fractals provide a unique way to understand patterns in asset price movements. In financial terms, fractals help identify potential turning points and trends.
Chart Patterns Video Library
Our library of chart patterns contain original research into their accuracy and profitability. Its a valuable resource for investors and traders.
Stock Investing Video Library: 60+ Free Lessons
Welcome to my library of educational videos! Dive into our fascinating research on stock chart indicators, patterns, and charts, and unlock the secrets to mastering the market!


