Are you looking for a comprehensive stock screening tool that can inspire many trading strategies? Due to many reader requests, I tested ChartMill, and to my surprise, I discovered an excellent stock analysis platform.
After thorough testing, I rate ChartMill 4.2 stars. With its robust stock screener, innovative trading ideas, and advanced pattern recognition, it’s an excellent tool for both novice and intermediate investors.
My testing will give you all the information you need to decide whether ChartMill is right for you and, if not, what the best alternatives are.
Review Ratings & Verdict
ChartMill provides a slick charting, screening, and market analysis platform for traders and investors. It’s easy to use, with great workflow and unique features, such as proprietary ratings for trend, value, growth, and health.
The platform’s proprietary metrics, like the ChartMill Value Indicator, Weinstein, and Trend Indicator, give users unique insights into stock performance.
Charts are another standout feature. They are customizable and offer a range of technical analysis tools. This helps me identify trends and patterns quickly.
What truly sets ChartMill apart is its ease of use and intricate stock screener, combining technical indicators, pattern recognition, and financial metrics.
Finally, I found the pre-built Trading Ideas strategies particularly helpful. They save time and help generate trade suggestions based on factors like undervalued fundamentals and technical pattern breakouts.
Pros
✔ 85 stock chart indicators and overlays
✔ Candlestick and Heiken Ashi charts
✔ Intraday charting included
✔ Unique stock analyzer feature
✔ 262 trading ideas pre-built screeners
✔ 238 stock screening criteria
✔ 10-year historical data
✔ Free version available
✔ Europe, USA & UK Exchange Data
Cons
✘ No Mobile App
✘ Cannot save chart annotations
✘ No real-time data on any plan
✘ No integrated trading

Key Features
ChartMill offers a comprehensive suite of tools for both new and experienced traders. It provides advanced charting and analysis options and facilitates multiple trading strategies with a variety of customizable filters and screening criteria.
| ⚡ ChartMill Features | Charts, Watchlists, Screening |
| 🏆 Unique Features | Automated Trendlines, Fibonacci, Candlestick & Price Pattern Recognition |
| 🎯 Best for | Stock Traders & Investors |
| ♲ Subscription | Monthly, Yearly |
| 💰 Price | $30/m or $22.50/m annually |
| 💻 OS | Web Browser |
| 🎮 Trial | ✅ |
| ✂ Discount | ❌ |
| 🌎 Region | USA, Europe, UK |
Pricing
ChartMill pricing is simple. There are two service tiers, free and paid. You can choose between a monthly or an annual subscription.
- Free trial for new users. This trial allows users to explore many features without any cost.
- Monthly Subscription: $29.97 per month
- Annual Subscription: $259.97 per year ($22.50 per month, offering a 32% discount)
Compare to Similar Products
I have to say that ChartMill is excellent and my recommendation for novice and intermediate investors. However, comparing ChartMill to TrendSpider, TradingView, MetaStock, and Trade Ideas, my tests show that TrendSpider is the best overall stock analysis software passing 10/12 tests.
TrendSpider is our top pick for automated stock chart analysis, backtesting, and automated bot trading. TradingView is better for a global trading community. Stock Rover is better than TrendSpider for long-term growth, dividend, and value investors. Trade Ideas is better for AI-driven robotic day trading. Benzinga Pro is a better alternative for trading real-time news.
| Features | ChartMill | TrendSpider | TradingView | Trade Ideas | MetaStock |
| Rating | 4.2 | 4.8 | 4.7 | 4.6 | 4.4 |
| Good for Novice Investors | ✔ | ✘ | ✔ | ✘ | ✘ |
| Pricing | $30/m or $22.50/m annually | $107/m or $48/m annually | Free | $13/m to $49/m annually | $254/m or $178/m annually | MetaStock R/T $100/m, Xenith $265/m |
| Global Market Data | USA | USA | ✔ | USA | ✔ |
| Powerful Charts | ✔ | ✔ | ✔ | ✘ | ✔ |
| Stocks | ✔ | ✔ | ✔ | ✔ | ✔ |
| Futures | ✘ | ✔ | ✔ | ✘ | ✔ |
| Forex | ✘ | ✔ | ✔ | ✘ | ✘ |
| Cryptocurrency | ✘ | ✔ | ✔ | ✘ | ✘ |
| Social Community | ✘ | ✘ | ✔ | ✔ | ✘ |
| Real-time News | ✘ | ✘ | ✘ | ✘ | ✔ |
| Screeners | ✔ | ✔ | ✔ | ✔ | ✔ |
| News Scanning | ✔ | ✔ | ✘ | ✘ | ✔ |
| Backtesting | ✘ | ✔ | ✔ | ✔ | ✔ |
| Code-Free Backtesting | ✘ | ✔ | ✘ | ✘ | ✘ |
| Automated Analysis | ✔ | ✔ | ✔ | ✔ | ✔ |
Features Analysis
ChartMill offers a range of tools and features for traders looking to make informed decisions. The platform excels in charting, screening, and providing actionable insights through its analyzer and pattern recognition tools.
Charting
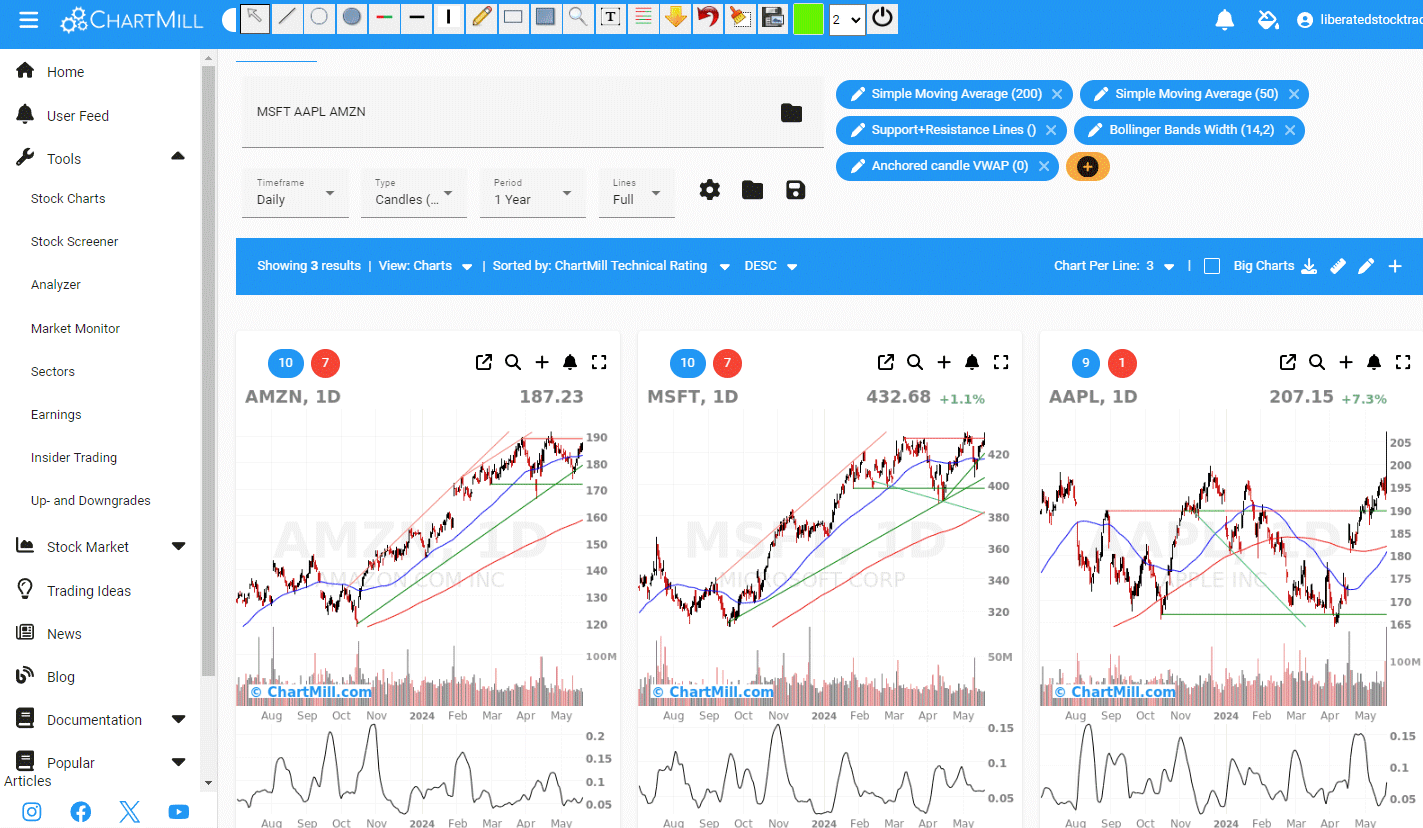
ChartMill provides users with five types of stock charts: bar, line, candlestick (filled and hollow), and Heikin Ashi charts. These charts come equipped with essential technical indicators such as RSI, MACD, Stochastics, and Bollinger Bands.
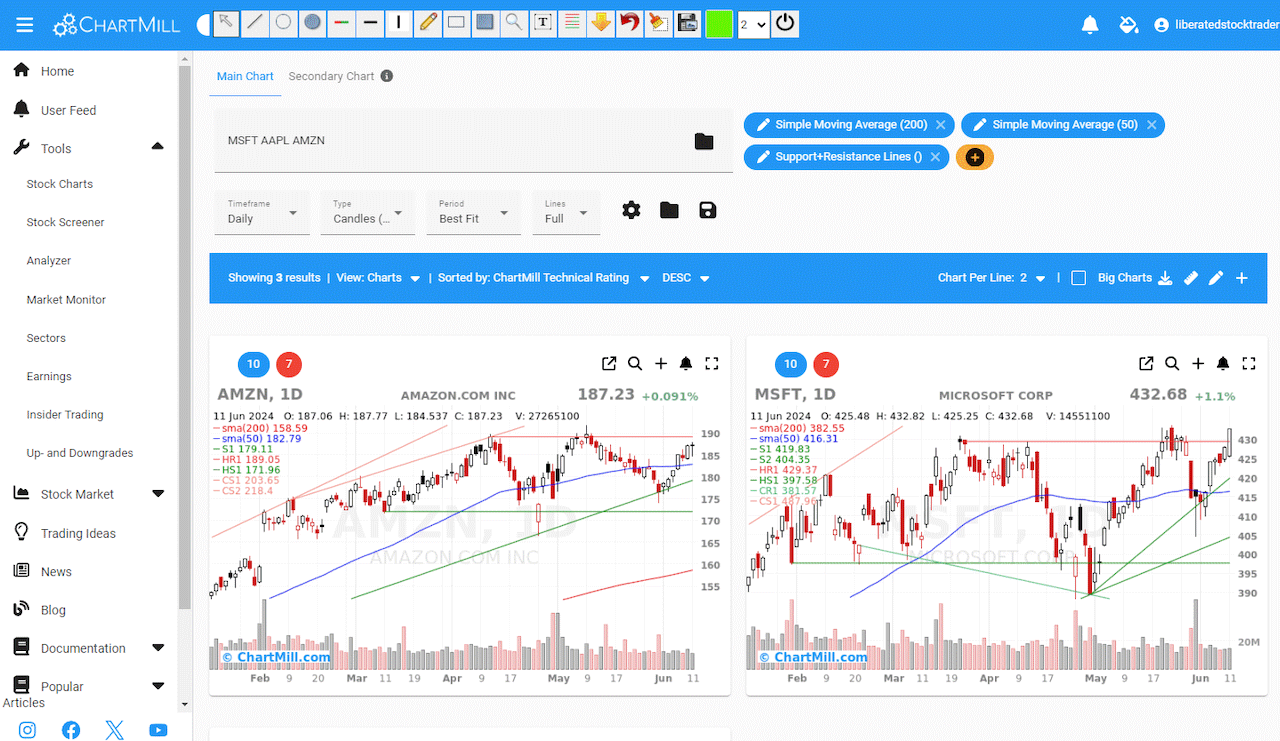
I find the customization options quite robust, allowing me to tailor the charts to my specific needs. This flexibility makes it easier to identify trends and potential trading strategies.
| Technical Charting | Rank | Chart Types | Indicators |
| TrendSpider | #1 | 6 | 206 |
| TradingView | #1 | 17 | 160 |
| MetaStock | #2 | 10 | 150 |
| ChartMill | #3 | 5 | 85 |
| Finviz | #3 | 5 | 22 |
| Trade Ideas | #4 | 6 | 16 |
ChartMill charting is unique in the fact that it can display many charts on a single page with the same chart setup and indicators. You can annotate charts, but if you reload the page, the annotations are lost. I could not figure out how to save annotations.
Screening
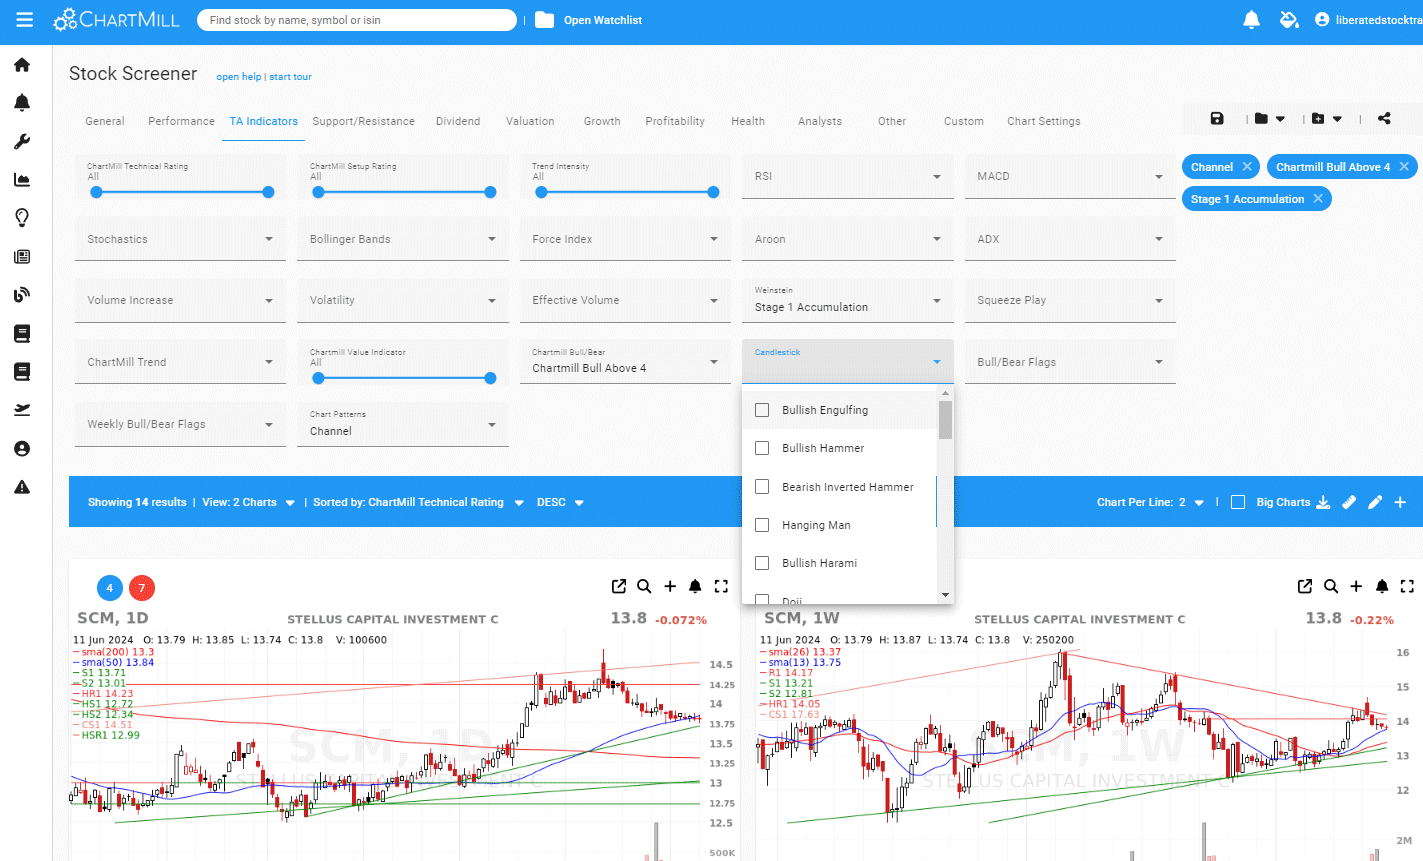
One of ChartMill’s standout features is the stock screener. It allows users to filter stocks based on over 238 criteria. The screener contains all the expected criteria for profitability, dividends, financials, and valuation, but it also has many unique elements, such as technical ratings, trade setup ratings, and trend intensity.

I find it extremely useful to customize screening criteria to match my investment strategies. ChartMill elegantly combines technical screening with fundamental analysis and even analyst ratings and trading strategies.
The screener supports ten years of historical data, so I can see how my chosen filters would have performed in the past. This feature helps refine the strategies and make more reliable trades.
Additionally, the pre-built screens created by both ChartMill and its users provide a good starting point for new users.
Technical & Value Ratings
ChartMill offers a comprehensive rating system that evaluates stocks based on multiple technical indicators. These ratings range from very bullish to very bearish, providing a quick snapshot of a stock’s technical health. Below, you can see the selection boxes for technical ratings, setup ratings, and even candlestick pattern recognition.
I often rely on these ratings when making quick trading decisions, as they help prioritize stocks that align with my trading strategies. The ratings are also dynamically updated, ensuring that I have the latest data at my fingertips.
ChartMill Analyzer
The ChartMill Analyzer is an invaluable tool for exploring stock data more deeply. It provides detailed analysis using various technical analysis tools and screeners. Pre-built analyzers check for technical setups, affordable growth, value, dividend, and growth stocks.
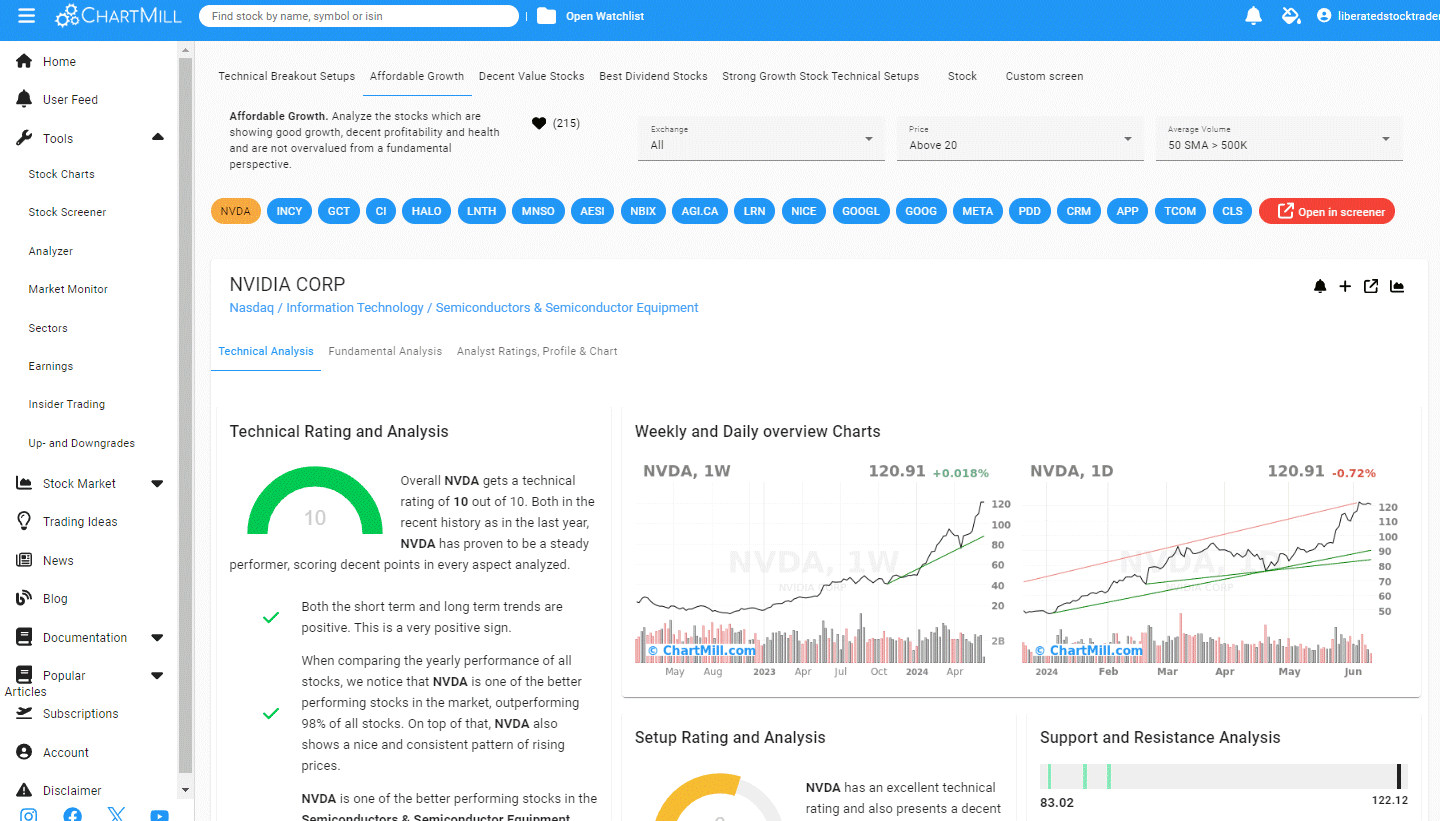
I use the analyzer to identify potential trading ideas and validate them using the data provided. The analyzer report explains how a stock meets the selection criteria and even provides example entry and exit price points. I really like this feature; I think it is unique and adds a lot of value for users.
The analyzer integrates seamlessly with the rest of the platform, allowing for a smooth transition from identifying a stock to analyzing its potential. The insights gathered from this tool can help you make more informed investment decisions.
Automated Pattern Recognition
One of my favorite features is the automated pattern recognition tool. This tool scans for 29 technical patterns like head-and-shoulders, double tops, and triangles. Additionally, using the screener, you can also scan for 30 candlestick patterns; this is extremely important for day traders.

The automated recognition feature saves me a lot of time and ensures that I don’t miss important patterns. This is particularly useful for day trading, where timing and speed are crucial.
Trading Ideas
One of the most impressive features is the trading ideas functionality. Select a trading strategy, timeframe, and long or short, and you are presented with pre-built strategies.
I absolutely love the trading ideas feature. It makes finding opportunities simple and effective for beginner and intermediate investors and traders.
Trading strategies include growth, value, dividend, momentum, mean reversion, and pullbacks. There are even squeeze-play strategies for Meme stocks. Timeframes include day trading, swing trading, position trading, and long-term investing.
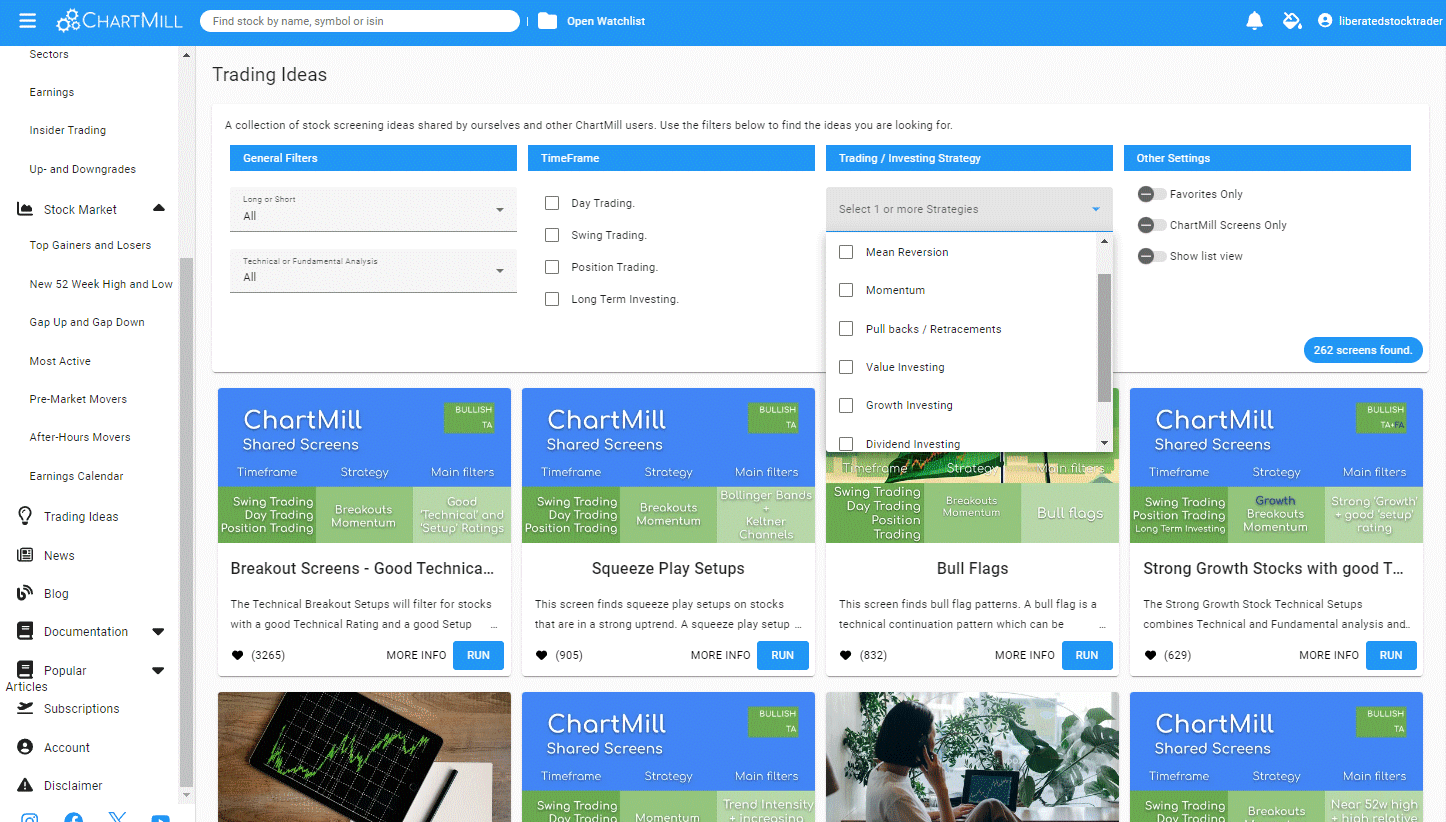
ChartMill’s Trading Ideas Helps You Find Potential Trade With 263 Pre-Built Strategies
Price Alerts
ChartMill offers a robust alert system. I can set alerts for stock prices, news events, screener alerts, and insider transactions. However, you cannot set an indicator alert, for example, when the price crosses up through a moving average line.
These alerts can be customized to suit my investment strategies, ensuring that I am always notified of important changes. Because the data is not real-time, the alerts are delivered within 15 minutes.
Market Monitor
ChartMill’s market monitor feature allows you to see the market’s status and which sectors are performing or underperforming in a simple snapshot. The market monitor provides a visual representation of the volume, gainers and losers, and major indices.
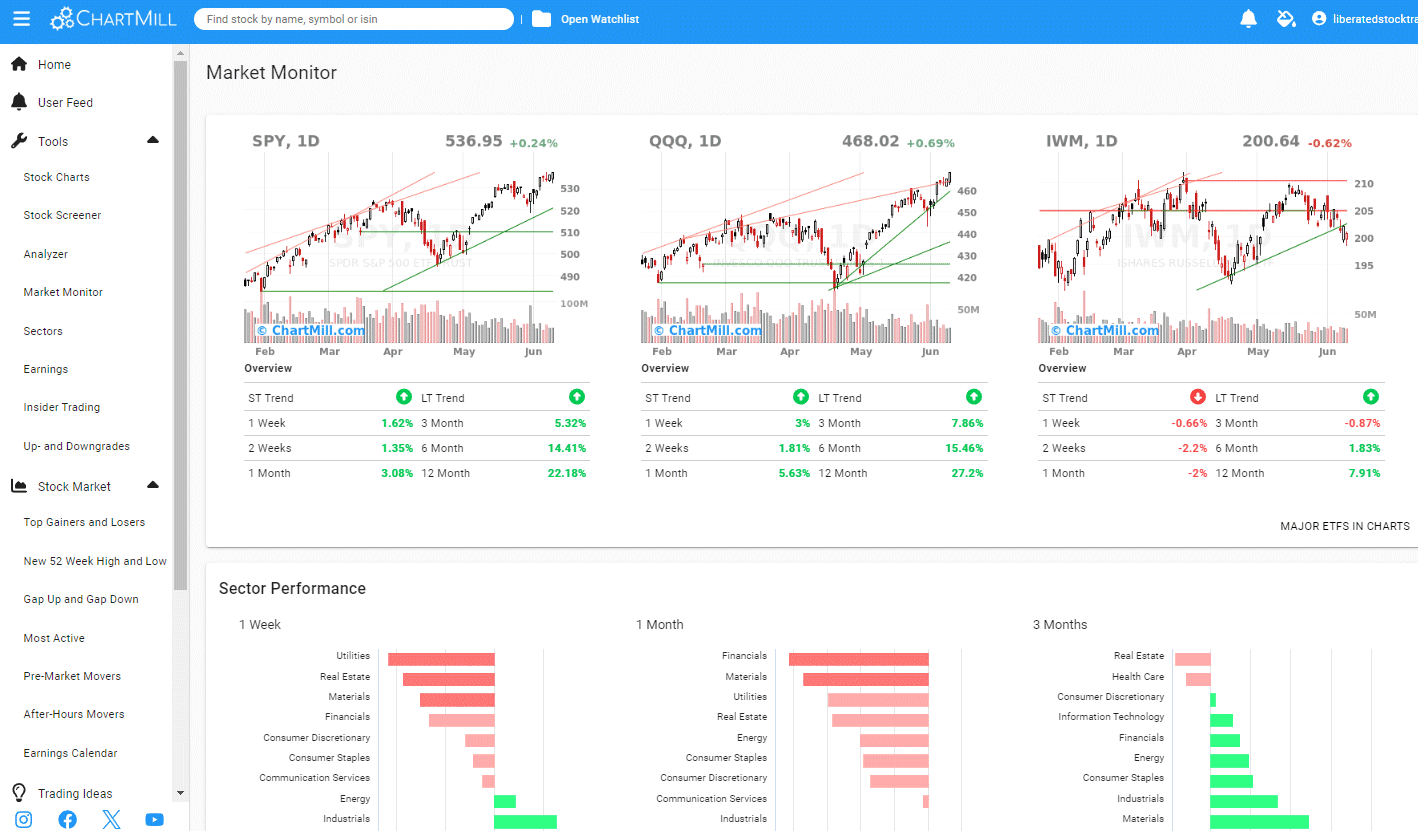
ChartMill: Market Monitor Screenshot
Gapping Stocks Report
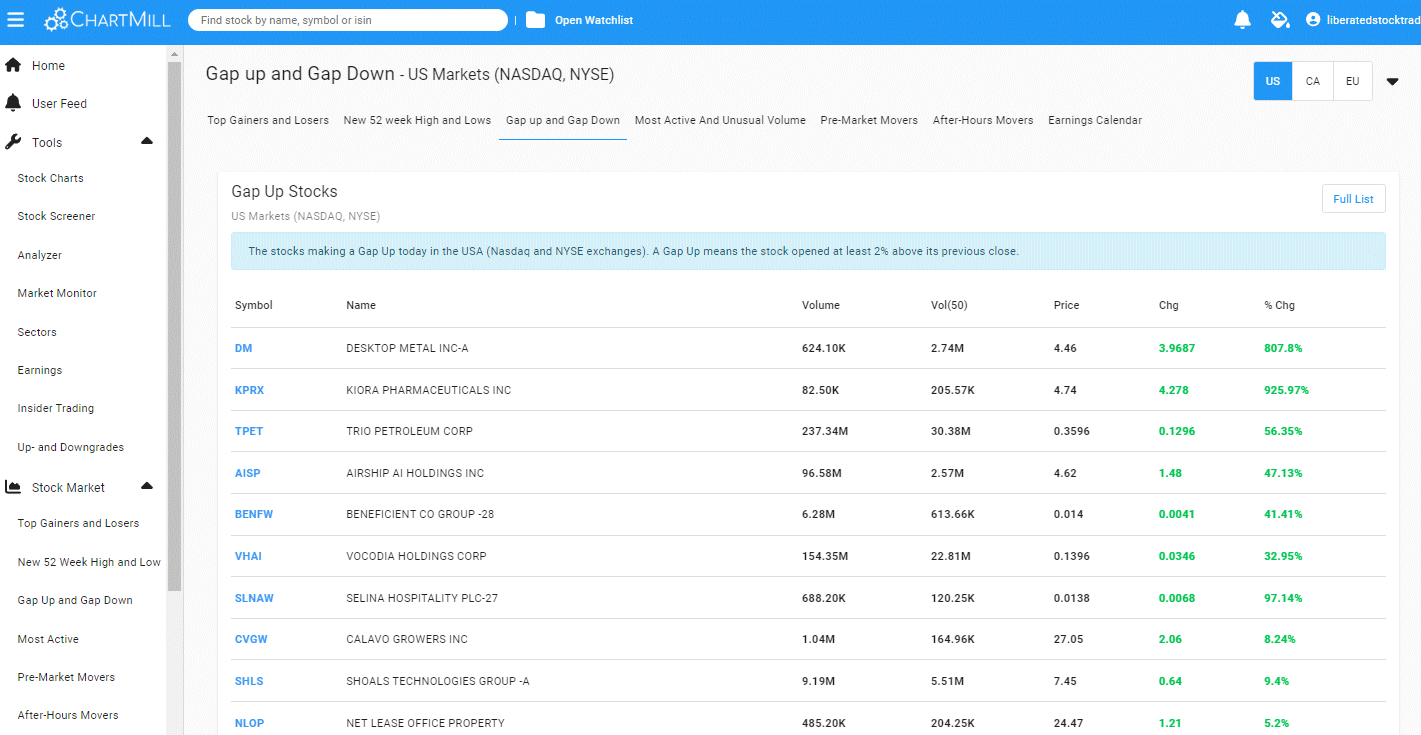
Another interesting feature is the gapping stocks report, which provides a listing of stocks with recent price gaps. Similar reports are available for insider trades, most active traders, and pre/post-market movers.
Is ChartMill Worth It?
Yes, ChartMill is worth using because it provides innovative features wrapped in a simple interface, making investing accessible for beginner and intermediate investors. I highly rate the trading ideas and screening features, which are well thought out and implemented.
Final Thoughts
I first tested ChartMill in 2024, and I have to say I am impressed. I highly recommend it for novice investors as it makes charting and finding trading opportunities incredibly easy. It also has a plethora of excellent screening criteria for value growth in dividend investors.
FAQ
What is the pricing structure for ChartMill?
ChartMill offers a free plan, which provides limited access to features, and a paid plan, which costs $22.50 per month on an annual subscription.
Does ChartMill offer a dedicated mobile application?
ChartMill does not currently have a dedicated mobile application. Its platform is web-based, and while mobile-friendly, it is best used on a desktop for the full range of features and tools available.
How is ChartMill's screener different from other stock screeners?
ChartMill stands out due to its combination of both technical and fundamental analysis tools. It also offers pre-built trading ideas screens created by both the company and its user community. This makes it easier for users to quickly find stocks based on well-established criteria and strategies.
What features are available in the free version of ChartMill?
The free version of ChartMill includes basic scanning, charting, and analysis tools. Users can perform stock scans with a limited set of technical indicators and access some charting options. It provides a useful starting point for evaluating the platform.
How does ChartMill's performance compare to Finviz?
ChartMill offers detailed technical and fundamental analysis tools, similar to Finviz, but with more customizable scanning options. While Finviz is popular for its straightforward interface and broad data filters, ChartMill provides deeper analytical tools for traders looking for a more nuanced approach.
What stock screener is best for identifying successful stocks?
Stock Rover is the best stock screener for value and dividend investors. ChartMill is excellent for traders needing both technical and fundamental analyses. It competes well with Finviz and TradingView.
