The Chowder Rule is a popular guideline used by dividend growth investors to assess potential investments. It helps investors identify stocks that not only pay dividends but also have the potential for dividend increases over time.
The Chowder Rule finds dividend growth stocks by combining a stock’s yield and its five-year dividend growth rate, aiming for a total of 12% or more.
While the Chowder Rule is particularly useful for those focused on dividend growth investing, it is also beneficial for constructing diverse portfolios. Investors can balance high-yield stocks with those expected to grow dividends, optimizing for total return. This strategy supports sustainable income and long-term growth.
Key Takeaways
- The Chowder Rule helps assess dividend growth stocks by combining yield and growth rate.
- It is useful for constructing portfolios focused on sustainable income and growth.
- Various tools and resources support investors in applying the Chowder Rule.
- A value over 12% is considered desirable.
For those new to dividend investing, understanding the Chowder Rule can be a valuable tool. Combining yield and growth rate provides a straightforward approach to making informed investment decisions. Various tools and resources are available to help investors apply this rule effectively.
Understanding the Chowder Rule
The Chowder Rule is a guideline used by dividend growth investors to evaluate stocks. It combines dividend yield and dividend growth to help decide if a stock is worth investing in. This section will explain the rule’s origins and definition, how it is applied in investment strategies, and how to interpret the Chowder Number.
Origins and Definition
The Chowder Rule was created by a contributor on Seeking Alpha, known as “Chowder.” This rule helps investors focus on stocks with both high dividend yield and consistent dividend growth. It aims to ensure that the sum of the Dividend Yield and Dividend Growth exceeds a certain threshold, making the investment attractive for long-term growth.
The Chowder Rule usually sets a threshold of 12% for most stocks. For utilities, the bar is set at 8% because these stocks are generally more stable. The goal is to find stocks that not only pay regular dividends but also grow them steadily over time.
Charting the Chowder Rule
You do not need to calculate the Chowder Rule manually; Stock Rover does it for you. Only Stock Rover provides advanced hybrid financial metrics, such as the Chowder Rule, Altman Z-Score, Piotroski F-Score, Beneish M-Score, Graham Number, Greenblatt Earnings Yield, Greenblatt ROC, Yacktman Forward Rate of Return and the Sharpe and Sortino Ratios.
The chart screenshot below shows the Chowder Rule plotted over time.

Chart & Screen the Chowder Rule with Stock Rover
Application in Investment Strategies
Investors use the Chowder Rule to screen and select stocks for their portfolios. First, the Dividend Yield is examined, followed by the Compound Annual Growth Rate (CAGR) of dividends over the past five years. If the sum of these two metrics meets or exceeds the threshold, the stock is considered a potential buy.
For example, if a stock has a Dividend Yield of 4% and a five-year dividend CAGR of 9%, its Chowder Number would be 13%. Since it surpasses the 12% threshold, this stock would be deemed a good candidate for investment.
This method helps investors focus on companies that not only provide income through dividends but also grow these payments, enhancing the overall return on investment without taking excessive risks.
Interpreting the Chowder Number
The Chowder Number is the sum of a stock’s Dividend Yield and its Dividend Growth rate. A higher Chowder Number indicates a healthier dividend profile, combining immediate income with long-term growth potential. For example, a stock with a Chowder Number of 15% offers a desirable balance of current yield and future growth.
Investors use the Chowder Number to compare stocks within the same sector. It acts as a quick reference to identify which stocks may offer the best combination of yield and growth. By sticking to stocks with high Chowder Numbers, investors aim to build portfolios that provide steady income and appreciation over time.
Chowder Rule Formula
The formula for calculating the Chowder Number:
Dividend Yield + 5-Year Dividend Growth Rate = Chowder Number.
For example, if a stock has a current dividend yield of 3% and its annualized dividend growth rate over the past five years is 12%, its Chowder Number would be 15%.
It takes into account both the current yield and the growth potential, providing a more comprehensive view than just looking at either factor individually.
What Makes a Good Chowder Number?
A good Chowder Number of 12% or higher is considered favorable. This signifies that the stock has a healthy balance between current yield and dividend growth potential.
Investors should also consider other factors, such as the company’s financial health, market trends, and management track record, before making any investment decisions solely based on the Chowder Rule formula.
Try Powerful Financial Analysis & Research with Stock Rover
A Practical Example of Using the Chowder Number in Investing
To better understand how to use the Chowder Number in investing, let’s look at an example.
Let’s say you are considering investing in Company XYZ, which currently has a dividend yield of 4% and an average dividend growth rate of 8%. By applying the Chowder Rule formula (current yield + average dividend growth rate), we can calculate that Company XYZ has a Chowder Number of 12%.
This indicates that Company XYZ may be a good investment opportunity as it meets the criteria for a favorable Chowder Number. However, before making any decisions, it is important to conduct further research on the company and its financial health.
It is also worth noting that not all companies will have a high Chowder Number. Some industries, such as technology, may have lower dividend yields and growth rates but can still be strong investments. The key is to consider the Chowder Number in conjunction with other factors such as a company’s financials, market trends, and management.
Additionally, it is important to keep an eye on the Chowder Number over time. If a company’s dividend yield decreases or its growth rate slows down, its Chowder Number will also decrease. This could be a sign that the company is facing challenges and may not be a good investment opportunity anymore.
Assessing Dividend Stocks with the Chowder Rule
The Chowder Rule is a strategy used by investors to choose stocks that offer a combination of dividend yield and dividend growth. This strategy aims to identify stocks that not only provide income through dividends but also have the potential for capital appreciation.
Evaluating Dividend Safety
Evaluating a dividend’s safety is crucial. Dividend safety refers to the likelihood that a company will maintain or increase its dividend payments. It relies heavily on the company’s financial health and cash flow.
Firms like Dividend Aristocrats are known for their stable and growing dividends over 25 consecutive years. Factors to consider include the company’s payout ratio, debt levels, and earnings consistency. High debt or fluctuating earnings can signal potential dividend cuts. Utilities stocks often offer stable dividends due to their consistent revenue streams.
Analyzing Payout Ratios
The payout ratio is a key metric to assess. It measures the proportion of earnings paid out as dividends. A lower payout ratio generally indicates a safer dividend, as the company retains more earnings to weather downturns.
For example, a payout ratio below 60% is considered healthy. Stocks with a high payout ratio might still be safe if they belong to stable sectors like utilities. Comparing the payout ratio with the industry average provides a better context.
Historical Data and Dividend Aristocrats
Historical data is invaluable for assessing dividend reliability. Dividend Aristocrats are companies with a long track record of increasing dividends for at least 25 years. This history demonstrates resilience and commitment to returning value to shareholders.
Earnings-per-share (EPS) growth is another critical factor. Companies with consistent EPS growth are more likely to sustain or increase their dividends. Reviewing historical data helps identify stocks with a strong dividend history and growth prospects, making them suitable for long-term investment.
These factors together help investors use the Chowder Rule to find stocks that balance income and growth potential.
Try TradingView, Our Recommended Tool for International Traders
Global Community, Charts, Screening, Analysis & Broker Integration

Global Financial Analysis for Free on TradingView
Investment Approaches and Portfolio Construction
Understanding different investment strategies and how to build a diversified portfolio is crucial for maximizing returns while managing risk. This section explores the key concepts of total return versus dividend investing and offers insights on constructing a balanced portfolio.
Total Return vs. Dividend Investing
Total return investing focuses on the combination of capital gains, dividends, and interest. This approach looks at investments’ overall growth potential. Investors analyze a company’s earnings and growth prospects and how these factors contribute to the stock’s price appreciation.
Dividend investing, on the other hand, prioritizes companies that consistently pay out dividends. These stocks provide a steady income stream, which can be especially valuable during retirement. By reinvesting dividends, investors can benefit from compounding returns over time.
Building a Diversified Portfolio
A diversified portfolio helps to spread risk across different asset classes and sectors. By combining stocks, bonds, real estate, and other investments, one can reduce the impact of any single asset’s poor performance.
Consider including a mix of growth stocks for capital appreciation and dividend-paying stocks for income. Using a methodology like investment risk management can help construct a resilient portfolio. Real estate investments can provide stability and potential inflation protection.
Incorporating the concept of margin of safety ensures investments are made at a favorable price relative to their intrinsic value. This can provide a cushion against market volatility and contribute to long-term portfolio stability.
Tools and Resources for Dividend Growth Investors
Dividend growth investors have various tools and resources at their disposal. These include investment analysis platforms and insights from financial analysts to guide decision-making.
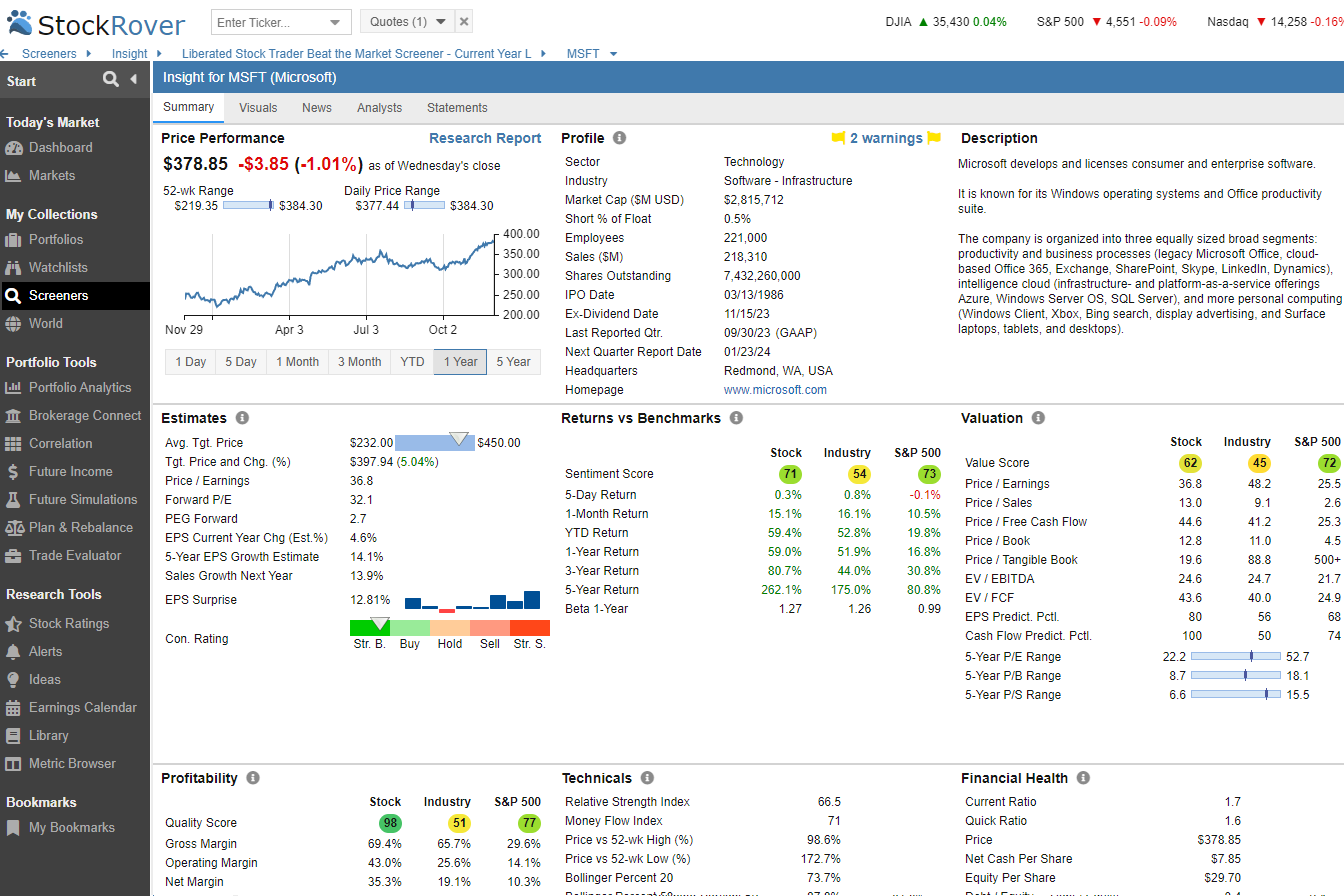
Investment analysis platforms like Stock Rover provide valuable insights into stock performance.
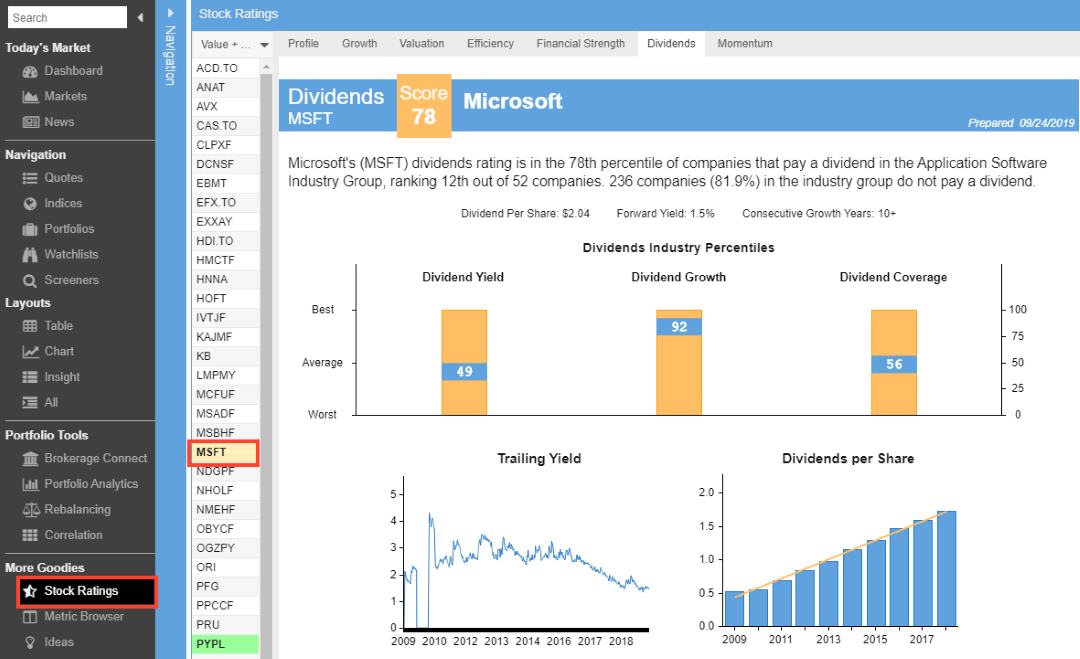
Dividend Analysis with Stock Rover
Stock Rover offers in-depth reports on dividend growth stocks. It highlights undervalued companies with solid dividend growth prospects, allowing investors to identify potential investments. Its stock screening capabilities let users filter stocks based on dividend yield, payout ratio, and growth rate. This platform also includes portfolio management features, enabling investors to track their investments and adjust their strategies as needed.
FAQ
What is the best software for screening and charting the Chowder Rule?
Stock Rover is the best software for screening and charting advanced financial metrics like the Chowder Rule. Our testing shows it offers the widest array of metrics and ratios available on the market today.
How is the Chowder Rule calculated for stock investments?
The Chowder Rule is calculated by adding a stock's current dividend yield to its five-year annual dividend growth rate. This sum gives an overall score that helps investors gauge the stock's potential performance.
What is an example of applying the Chowder Rule in a portfolio?
Consider a stock with a current dividend yield of 3% and a five-year dividend growth rate of 7%. The Chowder Rule score would be 10% (3% + 7%). Investors use this score to determine if the stock meets their investment criteria.
How can the Chowder Rule be used to assess dividend-paying stocks?
By applying the Chowder Rule, an investor can quickly screen dividend-paying stocks to ensure they meet a minimum threshold for combined yield and growth. This makes it easier to identify stocks with strong potential for both income and capital appreciation.
Is there a reliable screener available to identify Chowder Rule stocks?
Yes, Stock Rover provides a screener that can filter stocks based on their Chowder Number. It helps investors quickly identify companies with high scores and strong financial health.
What signifies a good score according to the Chowder Rule?
A good Chowder Rule score often depends on an investor's goals. Generally, a score above 12% is considered attractive for standard dividend stocks. For utility stocks, a score above 8% may be deemed acceptable due to their typically lower growth rates.
In what ways does the five-year dividend growth rate impact the Chowder Rule?
The five-year dividend growth rate is crucial as it reflects the stock's ability to increase its dividends over time. A higher growth rate can significantly boost the Chowder Rule score, indicating the stock's potential for dividend and value growth.
How does the Tweed Factor relate to or differ from the Chowder Rule?
The Tweed Factor is another metric used to evaluate dividend stocks. It focuses more on income consistency and payout ratios. Unlike the Chowder Rule, which combines yield and growth, the Tweed Factor may emphasize the sustainability and reliability of dividend payments.
My thorough testing awarded TradingView a stellar 4.8 stars!
With powerful stock chart analysis, pattern recognition, screening, backtesting, and a 20+ million user community, it’s a game-changer for traders.

Whether you're trading in the US or internationally, TradingView is my top pick for its unmatched features and ease of use.
Explore TradingView – Your Gateway to Smarter Trading!