The Commitment of Traders (COT) Report is a valuable tool for traders wanting to understand market sentiment in the futures markets.
Published by the Commodity Futures Trading Commission, it offers insights into the positions held by different categories of traders.
Using the Commitment of Traders (COT) Report, traders can identify potential market moves and adjust their strategies accordingly.
This report is divided into various categories, such as commercials, non-commercial, and non-reportable positions. By analyzing this data, traders can gauge the activities of big market players and make informed decisions. Recognizing trends in commodities, currencies, and other futures can lead to more strategic and profitable trades.
Key Takeaways
- The COT Report aids in understanding market sentiment and trends.
- Analyzing trader categories helps recognize market moves.
- Strategic trading decisions can be based on COT Report data.
- COT report data needs to be charted over time to be useful.
Armed with the information provided in the COT Report, traders can develop strategies tailored to current market conditions. Whether trading in commodities, currencies, or other futures, understanding the shifts and trends highlighted in this report can be the key to successful trading.

Understanding the COT Report
The COT Report is a vital tool for traders. It details the activities of various market participants and offers insights into market positions and futures price movements. It breaks down data into key categories and provides critical distinctions between different types of traders.
Components and Structure
The Commitment of Traders (COT) Report is published weekly by the Commodity Futures Trading Commission (CFTC). It includes critical data such as open interest, long positions, and short positions for various futures markets.
Open interest reflects the total number of outstanding contracts still open. Long positions indicate buying interest, while short positions demonstrate selling interest. This data helps traders understand market sentiments and trends.
Categories of Traders
The COT Report categorizes traders into three main groups: commercial traders, non-commercial traders, and non-reportable traders.
Commercial traders—also known as hedgers—use futures markets to offset risk in their primary business activities. Non-commercial traders, often referred to as large speculators or hedge funds, trade mainly for speculative purposes. Non-reportable traders include smaller market participants who do not meet reporting thresholds set by the CFTC. Understanding these categories assists in gauging market dynamics and potential shifts.
Reportable vs. Non-Reportable Positions
In the COT Report, positions are divided into reportable and non-reportable categories.
Reportable positions are those held by large traders who meet the CFTC’s reporting criteria. These positions offer insights into the actions of significant market players, such as hedge funds and large speculators. In contrast, non-reportable positions belong to smaller traders whose activities are aggregated to maintain anonymity.
By analyzing these segments, traders can identify trends influenced by major market participants and potentially find profitable trading opportunities.
Charting COT Report Trends
The COT report is not useful for traders by itself because it does not provide specific entry and exit points for trades or trend analysis. However, by charting the COT report data over time, traders can spot long-term trends and sentiment shifts among large traders.
TradingView is our recommended platform for charting and trading futures contracts because it has over 50 custom and built-in COT reporting indicators.
Traders can use these indicators to plot the data from the COT report and identify patterns and trends that could indicate potential changes in market sentiment. See the COT indicators charted for Sugar futures below.
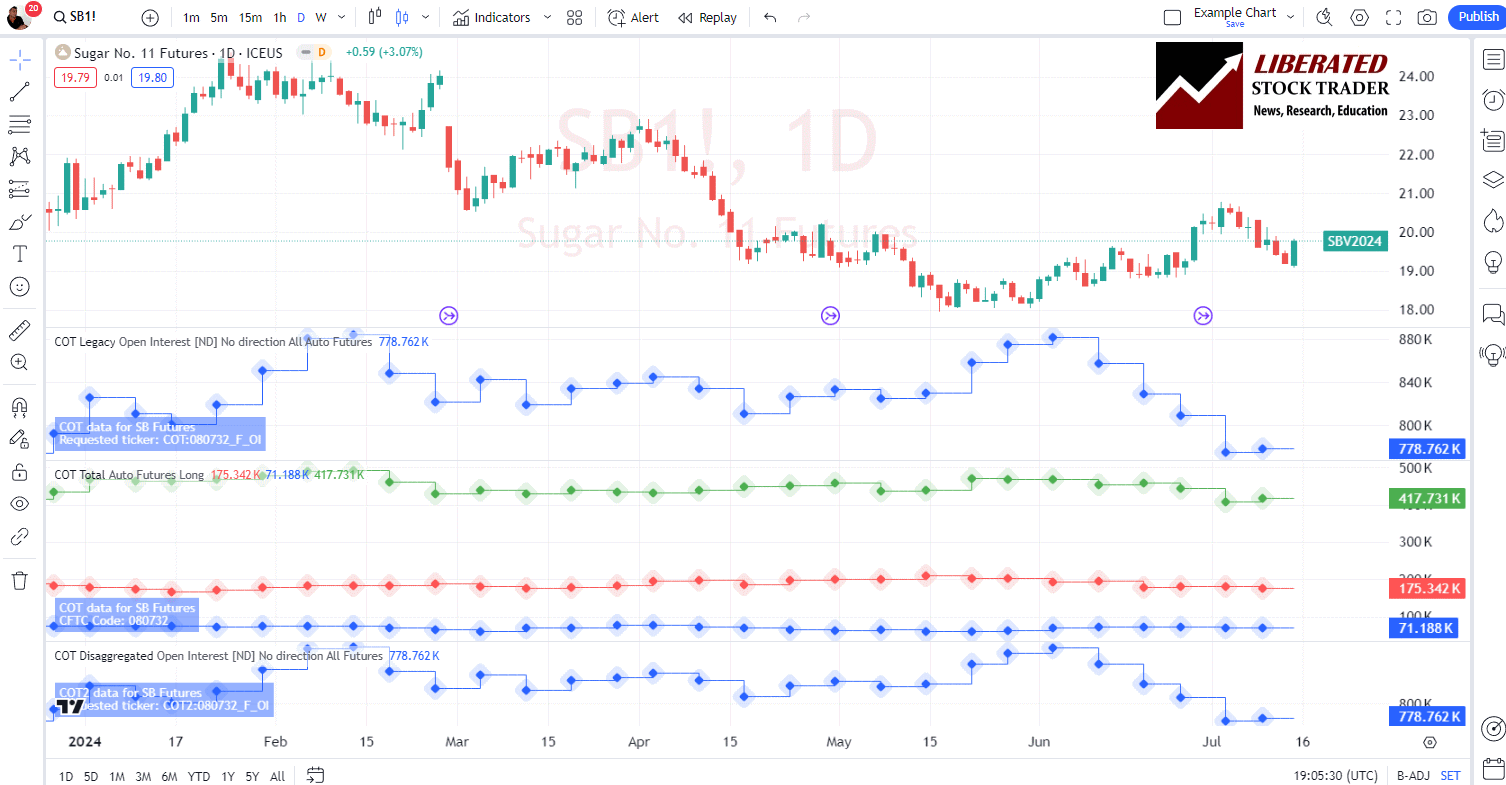
Commitment of Traders COT Report Data & Indicators in TradingView: Chart Sugar Futures
Get TradingView Commitment of Traders Indicators
TradingView has three recommended COT indicators: Commitment of Traders: Legacy Metrics, Disaggregated Metrics, and Commitment of Traders: Total.
- Commitment of Traders: Legacy Metrics is based on the old COT report format, which divides traders into commercial, non-commercial, and non-reportable categories.
- The Disaggregated Metrics indicator breaks down the data even further by separating large and small traders within each category.
- Lastly, the Commitment of Traders: Total combines all trader categories into one indicator for a comprehensive view of market sentiment.
Using these indicators, traders can analyze long-term trends in market sentiment among different types of traders. For example, if there is a significant increase in net long positions among commercial traders while non-commercial traders decrease their net long positions, this could signal a potential shift in market sentiment towards bullish.
Additionally, TradingView also offers custom COT indexes that can be used to compare current COT data to historical averages. This allows traders to identify deviations from typical market behavior and potentially spot trading opportunities.
Analyzing Market Sentiment
To effectively trade using the Commitment of Traders (COT) report, it’s crucial to understand how to analyze market sentiment. This involves interpreting traders’ positions and identifying potential trends and reversals.
Interpreting Traders’ Positions
Market sentiment can be gauged by looking at the COT charts, which show the positions of different market participants. These positions include net long and net short holdings. Net long positions reflect a bullish sentiment, suggesting a majority are betting on price increases. Net short positions indicate a bearish sentiment, showing that traders expect prices to fall.
Traders analyze these positions to determine the market’s outlook. Open interest changes also provide key insights. If open interest (the total number of outstanding contracts) rises with increasing prices, this suggests new buying interest and further upward movement. Conversely, rising open interest with declining prices implies growing bearish sentiment.
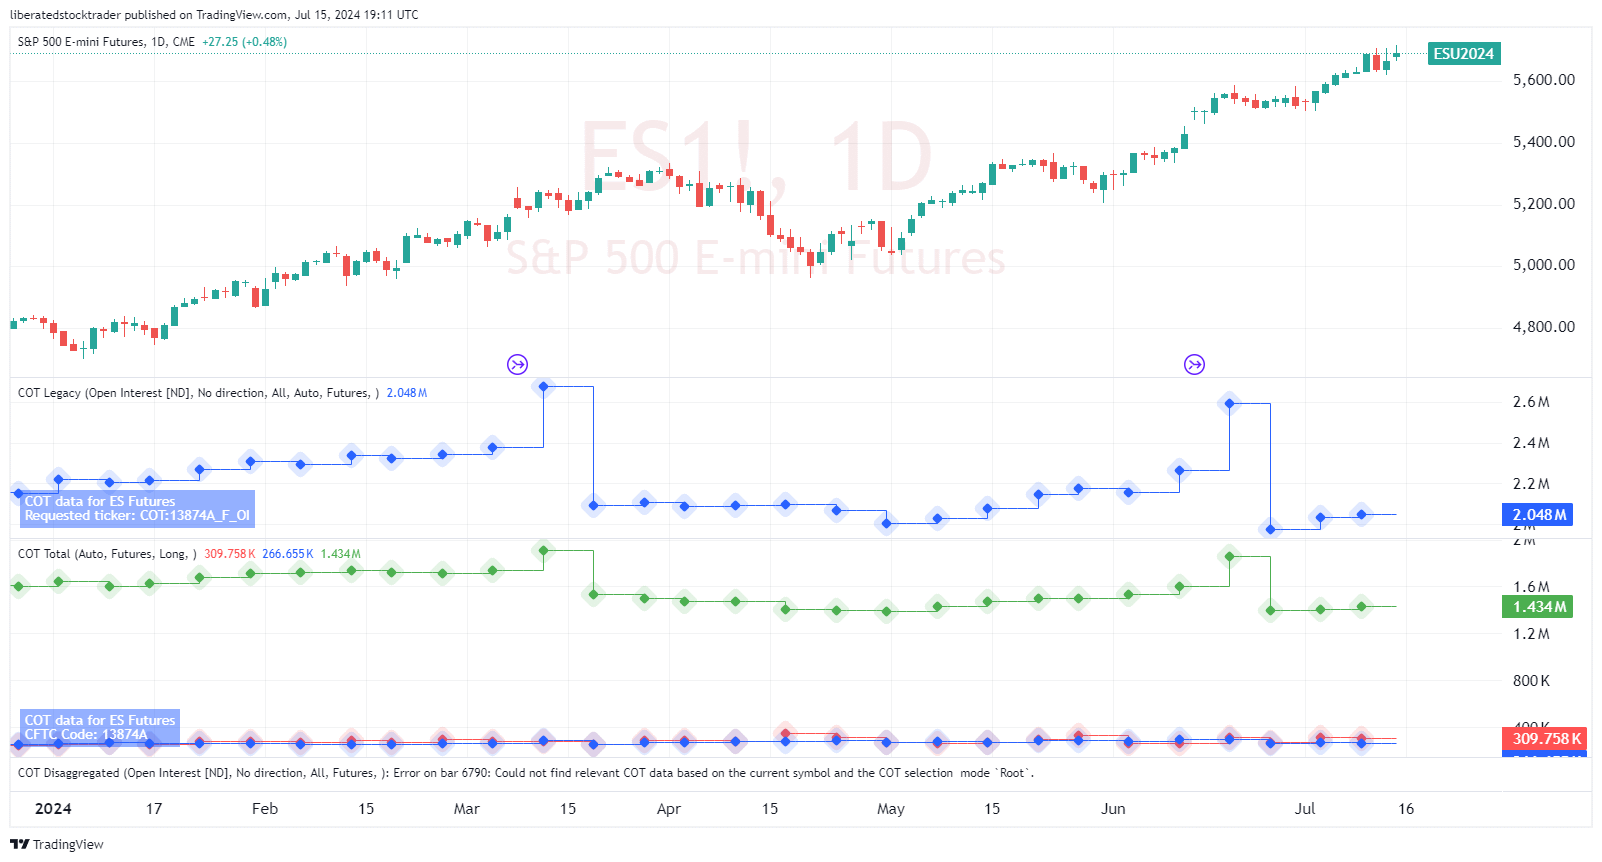
Below are the COT indicators charted for S&P 500 e-mini futures.
Analyze Futures & Commodities Like a Pro with TradingView
Identifying Trends and Reversals
Identifying trends and reversals is another critical aspect of analyzing market sentiment. By examining long and short positions combined with volume and price action, traders can predict future market movements. A trend continues as long as the positions and volume support the price direction.
The sentiment indicator derived from the COT report helps traders spot turning points. If the market shows extreme long or short positions, it may be overbought or oversold, signaling a potential reversal. Watching how major market participants adjust their positions can help traders anticipate these reversals and make informed decisions.
By understanding these key elements—traders’ positions, open interest changes, and price action—traders can better navigate market trends and reversals, making more strategic trading decisions.
Practical Trading Strategies
Practical trading strategies involving COT reports include using the data for specific currency trades and combining it with technical analysis indicators. This helps traders make informed decisions by helping them understand market trends and price actions.
Utilizing COT Data for Forex Trading
In forex trading, COT data helps traders understand the behavior of large market players. By analyzing the net positions of traders, especially in major currency pairs like EUR/USD and USD/JPY, traders can identify potential market trends.
For example, if the COT report shows a high number of long positions in EUR/USD, it suggests bullish sentiment. This can influence a trader’s decision to enter or exit a trade.
Steps:
- Access the COT report charts from TradingView.
- Identify the net positions of commercial and non-commercial traders.
- Compare historical COT data to current market conditions.
- Use this data to formulate trading strategies.
Incorporating Technical AnalysisTechnical analysis involves using indicators like RSI (Relative Strength Index), moving averages, and trend lines to predict future price movements. Combining COT data with technical analysis provides a clearer picture of the market.
For instance, if COT data indicates a bullish trend for USD/JPY, and the RSI shows the currency is not overbought, it signals a strong buy opportunity.
Key Indicators:
- RSI: Helps identify overbought or oversold conditions.
- Moving Averages: Show trend direction and potential reversal points.
- Trendlines: Aid in understanding support and resistance levels.
Using these indicators alongside COT data ensures that traders are not just relying on one method, leading to more robust trading strategies. Forex traders benefit from this dual approach by aligning their trades with market sentiment and technical signals.
Try TradingView, Our Recommended Tool for International Traders
Global Community, Charts, Screening, Analysis & Broker Integration

Global Financial Analysis for Free on TradingView
FAQ
What is the recommended software for Commitment of Traders analysis?
According to my research, TradingView has the most advanced and broadest selection of Commitment of Traders indicators in the financial industry. With 52 COT indicators covering multiple asset classes, TradingView is a solid choice for analyzing COT data. However, other software options are available, such as the CFTC website and various third-party websites that provide free or subscription-based COT data.
Why is the Commitment of Traders report important?
The COT report provides valuable information on market sentiment and trader positioning. This insight allows traders to understand if there is a consensus in the market and whether large speculators are bullish or bearish on a particular asset. By knowing this information, traders can align their trades with market sentiment and make more informed decisions when entering or exiting positions.
What is the significance of the Commitment of Traders (COT) report in trading?
The Commitment of Traders (COT) report is crucial for understanding market sentiment. It provides insights into the positions of major market participants like commercial traders, non-commercial traders, and small speculators. This information can help traders anticipate market trends and make informed decisions.
What steps should be taken to use the COT report for forex trading?
Interpreting the COT report for forex trading starts by analyzing the long and short positions of commercial and non-commercial traders. Compare these positions over time to spot trends. Please pay attention to extreme positions, as they often signal potential market reversals. Use this data alongside technical and fundamental analysis for a holistic approach.
How can traders use COT data for commodities such as gold?
For trading commodities like gold, traders should look at the positions of commercial hedgers and non-commercial speculators in the COT report. Commercial traders' positions often reflect hedging activities, while non-commercial traders' positions indicate speculative sentiment. Align trading strategies with the trends observed in these positions to enhance decision-making.
Can I utilize the COT report with platforms like TradingView?
On platforms like TradingView, traders can utilize the COT report by integrating the data into their technical analysis charts. Indicators based on COT data, such as the COT Index, can be added to price charts to visualize trader positions. This helps in identifying potential market turning points and confirming trends observed in price action.
Can you explain the usefulness of COT index readings for market analysis?
COT index readings are valuable for market analysis because they quantify trader positions on a scale, typically from 0 to 100. Higher readings suggest extreme bullish or bearish sentiment. Analyzing these readings helps traders gauge market sentiment and predict possible reversals. These readings are particularly useful for identifying overbought or oversold conditions.
Are there applications designed to track the Commitment of Traders report, and how effective are they?
Yes, TradingView provides real-time data and analysis tools to simplify the interpretation of COT data. These tools often include features like historical data comparison and alert systems for significant changes in trader positions. They effectively make COT data accessible and actionable for traders.
My thorough testing awarded TradingView a stellar 4.8 stars!
With powerful stock chart analysis, pattern recognition, screening, backtesting, and a 20+ million user community, it’s a game-changer for traders.

Whether you're trading in the US or internationally, TradingView is my top pick for its unmatched features and ease of use.
Explore TradingView – Your Gateway to Smarter Trading!