The Crab harmonic pattern in trading is a reversal pattern that can be identified by its distinctive shape, resembling a crab with its sideways movement.
The crab is considered a complex harmonic pattern in technical analysis. But is it profitable? This article will dive deep into the numbers to see if you should use them for trading.
Harmonic patterns, including the Crab Pattern, are based on precise Fibonacci retracement and extension levels. Traders who master the Crab Pattern can sometimes spot trend reversals before they happen, allowing them to enter or exit positions at optimal times.
Scott M. Carney first published the crab pattern in his book Harmonic Trading Volume One. However, when I read the book, no backtesting was performed, and there was little evidence that this pattern actually works consistently.
In this article, I will quantify the importance of the crab pattern in trading.
Key Takeaways
- Crab Patterns supposedly help predict trend reversals.
- Backtesting reveals severe unreliability.
- The crab is the least profitable harmonic pattern.
- The crab occurs so infrequently that it is not worth looking for.
- The crab averages a loss on a daily Nasdaq 100 chart.
- Traders can use a TradingView Harmonics indicator to identify and backtest the pattern on charts automatically.
Understanding the Crab Pattern
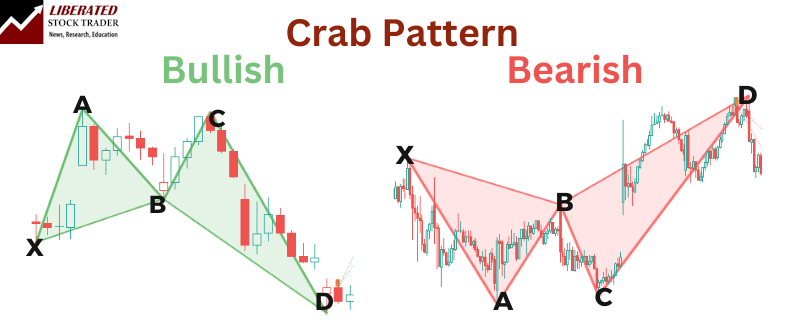
Crab patterns are precise harmonic patterns in trading that utilize Fibonacci ratios to predict potential reversal points in the market. These patterns include identifiable legs (XA, BC, and CD) and are classified into bullish and bearish types.
Identification of the Crab Pattern
A Crab Pattern consists of four specific legs: XA, AB, BC, and CD, conforming to Fibonacci ratios. The XA leg is the initial move, followed by an AB retracement. The BC leg further corrects before the final CD leg completes the pattern.
Fibonacci Ratios play a crucial role. The AB leg typically retraces 0.382 to 0.618 of the XA leg. The BC leg then retraces 0.382 to 0.886 of the AB leg. The CD leg extends to 2.618 to 3.618 of the BC leg, forming a potential reversal zone.
Automating Crab Pattern Identification
Harmonic patterns like the crab are difficult to identify manually. However, you do not need to manually search and draw them because TradingView has a special indicator that can detect all harmonic patterns automatically.
I have tested most of the harmonic indicators in TradingView, and the best one to enable is below.
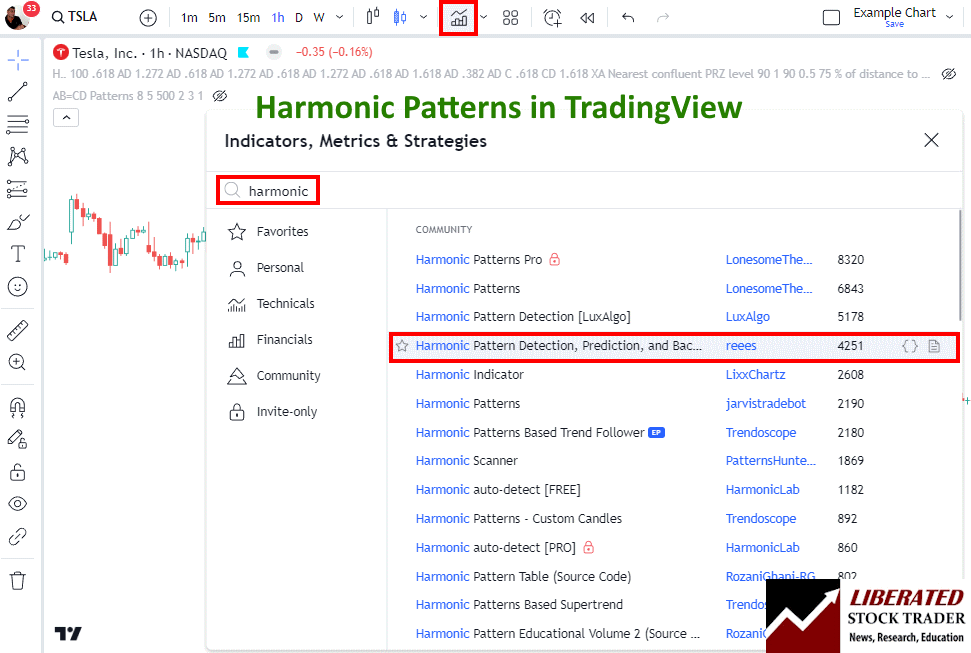
To enable automated harmonic pattern detection in charts, follow these steps:
- Visit TradingView
- Select Indicators -> Search for Harmonic
- Select Harmonic Pattern Detection by User “Reees”
This script not only identifies the patterns but also performs backtesting automatically.
Trading with Crab Patterns
Crab patterns help traders identify potential reversal zones (PRZ) to help improve trading outcomes. These patterns consist of specific points, including Point D, where traders can strategically enter or exit trades.
Bullish Crab Trading Strategy
This bullish pattern typically forms during a downtrend and signifies a potential reversal to an uptrend. It should be traded in a downtrend during a bull market.
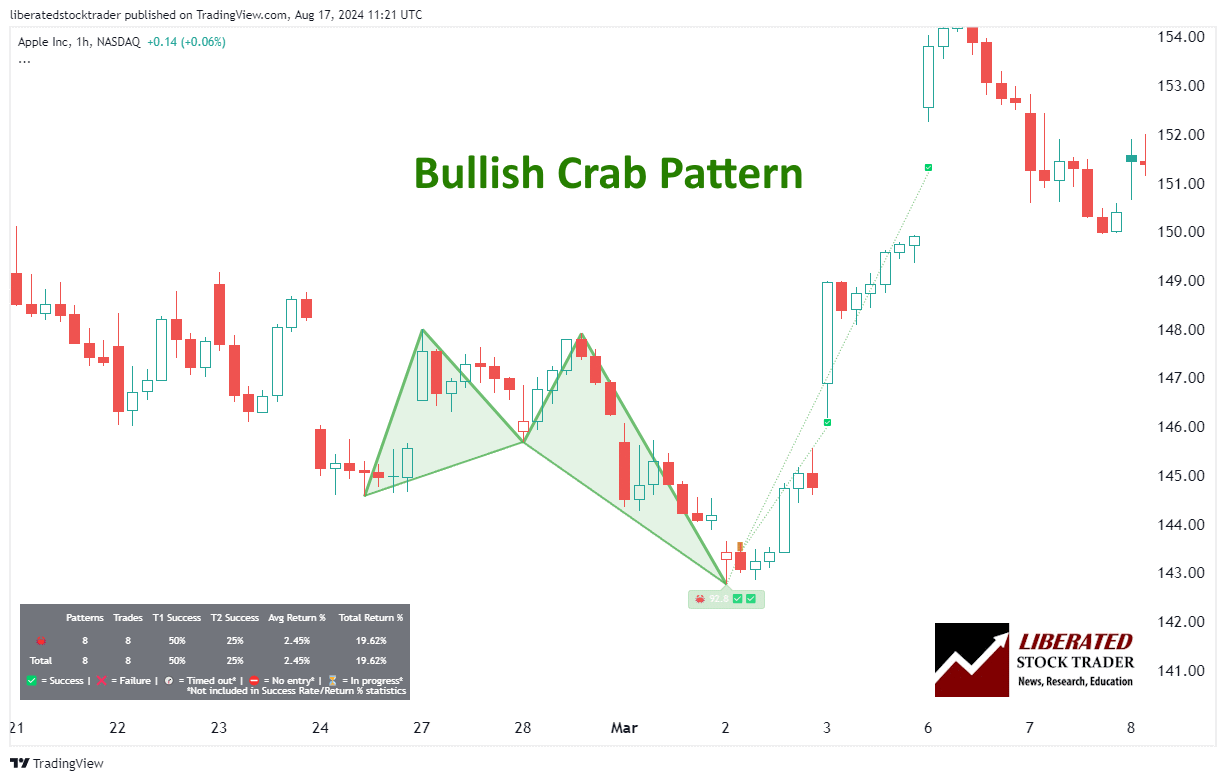
Bullish Crab Patterns start with an upward XA leg, indicating the initial price surge. The following legs (AB, BC) feature retracements within specified Fibonacci ratios. The CD leg concludes with a significant downward move, signaling a potential bullish reversal.
Automatic Crab Pattern Recognition with TradingView
6 Steps for Trading a Bullish Crab
- Ensure the pattern occurs in a downtrend in a bull market.
- When point D is confirmed, wait for a price increase to begin.
- Set a stop-loss between point D and point X.
- The initial price target is a Fibonacci retracement of 61.8% of point CD. That means if point C was $10 and D was $5, you can expect the price target to be approximately $8.09. ($10-$5)*0.618 + $5 = $8.09
- Once the price reaches the initial target, consider taking partial profits and trailing your stop-loss to secure any gains.
- If the price continues to rise, you can use additional Fibonacci retracement levels as potential exit points or set a new take-profit point at a key resistance level.
Is the Bullish Crab Reliable or Profitable?
No, based on our backtested trades, the bullish crab is not reliable or profitable. The problem is that the crab is so rare it is difficult to quantify. Based on 23 years of Nasdaq 100 exchange data, the bullish crab appeared only once, achieving a 15.07% loss on the trade.
Performance varies incredibly for each stock; for example, Microsoft had one trade in 2004, which returned 102%. Amazon.com Inc. has never had a bullish crab occurrence.
Bearish Crab Trading Strategy
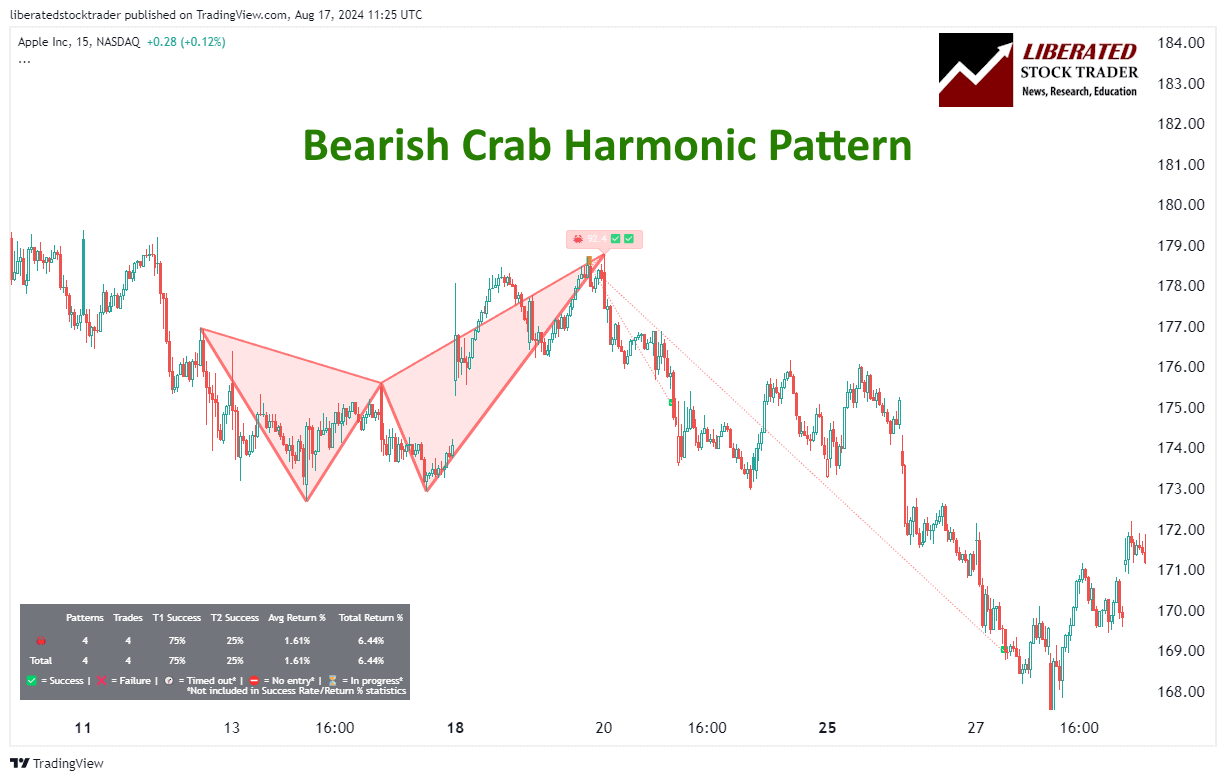
Bearish Crab Patterns begin with a downward XA leg. The subsequent legs (AB, BC) are correct and retraced as per harmonic rules. The final CD leg is marked by a sharp upward movement, suggesting a potential bearish reversal at the completion point.
Smarter Trading with TradingView
6 Steps for Trading a Bearish Crab
- Ensure the pattern occurs in an uptrend in a bear market.
- When point D is confirmed, wait for a price decrease to begin.
- Set a stop-loss between point D and point X.
- The initial price target is a Fibonacci retracement of 61.8% of point CD. That means if point C was $10 and D was $15, you can expect the price target to be approximately $13.36 ($15-$10)*0.618 + $10 = $11.91
- If the price reaches the initial target, consider taking partial profits and trailing your stop-loss to secure any gains.
- If the price continues to decrease, you can use additional Fibonacci retracement levels as potential exit points or set a new take-profit point at a key support level.
Is the Bearish Crab Reliable or Profitable?
No, based on our backtested trades, the bearish crab is not reliable or profitable. Again, the crab is so rare that it is difficult to quantify. Based on 23 years of Nasdaq 100 exchange data, the bullish crab appeared only once in 2010, achieving a 4.2% loss on the trade.
Performance varies incredibly for each stock; for example, Microsoft had one trade in 2004, which returned 18.48%. Amazon.com Inc. had one occurrence in 2016, which resulted in a 17.46% loss.
Significance of Fibonacci Ratios in Crab Patterns
Fibonacci ratios are integral to the Crab Pattern’s structure. These ratios guide the identification of levels where price reversals potentially occur. The CD leg extending significantly, often to 2.618 to 3.618 of the BC leg, indicates where the market is likely to reverse.
However, my testing of Fibonacci retracement trading demonstrates that it does not work reliably.
Do Crab Patterns Work?
No, you should avoid trading with the Crab pattern. My testing shows that it occurs infrequently and that when it appears, it is no better than flipping a coin.
Testing the crab on major Forex pairs like the USD/EUR yielded losses, or at best, tiny marginal gains of 0.59% average win on the EUR/USD that make it not worth trading.
Is the Crab Pattern a Good Trade?
No, in my opinion, the crab pattern occurs rarely, and when it provides a signal, it often results in minor losses.
What are the Most Reliable Chart Patterns?
Decades of research reveal the Head and Shoulders as the most reliable chart pattern, boasting an impressive 89% success rate. Following closely are the Double Bottom at 88% and the Triple Bottom and Descending Triangle at 87%. The Rectangle Top emerges as the most profitable, yielding an average win of 51%, closely trailed by the Rectangle Bottom at 48%.
Find out more about reliable chart patterns in this article.
Crab vs. Other Harmonic Patterns
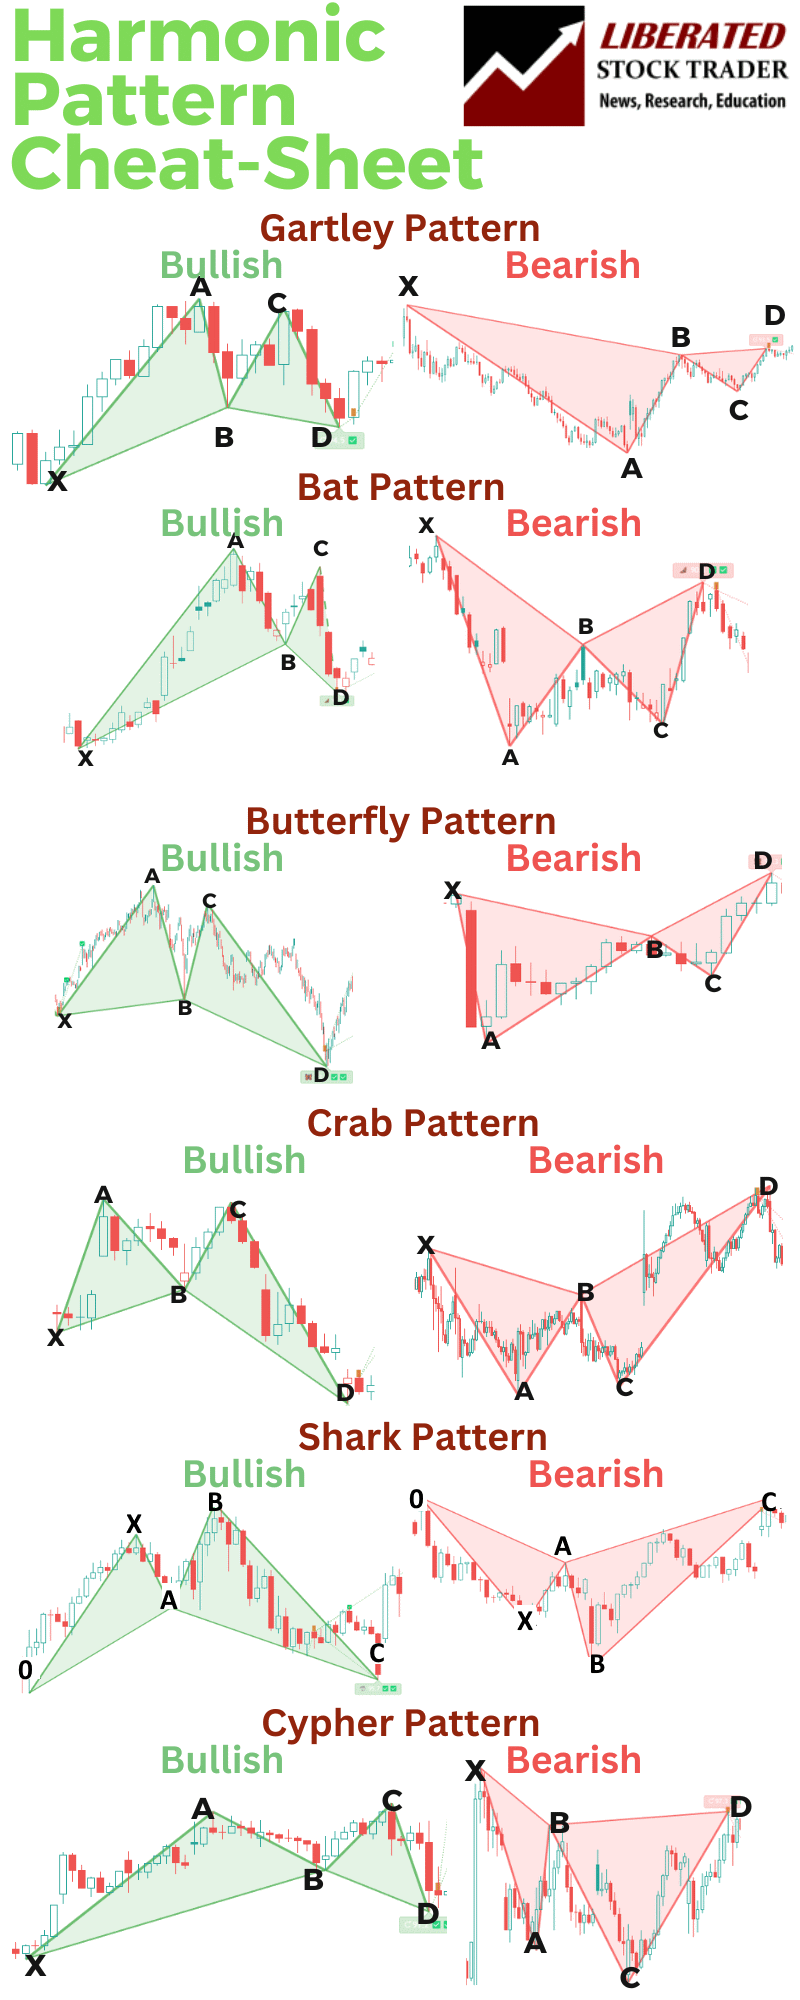
Crab patterns feature more complex Fibonacci retracements and extensions than other harmonic patterns, such as Butterfly, Gartley, Bat, Shark, and Cypher. This section compares these patterns, focusing on their key differences and relevance for technical indicators.
Butterfly vs. Crab Pattern
The bullish Butterfly Pattern works better than the crab pattern. The butterfly should only be used on daily charts for individual stocks where it has shown higher success rates.
Bearish crabs and butterflies should be avoided, as they are unreliable.
Gartley vs. Crab Pattern
The Gartley Pattern performs better than the crab but still has mixed reliability, with success rates between 36% and 60%.
Our Gartley backtesting shows it is most effective on daily timeframes, while intraday charts should be avoided. Based on my findings, I would not trade using the Gartley pattern.
Bat vs. Crab Pattern
The Bat pattern is a much better indicator than the crab. The bullish Bat averages a high 66% win rate on the Nasdaq 100, with a 6.24% average win per trade.
However, the bearish Bat should be avoided. It achieves its price target only 37% of the time and has a 1.68% average return per trade.
Harmonic Pattern Scanner and TradingView
The Harmonic Pattern Scanner is a powerful tool integrated into platforms like TradingView. It automates the detection of harmonic patterns, including the Crab Pattern, enhancing efficiency and accuracy.
Features of the Harmonic Pattern Scanner:
- Automated Detection: Identifies patterns like the XA leg and the AB=CD pattern.
- Integration with TradingView: Offers real-time charting and analysis.
- Technical Indicators: Combines with other indicators for robust analysis.
- Alerts: Provides timely trading signals to capitalize on potential reversals.
Try TradingView, Our Recommended Tool for International Traders
Global Community, Charts, Screening, Analysis & Broker Integration

Global Financial Analysis for Free on TradingView
Our Harmonic Patterns Cheat Sheet
FAQs
What is the best software for trading harmonic patterns?
After extensive testing, I personally use TradingView to backtest and trade harmonic patterns like the crab. Its custom indicator, "Harmonics," automatically detects all harmonic patterns.
What distinguishes the Deep Crab from other harmonic patterns?
The Deep Crab pattern is unique due to its extreme Fibonacci extensions. Unlike other harmonic patterns, point B retraces to 0.886 of XA, and point D extends to 3.618 of XA. These measurements distinguish it from similar patterns.
How can the Crab pattern be identified in trading charts?
There is no point in trying to identify the crab pattern manually, as it occurs once every ten years on a daily chart. Instead, TradingView's harmonic pattern indicator can be used to automate the process.
What strategies can traders use when applying the Crab pattern?
Traders often use stop-loss orders at or just beyond points X or D. They look for confirmation from other technical indicators such as RSI or MACD. This pattern also pairs well with trendline analysis for more robust entry and exit points.
How does the Bearish Crab pattern signal potential price movement?
The Bearish Crab pattern signals potential downward price movement at the completion of point D. However, it is a poor-performing indicator that should be avoided.
What is the accuracy and reliability of the Crab pattern?
According to my testing, the Crab pattern's accuracy and reliability are incredibly low, and traders should not use it.
Can the Crab pattern be used for cryptocurrency trading?
Yes, the Crab pattern can be used for cryptocurrency trading, but it occurs infrequently and causes small losses. On 1-minute BITUSD charts, the crab resulted in 4 trades averaging a 3.62% loss.