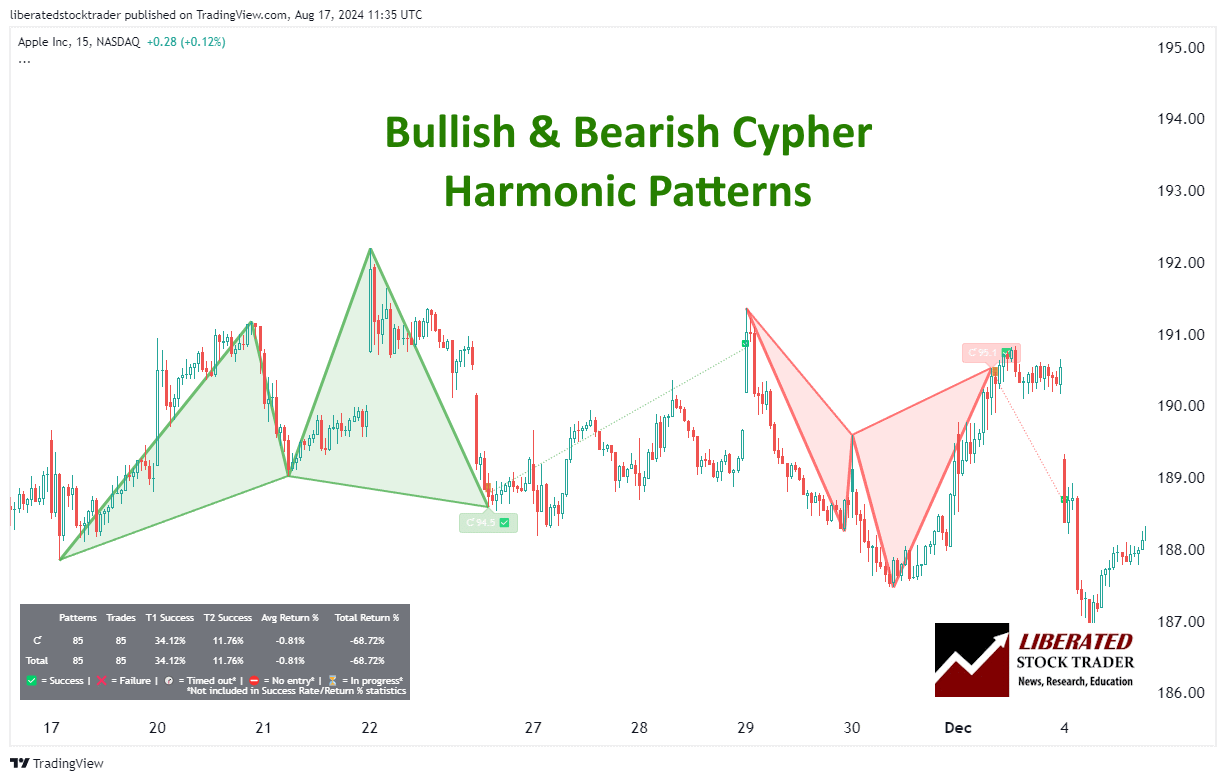
The cypher is a price pattern formation within the harmonic technical analysis that has, until now, been unproven with testing.
In technical analysis, the cypher pattern indicates potential price reversal zones (PRZ) with four Fibonacci swings labeled X-A, A-B, B-C, and C-D. Our testing shows it is profitable in the right conditions.
But is trading the cypher worth it? Is it profitable?
My research has all the answers.
Key Takeaways
- Darren Oglesbee is credited with uncovering the cypher pattern, yet his book does not include any backtesting performance outcomes.
- The bullish cypher is one of the most profitable harmonic patterns.
- The bullish cypher proves profitable, hitting its target 73% of the time, with an average trade gain of +5.24% on the Nasdaq 100 index.
- Testing the bearish cypher showed it should be avoided as it is unreliable.
- Identifying the cypher pattern manually on charts is complicated and involves recognizing specific Fibonacci ratios.
- Traders can use a TradingView Harmonics indicator to identify and backtest the pattern on charts automatically.
Understanding the Cypher Pattern
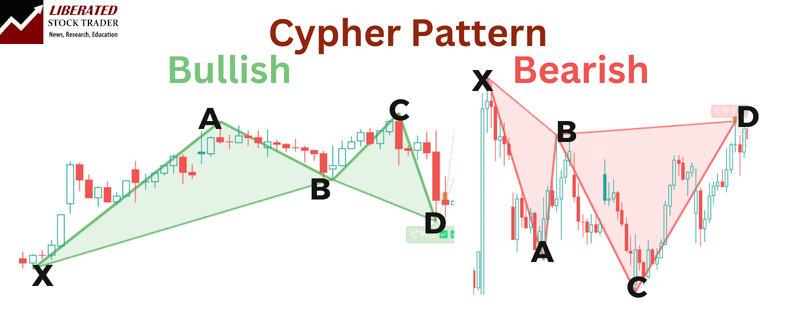
Cipher patterns are harmonic chart patterns composed of four legs (XA, AB, BC, and CD). They are often used in trading to predict reversals. They rely heavily on Fibonacci ratios for their formation and identification, which helps determine potential entry points.
Identifying the Cypher Pattern
Like all harmonic patterns, the cipher chart patterns are composed of four legs (XA, AB, BC, and CD). They are often used in trading to predict reversals. They rely heavily on Fibonacci ratios for their formation and identification, which helps determine potential entry points.
| Cypher Leg | Description | Fibonacci Ratios |
|---|---|---|
| XA | The initial leg forms the base of the pattern. | 0.382, 0.618 |
| AB | Follows XA, retracing part of the distance. | 0.382, 0.886 |
| BC | Extends from B, creating the next movement in the sequence. | 1.618 |
| CD | Completes the pattern, leading to a reversal point. | 1.272, 1.414 |
Automating Cypher Pattern Identification
Identifying harmonic patterns such as the cypher can be challenging without automation. Thankfully, there’s no need for manual effort, as TradingView offers a dedicated indicator that automatically identifies all harmonic patterns.
I have tested most of the harmonic indicators in TradingView, and the best one to enable is below.
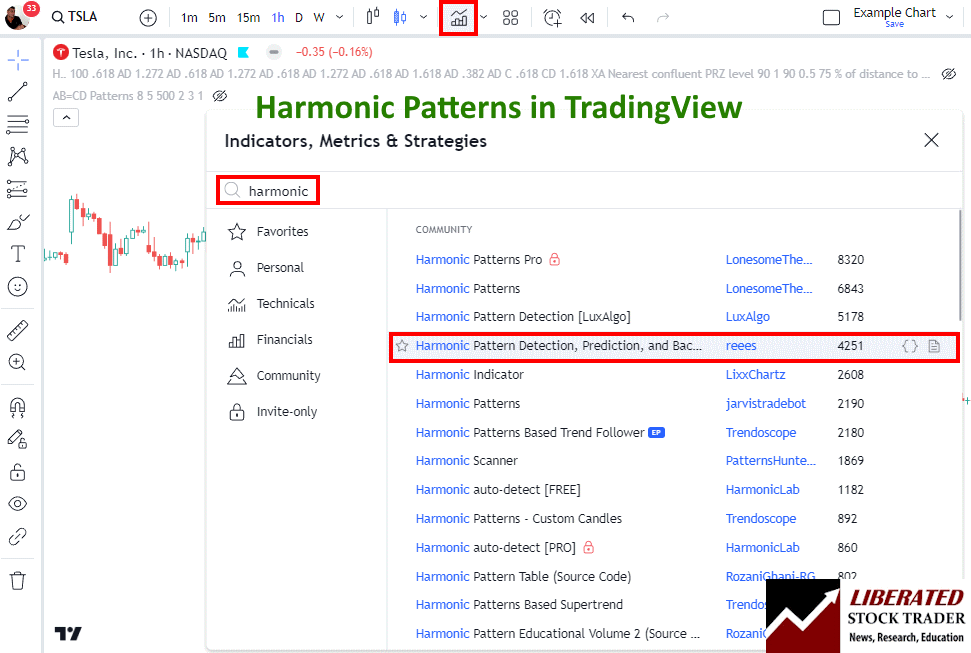
To enable automated harmonic pattern detection in charts, follow these steps:
- Visit TradingView
- Select Indicators -> Search for Harmonic
- Select Harmonic Pattern Detection by User “Reees”
This script not only identifies the patterns but also performs backtesting automatically.
Trading Cypher Patterns
Cypher patterns in trading help traders identify potential reversal zones (PRZ) to help improve trading outcomes. These patterns consist of specific points, including Point D, where traders can strategically enter or exit trades.
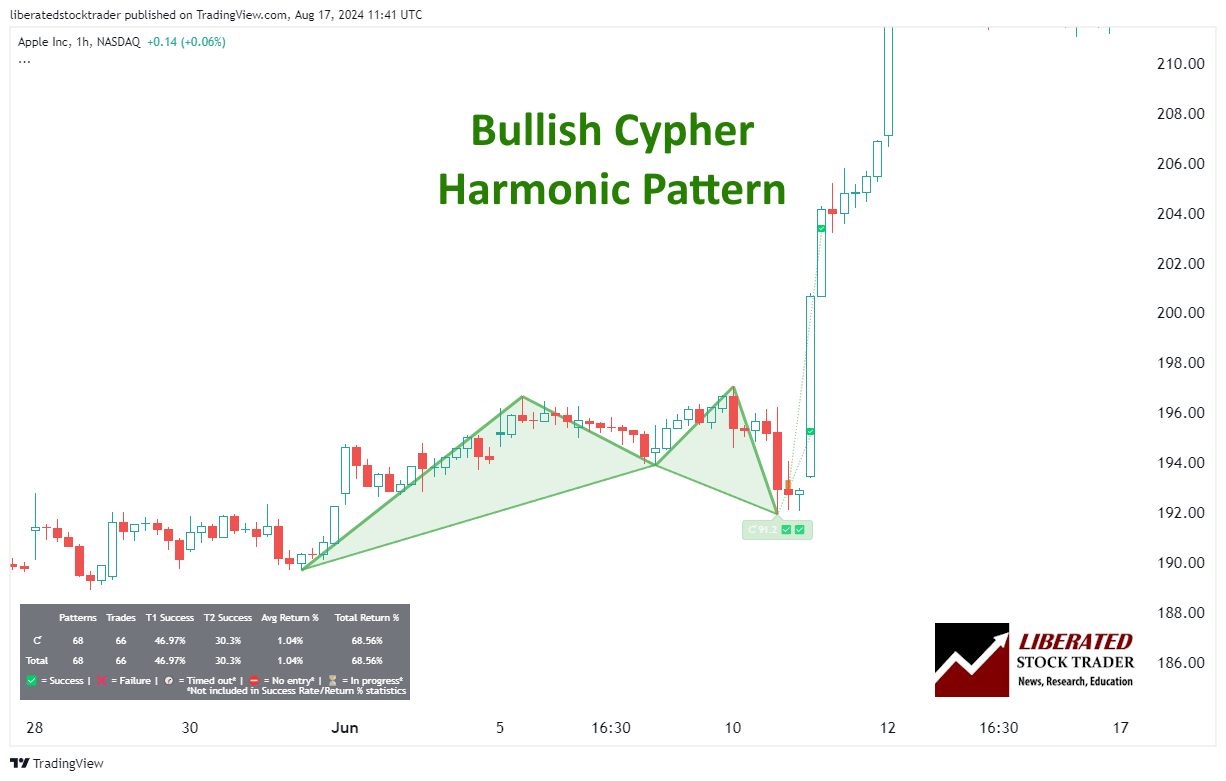
Trading Bullish Cypher
This bullish pattern typically forms during a downtrend and signifies a potential reversal to an uptrend. It should be traded in a downtrend during a bull market.
Automatic Cypher Pattern Recognition with TradingView
6 Steps for Trading a Bullish Cypher
- Ensure the pattern occurs in a downtrend in a bull market.
- When point D is confirmed, wait for a price increase to begin.
- Set a stop-loss between point D and point X.
- Once the price reaches the initial target, consider taking partial profits and trailing your stop-loss to secure any gains.
- If the price continues to rise, you can use additional Fibonacci retracement levels as potential exit points or set a new take-profit point at a key resistance level.
Is the Bullish Cypher Reliable or Profitable?
Yes, based on our backtested trades, the bullish cypher is reliable. Based on 23 years of Nasdaq 100 exchange data, it achieved its price target 73% of the time, with a 5.24% average return per trade. On the S&P 500, it hit 61% of price targets with an average return of 2.17% per trade.
Performance varies incredibly for each stock; for example, Tesla had a 0% win rate and a -9.56% average loss per trade.
Trading the bullish cypher with Microsoft Corp. would have resulted in 75% of trades hitting the price target, which produced an average return per trade of 7.97%.
Because of these mixed results, traders should ensure they trade stocks in a strong uptrend.
Trading Bearish Cyphers
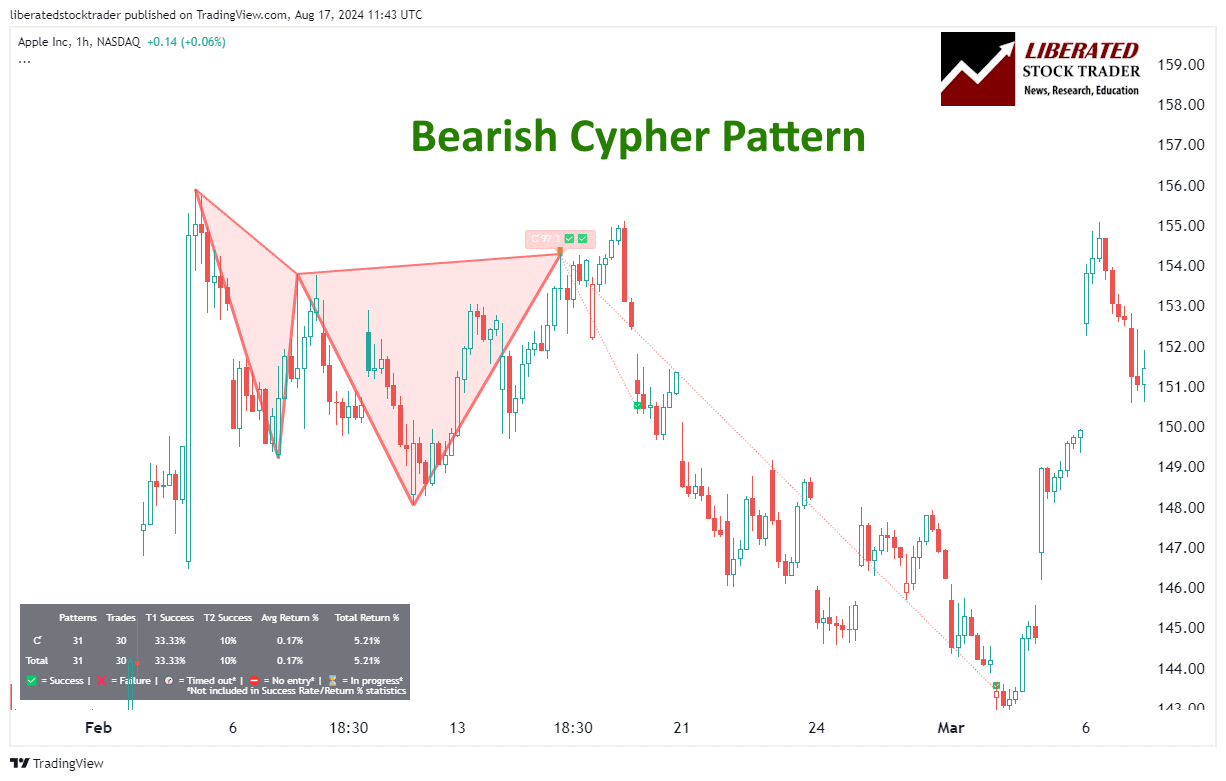
This bearish pattern forms in an uptrend, signaling a potential move to the downside. The structure is similar but in reverse, indicating sell positions at Point D.
6 Steps for Trading a Bearish Cypher
- Ensure the pattern occurs in an uptrend in a bear market.
- When point D is confirmed, wait for a price decrease to begin.
- Set a stop-loss between point D and point X.
- If the price reaches the initial target, consider taking partial profits and trailing your stop-loss to secure any gains.
- If the price continues to decrease, you can use additional Fibonacci retracement levels as potential exit points or set a new take-profit point at a key support level.
Is the Bearish Cypher Reliable or Profitable?
No, trading the bearish cypher pattern is not reliable. Based on our backtested trades on 23 years of Nasdaq 100 exchange data, it achieved its price target only 16% of the time, with a 3.67% average loss per trade. On the S&P 500, it hit 60% of price targets with an average return of 3.48% per trade.
Performance varies for each stock; for example, Netflix had a 60% win rate and a 14.29% average win per trade.
However, trading the bearish cypher with Amazon.com Inc. would have resulted in only 33% of trades hitting the price target, which produced an average loss per trade of -3.69%.
Because of these mixed results, traders should use this pattern carefully and fully test it before use.
Setting Stop Losses and Take Profit
Utilizing Stop-loss Orders is vital for effective risk management in cypher pattern trading. Traders typically position stop-loss orders just below the PRZ for bullish patterns and above the PRZ for bearish patterns, thereby reducing potential losses in case of adverse market movements.
To optimize profitability, Take Profit levels should be strategically set at Fibonacci retracement points based on the pattern’s swing levels:
- Initial level: 38.2%
- Subsequent level: 61.8%
Implementing these levels enables traders to secure profits progressively, thus improving the risk-reward ratio.
Try TradingView, Our Recommended Tool for International Traders
Global Community, Charts, Screening, Analysis & Broker Integration

Global Financial Analysis for Free on TradingView
Combining Cypher Patterns With Other Indicators
Using highly profitable chart indicators, such as VWAP, Stochastics, and the Alligator in cypher pattern trading, could strengthen the trading strategy. You can test these combinations using TradingView.
Trading Cypher in Forex and Futures
Cypher patterns can also be used in Forex trading. My backtesting on the EUR/USD revealed a 57% chance of the price target being achieved and a 1.31% average trade return. For the USD/EUR, the success rate was 53%, with a 0.66% average return per trade.
Do Cypher Patterns Work?
Yes, cypher patterns work well on major indices, hitting targets 60% of the time and averaging a 2.5% average profit per trade. On individual stocks, the profit per trade can vary widely from +10% to -5% losses.
Testing the cypher on major Forex pairs did yield strong results, with an average win percentage of 53% and an average return between 0.6% and 1.3%.
Is the Cypher Pattern a Good Trade?
Yes, in my opinion, the bullish cypher pattern has solid testing results, with some highly profitable trades and some losers. However, the bearish cypher should be avoided, as it leads to many losses. Ensure you test before trading this pattern.
What are the Most Reliable Chart Patterns?
Decades of research reveal the Head and Shoulders as the most reliable chart pattern, boasting an impressive 89% success rate. Following closely are the Double Bottom at 88% and the Triple Bottom and Descending Triangle at 87%. The Rectangle Top emerges as the most profitable, yielding an average win of 51%, closely trailed by the Rectangle Bottom at 48%.
Find out more about reliable chart patterns in this article.
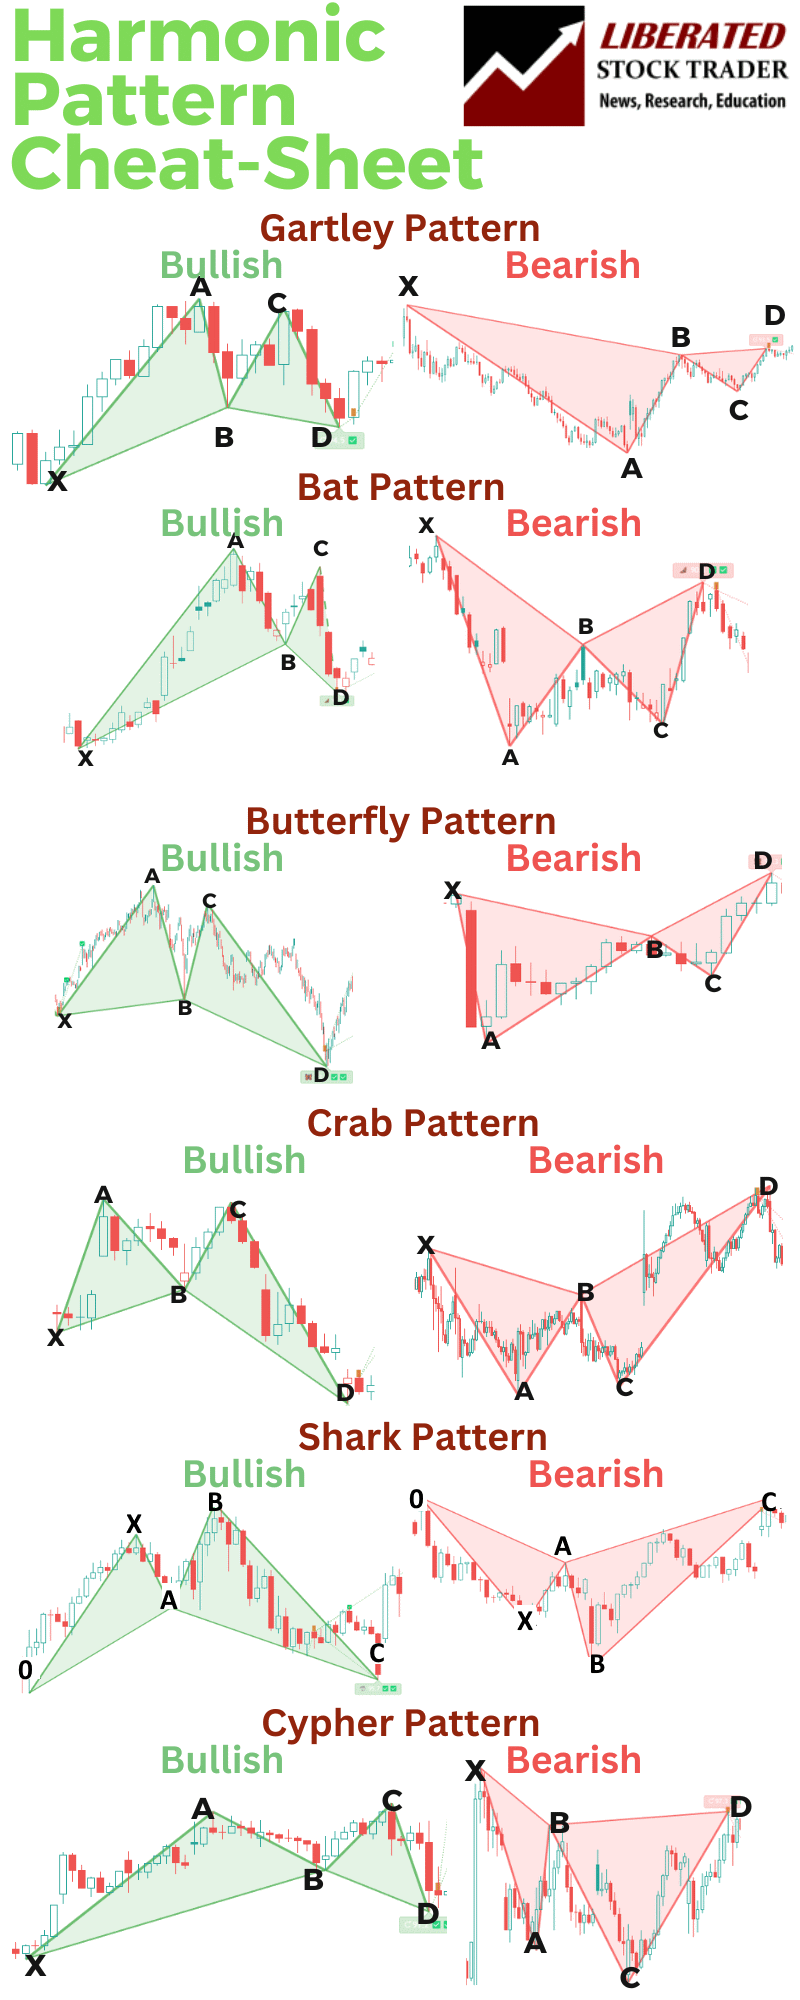
The six key harmonic patterns in technical analysis are Gartley, Bat, Crab, Butterfly, Shark, and Cypher. While the cypher pattern is rarely used, understanding all patterns is crucial for harmonic traders.
Our Harmonic Patterns Cheat Sheet
FAQs
What is the best software for trading a cypher chart pattern?
After extensive testing, I personally use TradingView to backtest and trade harmonic patterns like the cypher. Its custom indicator, Harmonics, automatically detects all harmonic patterns.
What are the ideal target levels for the Cypher pattern?
When trading the Cypher pattern, the first target is generally set at the 38.2% Fibonacci retracement of the CD leg. The second target is often set at the 61.8% retracement. These levels help traders manage their exit points efficiently.
What are the rules for identifying a Cypher pattern?
To identify a Cypher pattern, traders look for the following Fibonacci retracements: XA leg retraces 38.2% to 61.8% of the XA move. BC leg retraces 38.2% to 88.6% of the AB move. CD leg extends from 127% to 141.4% of the XA move.
How do you identify a cypher pattern on charts?
I recommend using TradingView to identify cypher patterns automatically. Doing it manually is exceptionally time-consuming and prone to errors.
How does the Cypher differ from the Gartley pattern?
The Cypher pattern requires the CD leg to extend beyond the XA wave, between 127% and 141.4%. In contrast, the Gartley pattern does not require the extensions of the CD leg to reach that far. These key differences aid traders in distinguishing between the two patterns accurately.
What's the difference between a bullish and bearish Cypher pattern?
A bullish Cypher pattern is characterized by a significant upward move followed by retracement and consolidation before another rise. Conversely, a bearish Cypher pattern starts with a notable downward move, then partial retracement, and further decline. Recognizing these traits helps traders make informed decisions based on market trends.
How to utilize the Cypher pattern within Harmonic trading?
In Harmonic trading, the Cypher pattern is used to predict market reversals. Traders look for this pattern at key Fibonacci levels to time entries and exits effectively. Utilizing it within Harmonic trading helps identify potential reversal zones with higher precision.
What is the historical accuracy of cypher patterns?
Cypher patterns' historical accuracy is among the highest among Harmonic patterns. Our studies and backtesting show a success rate of around 60%, making them a reliable tool in a trader's technical arsenal.