Barry D. Moore, founder of LiberatedStockTrader.com, independently researches the accuracy and reliability of stock chart patterns, indicators, and strategies. During his testing, he discovered that fractal patterns are incredibly good indicators for trading.
Fractals provide a unique way to understand patterns in asset price movements. In financial terms, fractals help identify potential turning points and trends.
Based on 2,510 tested trades on 80 years of exchange data, I can confirm trading fractal patterns is profitable, with an average reward-to-risk ratio rate of 1.5 across all timescales.
In this article, I will explain fractals and show you how to test them and trade them independently. I will also share the best settings and all the performance metrics.
Key Takeaways
- Fractals help identify market reversals and trends.
- My testing shows fractals are profitable over time, yielding a profit expectancy of 0.43 cents per dollar invested.
- Fractals are a simple 5-bar candle pattern signifying a reversal in trend.
- 57% of fractal trades are winners, and 43% lose.
Understanding Fractal Patterns
Fractals are repetitive patterns found in nature and mathematics. They help traders identify key points on price charts and provide natural indicators of market trends.
Fractals are geometric shapes that repeat at different scales. In trading, these patterns are used to predict price movements. A basic fractal pattern includes a series of five bars or candles on a price chart. The middle bar must have the highest high or the lowest low, with two lower highs or higher lows on either side.
Automate Fractal Detection & Trading with TrendSpider
You can use fractals to find potential reversal points in the market. By identifying these patterns, they can make more informed trading decisions. This knowledge of fractal geometry helps in recognizing complex chart patterns that repeat over time.
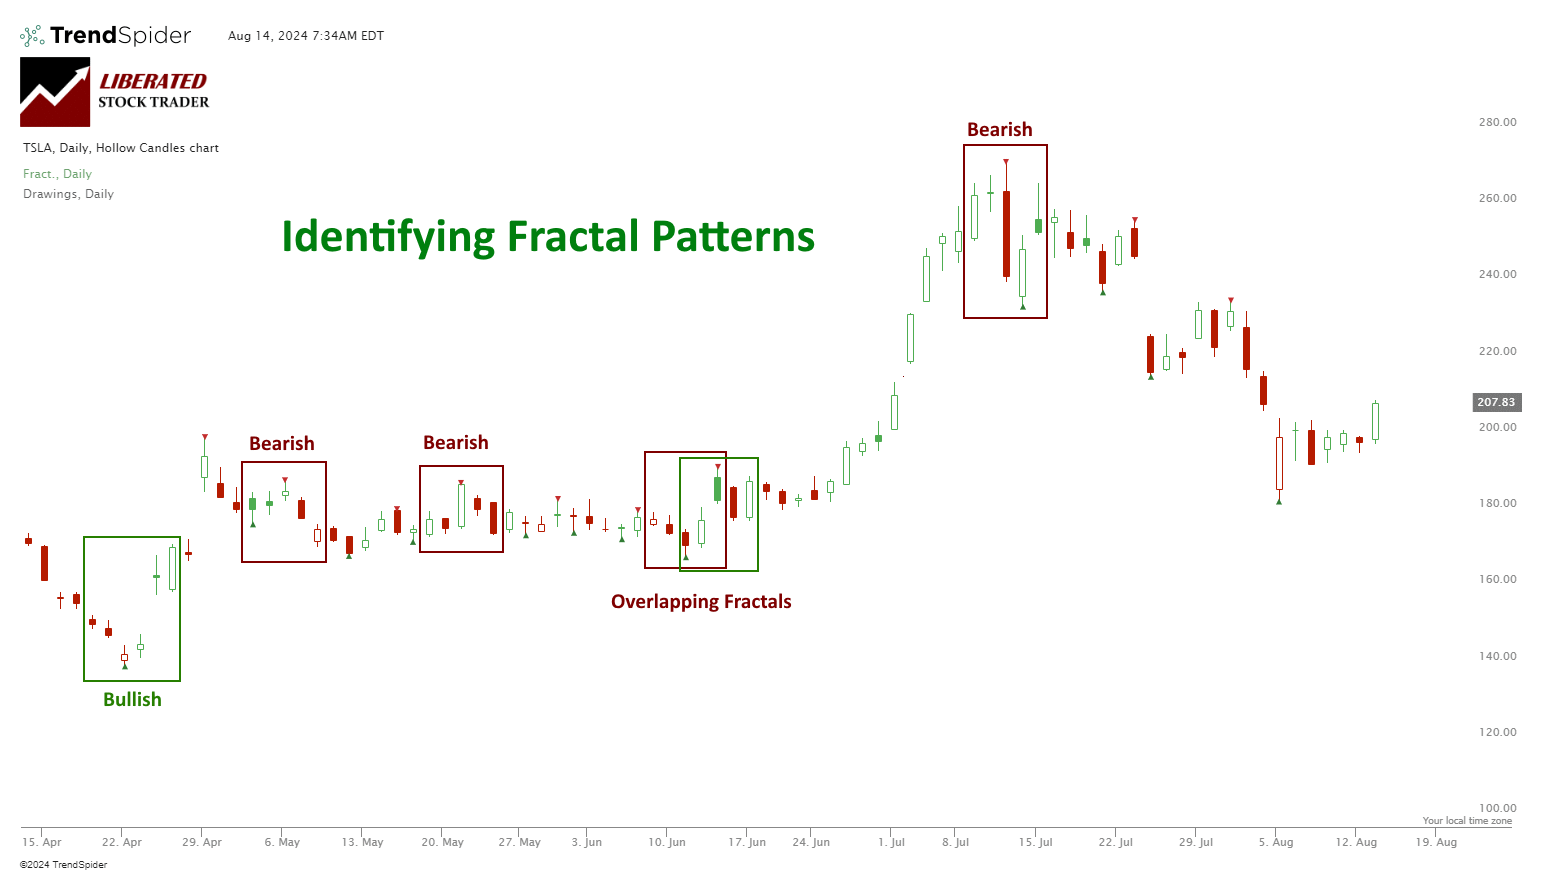
Identifying Fractals on Price Charts
To identify fractals on a price chart, look for the five-bar pattern. For a buy fractal, the middle bar should have the lowest low flanked by two higher lows. For a sell fractal, the middle bar should have the highest high, flanked by two lower highs.
Steps to Identify Fractals:
- Look for five consecutive bars.
- Check if the middle bar is the highest or lowest.
- Confirm the two bars before and after follow the pattern.
Understanding these points allows traders to spot potential entries or exits based on fractal signals.
Automatically Detecting Fractal Patterns
You can automatically identify fractal patterns using TradingView or TrendSpider. Open a chart, select Add indicator, and select Williams Fractals. I personally use TrendSpider for trading, backtesting, and automating trading because it is powerful yet easy to use due to its code-free pattern recognition and backtesting engine.
My thorough testing awarded TradingView a stellar 4.8 stars!
With powerful stock chart analysis, pattern recognition, screening, backtesting, and a 20+ million user community, it’s a game-changer for traders.

Whether you're trading in the US or internationally, TradingView is my top pick for its unmatched features and ease of use.
Explore TradingView – Your Gateway to Smarter Trading!
Trading Fractal Patterns
A solid fractal trading strategy starts with detecting bullish and bearish fractals. Traders look for fractals that indicate market reversals. A bullish fractal signals a potential upward trend, while a bearish fractal signals a potential downward trend. Our testing places a buy order on a bullish fractal completion and a sell order on a bearish fractal.
You can combine fractals with other indicators like moving averages or the Relative Strength Index (RSI), but I have seen no evidence that this strengthens the strategy.
Identify Entry and Exit Points
Identifying the right entry and exit points is crucial for successful trades. Bullish fractals often appear at the bottom of a price chart, indicating a buy signal. Conversely, bearish fractals appear at the top, signaling a sell. Even though the fractal is detected on the chart at the lowest or highest point, the fractal pattern is only completed two bars later. This means the fractal lags price by two days on a daily chart. However, this delay does not impact the performance.
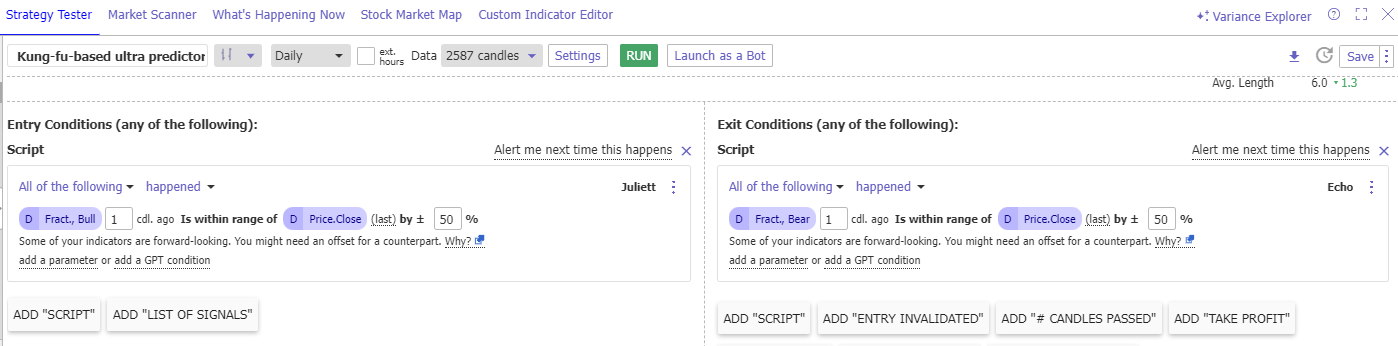
Backtest Fractals with TrendSpider
You can use TrendSpider to easily backtest fractals on multiple timeframes and assets (Forex, Stocks, Futures) without coding. To set up a fractal backtesting strategy in TrendSpider, follow these steps:
- Register for TrendSpider.
- Select Strategy Tester > Entry Condition > Add Parameter > Condition > Indicator > Fractal Bull > -1 Candle Ago > Is Within Range 50% > Price Close > Within Range 50%.
- For the Sell Criteria, select > Add Script > Add Parameter > Condition > Add Parameter Indicator > Fractal Bear > -1 Candle Ago > Is Within Range 50% > Price Close > Within Range 50%.
- Finally, click “RUN.”
Fractal Trading Results
I performed three initial tests on fractal patterns: the Nasdaq 100 (QQQ), the S&P 500 (SPY), and Tesla Inc. (TSLA), all daily charts spanning ten years of data.
The table below shows impressive results: trading a 5-day fractal pattern yielded superior net performance versus the asset and an average 1.66 reward-to-risk ratio. Using fractals to trade Tesla stock was the best performer, with the fractals yielding 4,179% versus buy-and-hold with 1,186%.
| Fractal Backtest Results | QQQ | SPY | TSLA |
| Data Analyzed | 10.2 years | 10.2 years | 10.2 years |
| Net Perf, all | 574.50% | 311.50% | 4179.70% |
| Asset Perf. | 392.50% | 175.40% | 1186.00% |
| Positions | 259 | 269 | 282 |
| Wins | 63% | 55% | 51% |
| Losses | 37% | 45% | 49% |
| Max DD | -22.00% | -14.20% | -56.30% |
| Average Win | 2.30% | 1.79% | 6.52% |
| Average Loss | -1.79% | -0.99% | -3.40% |
| Average Return | 0.78% | 0.55% | 1.63% |
| Rew/Risk Ratio | 1.28 | 1.8 | 1.91 |
| Expectancy | 0.4 | 0.6 | 0.5 |
| Exposure | 70.60% | 65.30% | 61.40% |
| Sharpe | 1.67 | 1.54 | 1.04 |
| Sortino | 2.56 | 2.82 | 1.82 |
| CAGR, 5y | 35.90% | 27.40% | 110.20% |
| CAGR, 5y (Asset) | 31.50% | 17.90% | 66.60% |
| Trades/Month | 4.2 | 4.4 | 4.6 |
Data Provided Using TrendSpider’s Excellent Backtesting Software
According to my testing, fractals are one of the best patterns traders can utilize in an investing strategy.
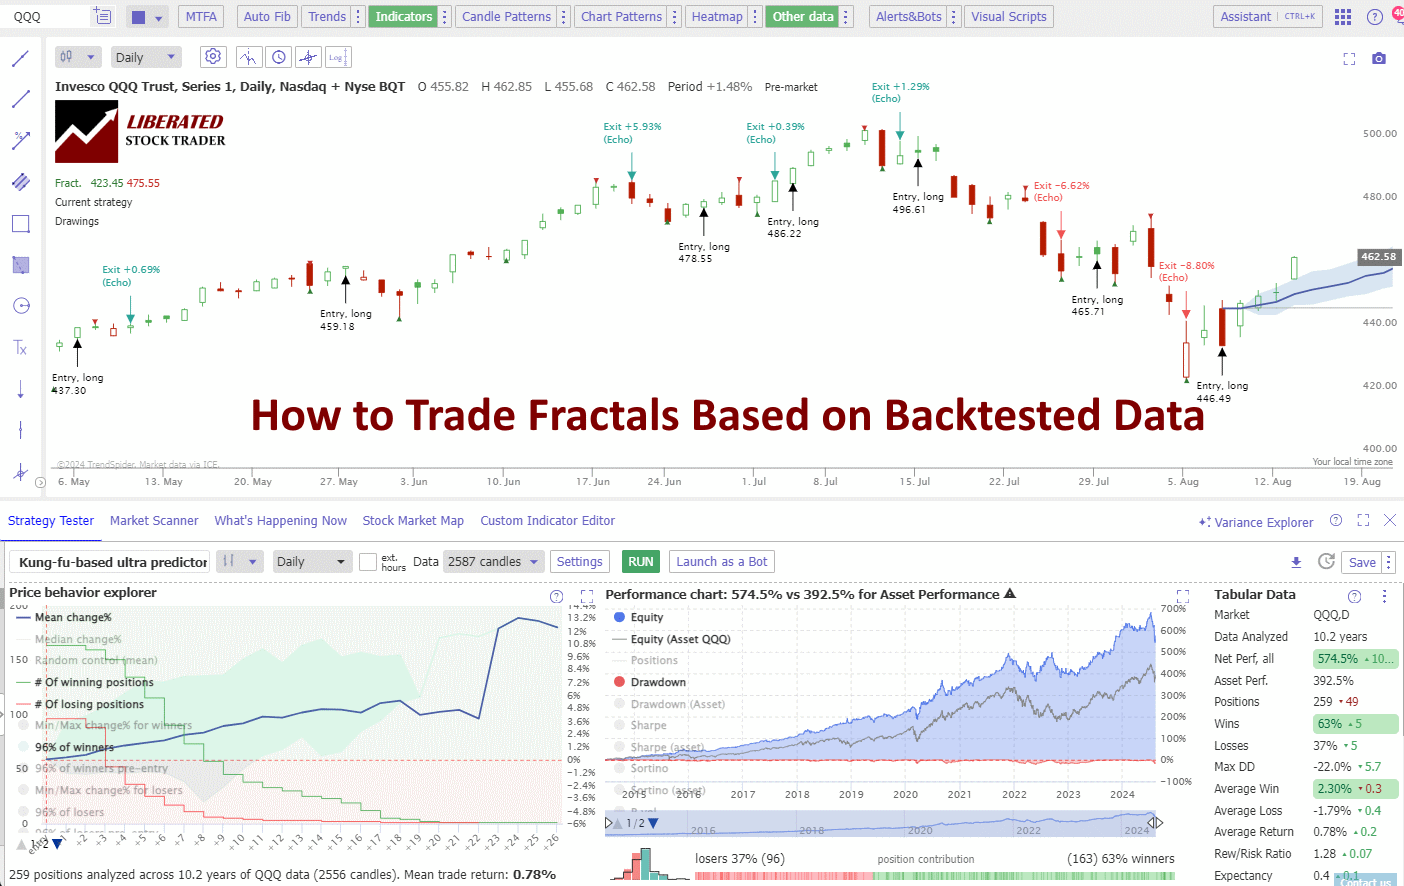
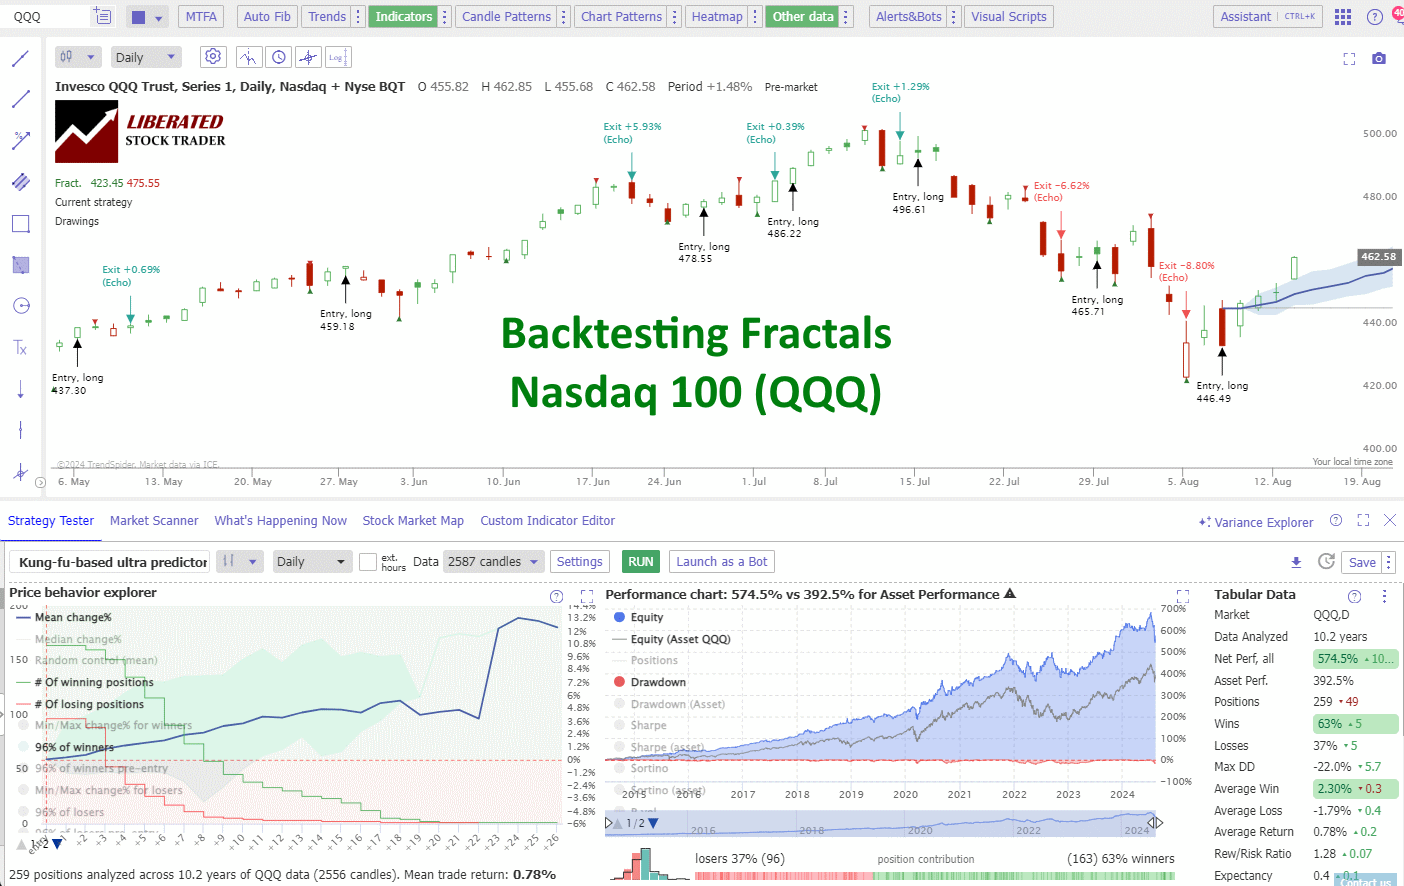
Performance Nasdaq 100 (QQQ)
The Nasdaq 100 fractal performance was very good; over ten years, the strategy outperformed the index by 180%, with 63% of trades winning and a reward-to-risk ratio of 1.28. The compound 5-year annual growth rate was 35.9% versus the QQQ’s 31.5%. The chart below reveals further details.
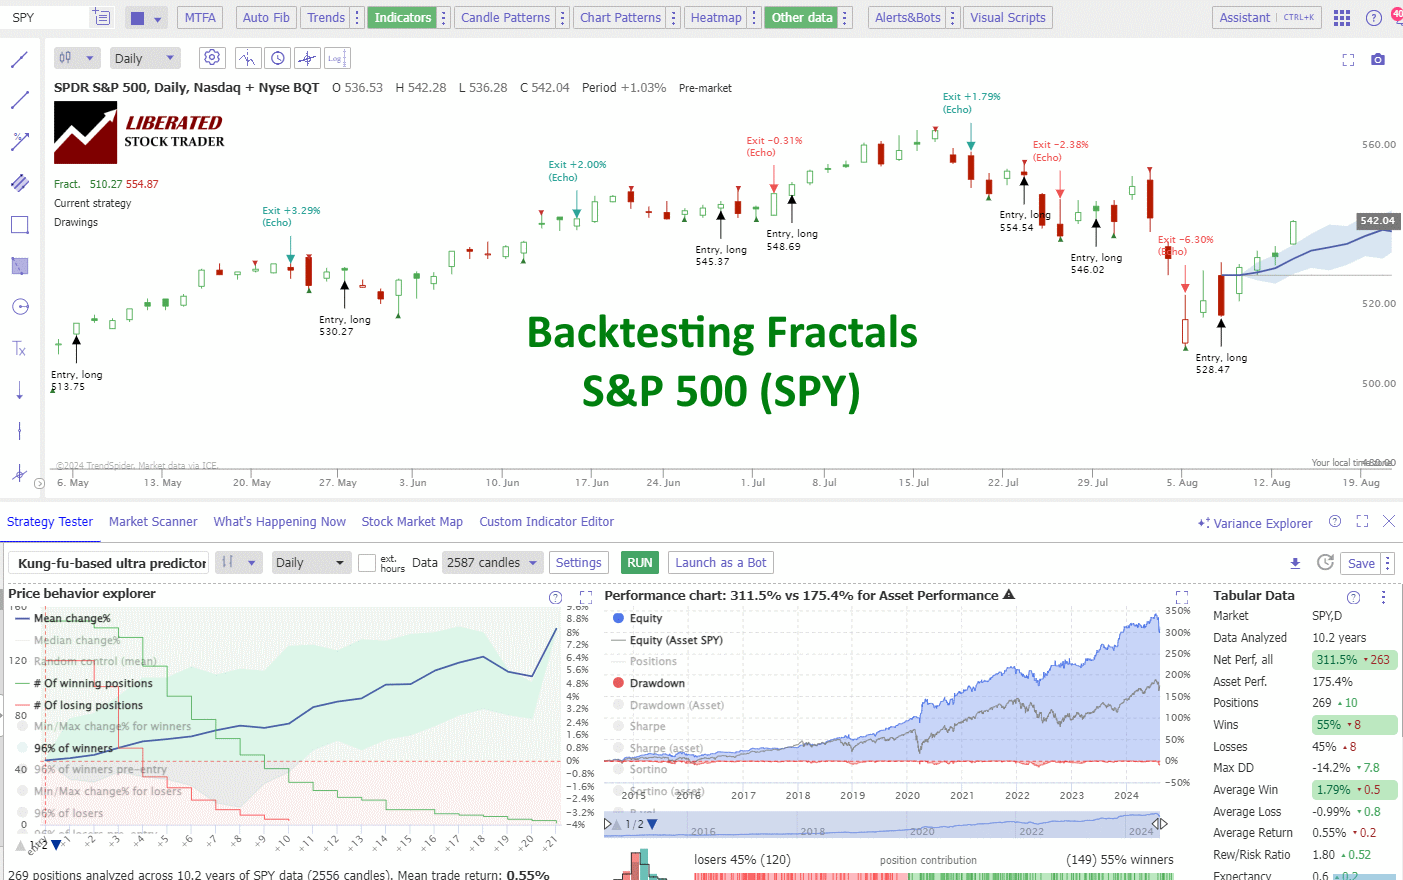
Performance S&P 500 (SPY)
The S&P 500 fractal performance was also good; over ten years, the strategy outperformed the index by 136%, with 55% of trades winning and a high reward-to-risk ratio of 1.80. The compound 5-year annual growth rate was 27.40% versus the index’s 17.90%. The chart below reveals further details.
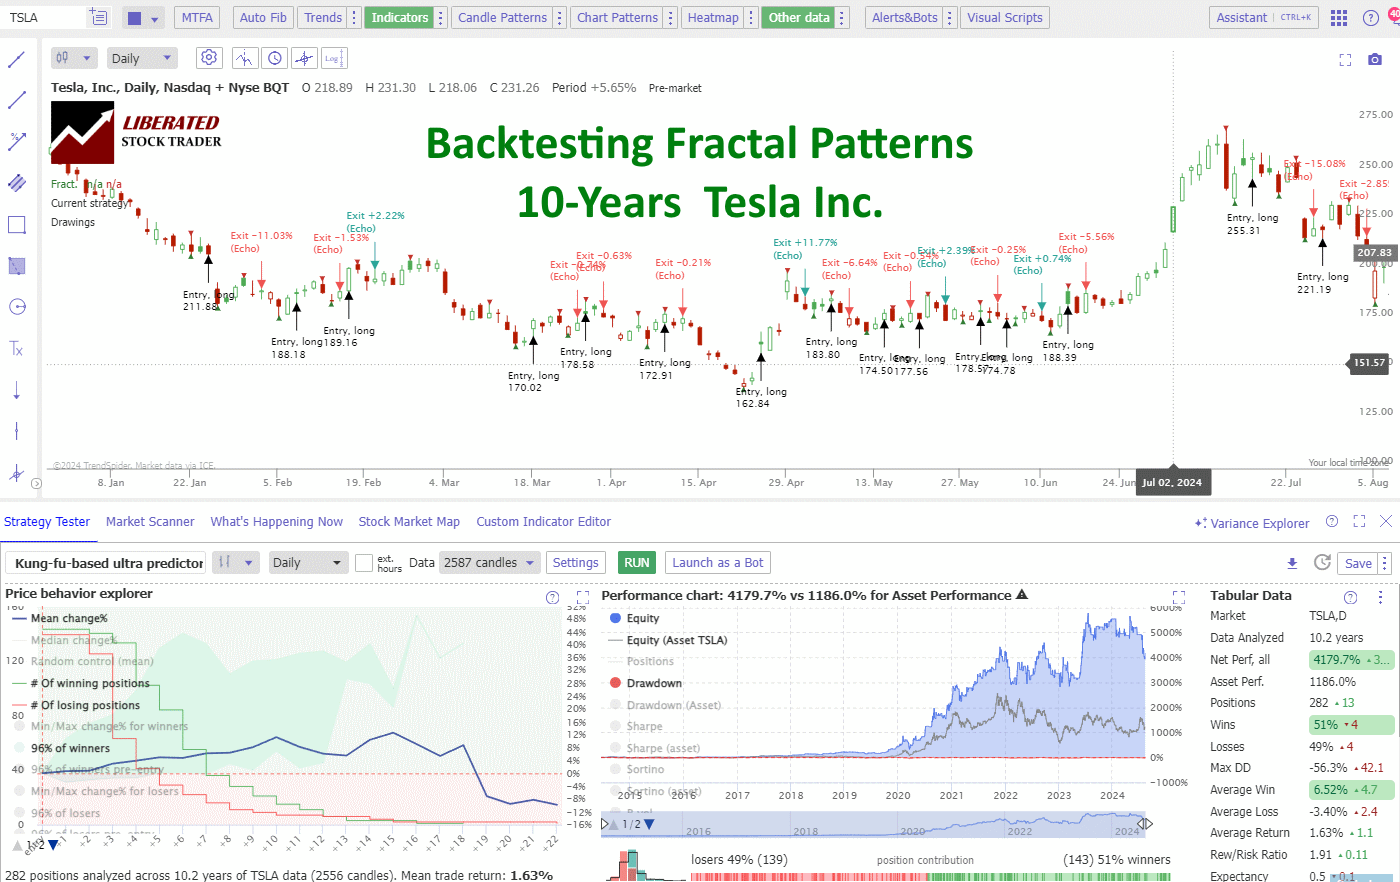
Performance Tesla Inc. (TSLA)
The Tesla Inc. fractal performance was the best; over ten years, the strategy outperformed, making 4179.70% versus a buy-and-hold strategy’s 1186.00%. 51% of trades were winners, with a high reward-to-risk ratio of 1.80. The compound 5-year annual growth rate was 110% versus the stock’s 66%.
These are incredible results. The chart below reveals further details.
The Best Fractal Settings
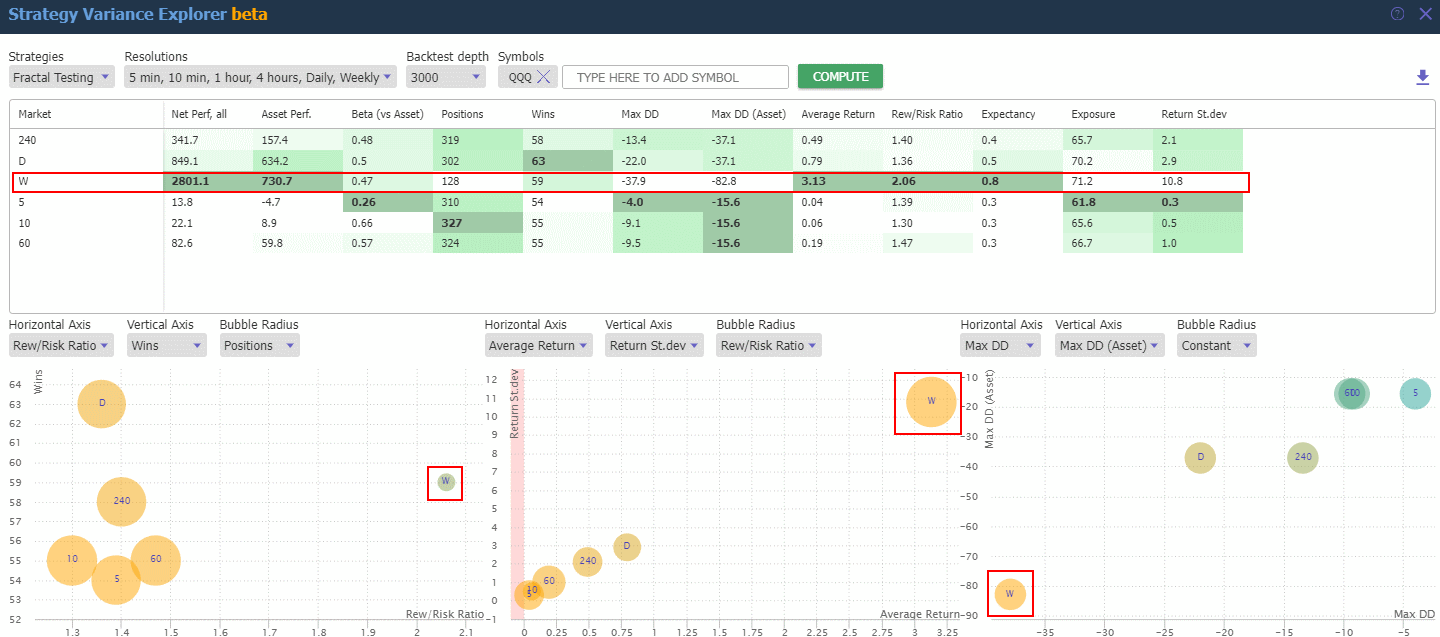
Using TrendSpiders Strategy Variance Tester, I was able to test fractals on 5-, 10-, 60-, and 240-minute charts, as well as daily and weekly charts, to find the best timeframe settings.
The results confirm that the best settings for trading fractal patterns are on a weekly chart. Weekly fractals outperformed the Nasdaq 100 by three times over ten years, yielding 2,201% versus the index’s 730%.
Again, this incredible performance is in the chart below.
Fractal analysis can be applied to multiple time frames to identify potential reversal points. By examining trends on different charts, traders can spot self-similar recurring patterns indicative of trend reversals. TrendSpider can uniquely detect indicators on multiple timeframes and display them on the same chart.
Using a daily chart alongside shorter time frames, such as hourly or minute charts, helps in confirming turning points. For example, a downtrend on the daily chart might show fractal reversal patterns, signaling a potential uptrend in a shorter timeframe.
Fractal Trading Tools
Fractal trading tools and technical analysis software help traders predict market movements by identifying repeating patterns. Key indicators like the alligator, fractal indicators, and Fibonacci retracements play important roles in this process.
The Alligator Indicator
The Alligator Indicator, created by Bill Williams, is vital for traders using fractal analysis. It consists of three moving averages that indicate market trends. When the lines are apart, the alligator is “eating,” and the market is trending. When they converge, the alligator is “sleeping,” signaling a range-bound market.
Using Fractal Indicators With Other Technical Tools
Fractal indicators spot turning points on a price chart. They appear as arrows above or below candlesticks, indicating potential reversal points. By themselves, they are good, but combined with other tools, they are perhaps even better.
For example, aligning fractal signals with support and resistance levels enhances reliability. Oscillators like the Relative Strength Index (RSI) also complement fractal indicators, providing additional context from price momentum. Integrating multiple technical analysis tools can refine a trader’s strategy and improve accuracy. To find other high-performing patterns and indicators, check out these research papers.
Fibonacci Retracement in Fractal Analysis
Many mediocre finance websites suggest Fibonacci retracement levels are a good addition to fractal trading. I can confirm they are not; not only are Fibonacci indicators bogus, but they are highly unprofitable, with an average failure rate of 63%. See for yourself in my independent research.
Those interested in the subject can explore the fractal geometry of financial time series further to understand the complexity of fractal patterns in the market.
FAQ
What is the best analysis software for trading fractal patterns?
I can confirm that TrendSpider is the most advanced and accurate technical analysis software for identifying fractal patterns in the market. With its AI-powered algorithms, it can analyze millions of data points within seconds and provide accurate results. Other popular options include TradingView and MetaStock.
Can I use Fibonacci retracements with fractal trading?
While some traders may suggest using Fibonacci retracement levels as part of a fractal trading strategy, my research has shown that they are ineffective and have a high failure rate. Instead, I recommend focusing on other high-performing patterns and indicators, such as VWAP or Bollinger Bands.
What are the basic principles of trading with fractals in the financial markets?
Trading with fractals involves identifying repeating patterns that can predict future price movements. Fractals are mathematical patterns that are useful in chart analysis. They help traders spot potential buy or sell points by highlighting recurring structures in market data.
Can fractals be used as a standalone indicator for making trading decisions?
Yes, according to my testing and research, fractals can be used as standalone indicators. However, they should always be used to trade in the direction of the market; in a bull market, buy on a bullish signal and sell on a bearish fractal.
What are the best settings for the fractal indicator?
My testing shows that the best setting for the fractal indicator is a 5-bar fractal on a weekly chart, which shows a 2:1 reward-to-risk ratio. Additionally, the daily setting performs well on stocks and indices with a 1:1.36 ratio.
How does the alligator fractal trading strategy work in forex markets?
The alligator fractal trading strategy combines fractals with Bill Williams' Alligator indicator. The alligator consists of three moving averages that identify market trends. Traders look for fractal signals when the alligator's lines indicate a trending market, using fractals to pinpoint entry and exit points.
In what ways can combining fractals with other indicators improve trading strategies?
Combining fractals with other indicators, such as moving averages or the RSI, may enhance signal accuracy, but this is scientifically unproven.
How is the fractal indicator calculated and applied in real-time trading?
The fractal indicator is calculated by identifying patterns over a set number of bars, typically five. A fractal up is formed when two lower highs on each side flank the highest high. A fractal down occurs when two higher lows flank the lowest low. Traders use these patterns to time their trades effectively.