The Gartley Pattern is one of six harmonic patterns in technical analysis. Based on Fibonacci ratios, it is frequently employed by traders to pinpoint potential market reversal points.
Traders can utilize the Gartley Pattern to identify and capitalize on potential trend reversals. It consists of four key pivot points: XA, AB, BC, and CD. These pivot points are connected by Fibonacci ratios, which indicate specific price levels where traders can expect to see trend changes.
There is little evidence of structured backtesting on the Gartley pattern. I attempt to discover if it really works and if you should trade it.
Key Takeaways
- The Gartley Pattern helps identify potential market reversals.
- Fibonacci ratios play a crucial role in forming this pattern.
- The Gartley Pattern has mixed reliability, with success rates between 36% and 60%.
- Our backtesting shows it is most effective on daily timeframes, while intraday charts should be avoided.
- Based on my findings, I would not trade using the Gartley pattern.
- Traders can use a TradingView Harmonics indicator to identify and backtest the pattern on charts automatically.
Understanding the Gartley Pattern
The Gartley Pattern, or Gartley 222, developed by H.M. Gartley, is a harmonic chart pattern used in technical analysis to identify potential reversal zones. Utilizing Fibonacci ratios, the pattern segments price movements into specific retracements and extensions to pinpoint buy or sell opportunities.
The Gartley Pattern originates from H.M. Gartley’s book Profits in the Stock Market, published in 1935. This work introduced harmonic patterns, including the bullish and bearish Gartley patterns.
However, in this or any publication, no backtesting was performed, and there was little evidence that this pattern actually worked consistently. In this article, I will attempt to quantify its importance in trading.
How It Works
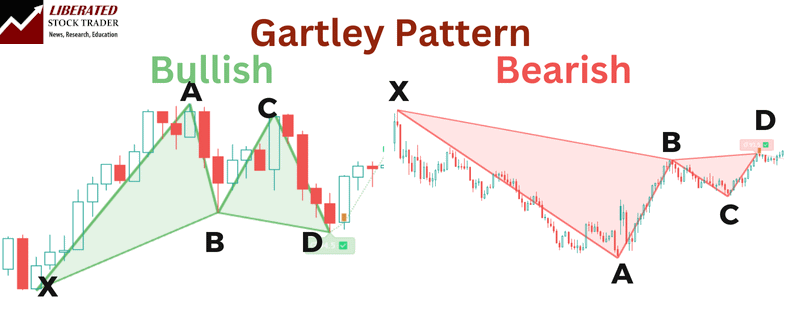
The key to the Gartley Pattern lies in its specific formation, which consists of five points (X, A, B, C, D), each defined by Fibonacci retracement levels. This harmonic pattern is renowned for its accuracy in signaling reversals, making it a valuable tool for technical analysts.
The role of Fibonacci ratios, such as 61.8% and 78.6%, is crucial in forming the Gartley Pattern. These ratios help establish key levels of support and resistance, facilitating strategic entry and exit points during trades.
The structure of the Gartley Pattern consists of five key points: X, A, B, C, and D. Each segment—XA, AB, BC, and CD—corresponds to specific Fibonacci retracement and extension levels.
- XA: The initial move from point X to A.
- AB: A retracement from A to B, typically 61.8% or 78.6% of XA.
- BC: An extension from B to C, often 38.2% or 88.6% of AB.
- CD: The final leg, where the pattern completes, at 127.2% or 161.8% of BC.
These ratios help in determining the potential reversal zone, where traders expect a change in price direction.
Automatic Gartley Pattern Recognition with TradingView
Identifying the Gartley Pattern
Identifying the Gartley Pattern involves recognizing the specific Fibonacci-based retracements and extensions in the price movements.
- Locate Point X: Start with an initial significant move.
- Measure XA and Retrace to B: Ensure point B aligns with a 61.8% or 78.6% retracement of XA.
- Find BC Extension: Measure the move from B to C, confirming with an extension hitting 38.2% or 88.6% of AB.
- Complete Point D: Identify the final leg and check that CD aligns with a 127.2% or 161.8% extension of BC.
This systematic approach aids traders in detecting the Gartley Pattern and making informed trading decisions based on harmonic patterns.
Automating Gartley Pattern Identification
Harmonic patterns like the Gartley are difficult to identify manually. However, you do not need to manually hunt for them because TradingView has a special indicator that can detect all harmonic patterns automatically.
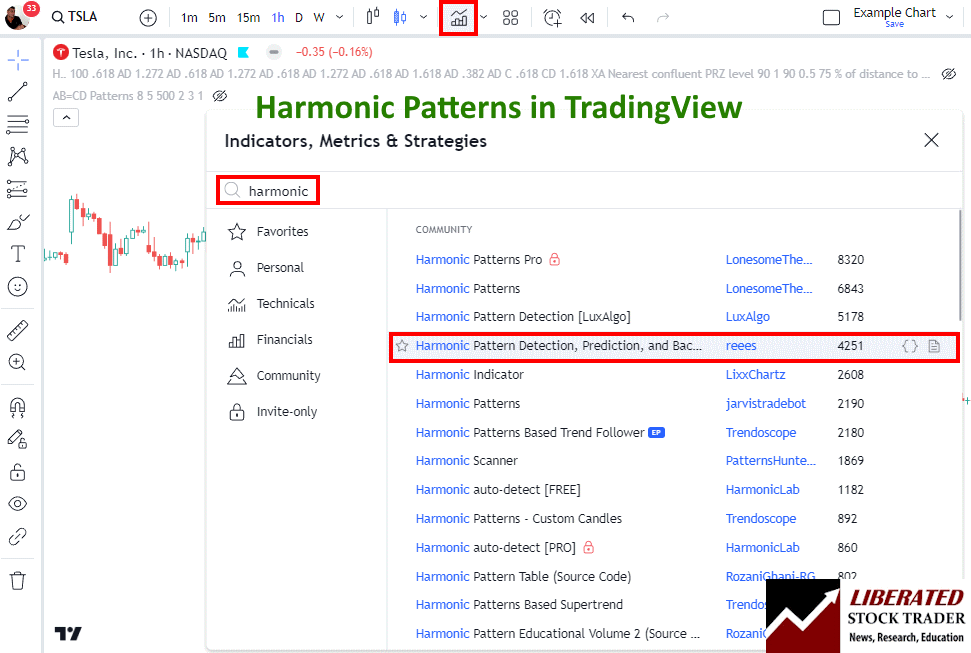
I have tested most of the harmonic indicators in TradingView, and the best one to enable is below.
To enable automated harmonic pattern detection in charts, follow these steps:
- Visit TradingView
- Select Indicators -> Search for Harmonic
- Select Harmonic Pattern Detection by User “Reees”
This script not only identifies the patterns but also performs backtesting automatically. Congratulations to Reees on such a good indicator.
Trading a Gartley Pattern
The first rule of trading a Gartley Pattern is to trade the bullish Gartley in a bull market and a bearish Gartley in a bearish market; this improves the likelihood of profitable trades.
The Gartley Pattern signifies a possible change in trend, whether bullish in a downtrend or bearish in an uptrend. As the stock market’s default direction is up, the bullish Gartley is more profitable than the bearish variation.
Effective trading strategies with the Gartley Pattern involve identifying optimal entry points and setting strategic stop-loss and take-profit points. Traders may enter a position at the completion of the CD leg when clear Fibonacci retracement levels confirm the pattern.
A common approach includes setting the stop-loss point slightly below the recent support D point for bullish setups or above the D-point resistance line for bearish setups.
Trading a Bullish Gartley
The Bullish Gartley should be traded in a downtrend during a bull market.
6 Steps for Trading a Bullish Gartley
- Ensure the pattern occurs in a downtrend in a bull market.
- When point D is confirmed, wait for a price increase to begin.
- Set a stop-loss between point D and point X.
- The initial price target is a Fibonacci retracement of 61.8% of point CD. That means if point C was $10 and D was $5, you can expect the price target to be approximately $8.09. ($10-$5)*0.618 + $5 = $8.09
- Once the price reaches the initial target, consider taking partial profits and trailing your stop-loss to secure any gains.
- If the price continues to rise, you can use additional Fibonacci retracement levels as potential exit points or set a new take-profit point at a key resistance level.
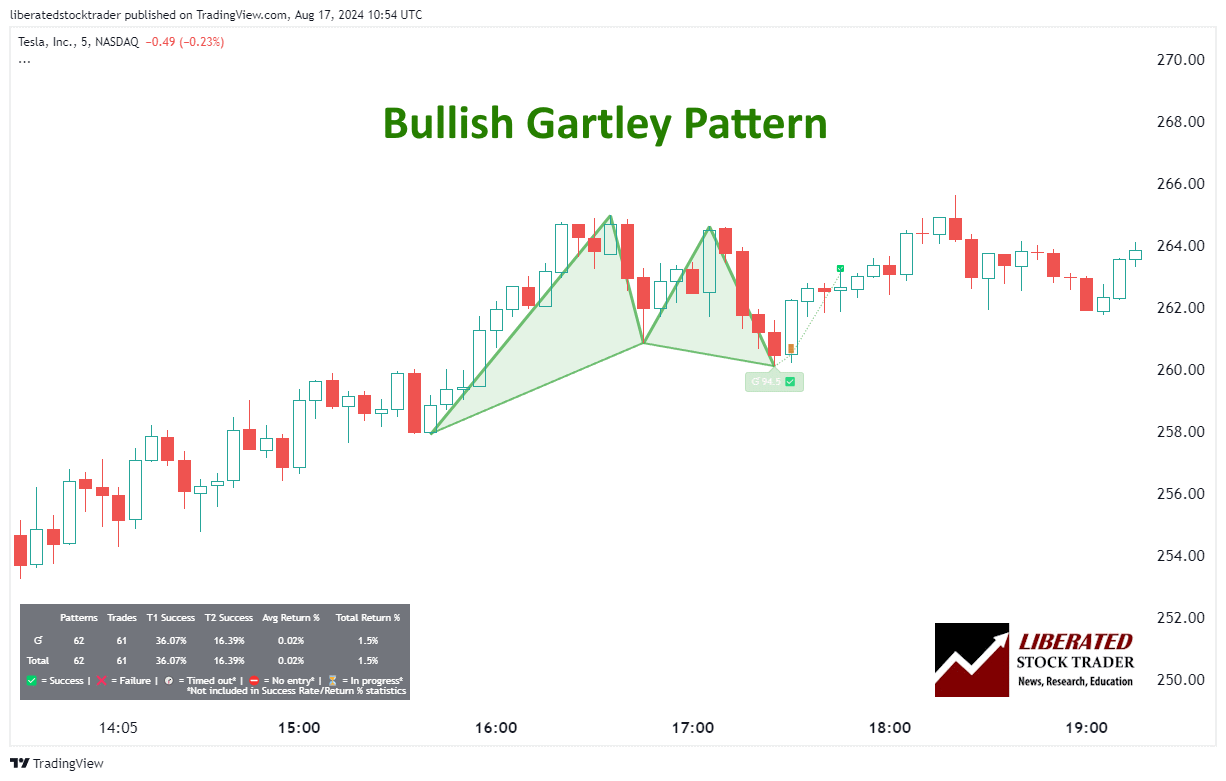
Is the Bullish Gartley Reliable?
Yes, based on our backtested trades on 23 years of Nasdaq 100 exchange data, the bullish Gartley pattern achieved its price target 60% of the time, with a 4.46% average return per trade. Performance varies incredibly for each stock; for example, Tesla had a 42% chance of a 9.27% gain per trade.
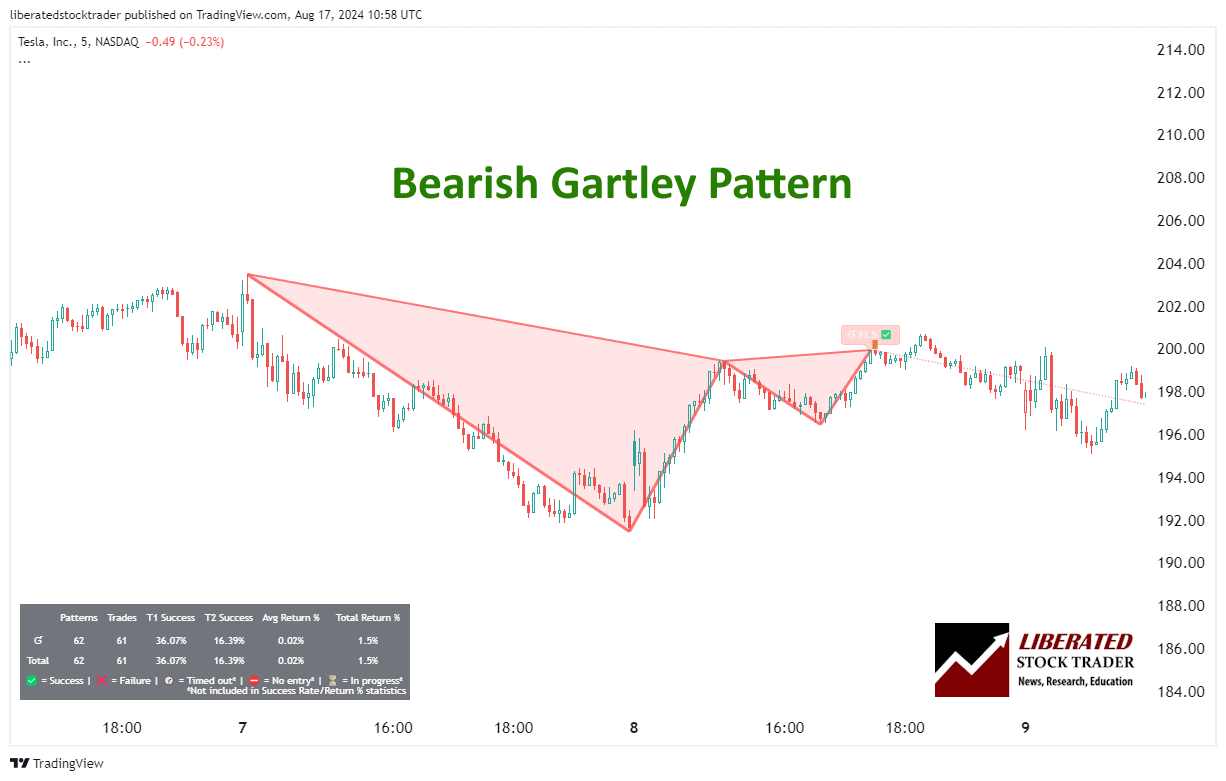
Trading a Bearish Gartley
One variation of the Gartley pattern is known as the Bearish Gartley, which can be used in bear markets for short-selling opportunities. The Bearish Gartley should be traded in an uptrend during a bear market. Here are six steps for trading it.
6 Steps for Trading a Bearish Gartley
- Ensure the pattern occurs in an uptrend in a bear market.
- When point D is confirmed, wait for a price decrease to begin.
- Set a stop-loss between point D and point X.
- The initial price target is a Fibonacci retracement of 61.8% of point CD. That means if point C was $10 and D was $15, you can expect the price target to be approximately $13.36 ($15-$10)*0.618 + $10 = $11.91
- If the price reaches the initial target, consider taking partial profits and trailing your stop-loss to secure any gains.
- If the price continues to decrease, you can use additional Fibonacci retracement levels as potential exit points or set a new take-profit point at a key support level.
Trade Harmonic Patterns with TradingView
Is the Bearish Gartley Profitable?
Yes, based on our backtested trades on 23 years of Nasdaq 100 exchange data, the bearish Gartley pattern achieved its price target 50% of the time, with a 4.01% average return per trade. Performance varies incredibly for each stock; for example, Netflix had a 45% chance of a 7.79% gain per trade.
Do Gartley Patterns Work?
Yes, Gartley patterns work, but only between 36% and 60% of the time. The profit per trade can vary widely between stocks, from fractions of a percent to 4 or 5% per trade.
Is the Gartley Pattern a Good Trade?
Yes. trading the Gartley pattern can be profitable. However, my backtesting confirms it does not occur very often. Combine that with a low reward-to-risk ratio, and it might be worth avoiding.
Try TradingView, Our Recommended Tool for International Traders
Global Community, Charts, Screening, Analysis & Broker Integration

Global Financial Analysis for Free on TradingView
Harmonic Patterns Beyond Gartley
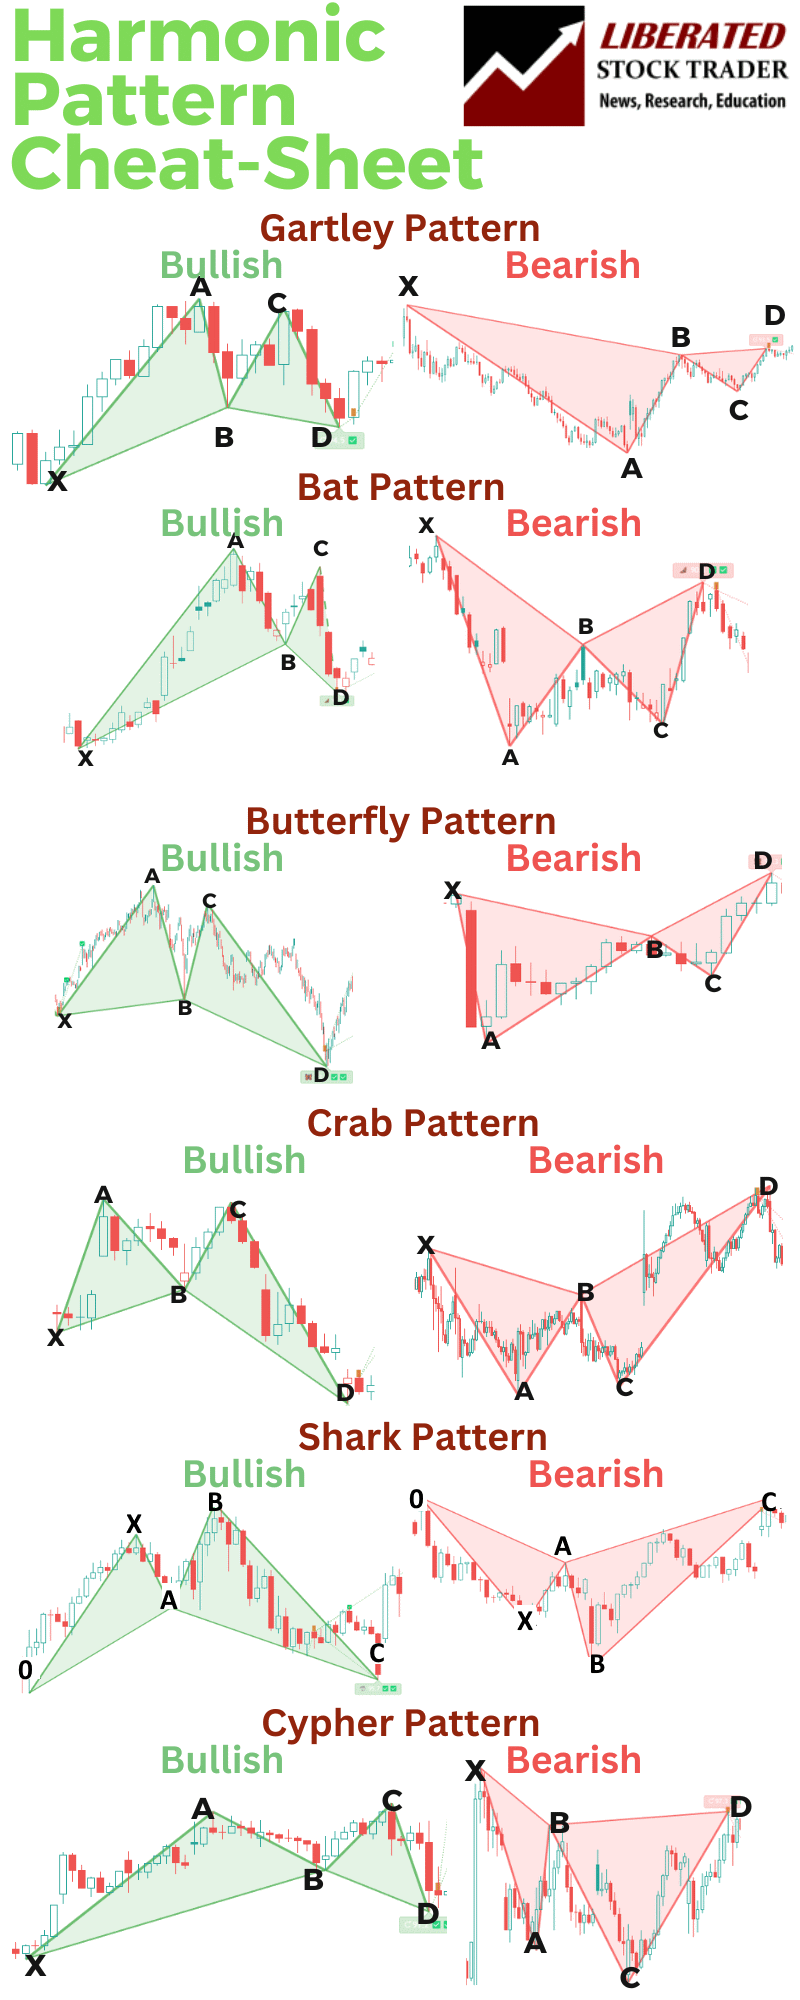
There are six important harmonic patterns in technical analysis: Gartley, Bat, Crab, Butterfly, Shark, and Cypher. While the Gartley pattern is one of the most commonly used, it’s essential to understand and recognize all patterns if you want to be a harmonic trader.
The Bat pattern is similar to the Gartley pattern but has more extended retracements of 88.6% instead of 61.8%. The Crab pattern has an even more extended retracement level of 161.8% and is considered one of the most reliable patterns for short-term traders.
Both shark and butterfly patterns have deeper retracements at 127% and 161.8%, respectively. These patterns are often seen as high-risk but can also offer high rewards for those who are patient and disciplined.
Finally, the Cypher pattern is a newer addition to harmonic trading and has a retracement level of 113%, making it one of the most shallow patterns. It’s important to note that while these patterns have specific rules and ratios, they can still vary slightly in each occurrence.
Understanding these different patterns allows traders to identify potential entry and exit points based on their preferred risk-reward ratio. By combining harmonic patterns with other technical indicators, traders can improve their accuracy in predicting market movements and increase their chances of success.
Harmonic Patterns Cheat Sheet
FAQ
What is the best software for trading a Gartley pattern?
After extensive testing, I personally use TradingView for backtesting and trading harmonic patterns like the Gartley 222. It has a custom indicator called Harmonics that automatically detects all harmonic patterns.
What are the specific measurements for a Gartley 222 pattern?
In the Gartley 222 pattern, segment AB retraces 61.8% of the XA leg. Segment BC retraces between 38.2% to 88.6% of the AB leg. The CD leg completes the pattern by retracing 78.6% of the XA leg. Precise Fibonacci ratios are essential for accurately identifying this pattern.
Which trading indicators complement the Gartley pattern analysis?
Gartley pattern analysis is often complemented by indicators such as Fibonacci retracement levels, Relative Strength Index (RSI), and moving averages. These indicators help traders confirm the pattern's validity and assess market conditions more effectively.
How do you identify a bullish Gartley pattern on a chart?
You can automatically identify Gartley patterns using TradingView's Harmonics Indicator. To do it manually (which I do not recommend), look for a significant price move upward (XA), followed by a retracement (AB) that typically retraces 61.8% of the XA leg. The BC leg moves upward again, retracing 38.2% to 88.6% of the AB leg. Finally, the CD leg confirms the pattern by retracing 78.6% of the XA leg.
Can the Gartley pattern be applied to all time frames in trading?
The Gartley pattern can be applied to all time frames, but its average returns are so small on a 1, 5, or 60-minute chart that it is not worth trading. On intraday charts, the pattern has a 40 to 50% success rate, but the profit per trade is very low.
What differentiates a Gartley pattern from other harmonic patterns?
The Gartley pattern is distinguished by its specific Fibonacci retracement levels and structure. Unlike other harmonic patterns, such as the Butterfly and Bat patterns, the Gartley pattern requires a 61.8% retracement of the XA leg by the AB leg and a 78.6% retracement of the XA leg by the CD leg.
How does a bearish Gartley pattern signal potential price reversal?
A bearish Gartley pattern signals a potential price reversal when the market has an initial downward move (XA), followed by an upward retracement (AB), another downward move (BC), and a final upward move (CD) that completes near 78.6% of the XA retracement. This structure suggests that the bullish momentum is weakening, indicating a possible reversal to the downside.
Trading Butterfly Patterns: I Test the Best Settings & Strategies