Legendary investor Joel Greenblatt introduced a simple yet powerful concept known as the Greenblatt Earnings Yield to help investors find undervalued stocks with solid earnings potential.
The Earnings Yield shows how much a company earns compared to its price. It’s calculated by dividing a company’s earnings by its current share price, making it easy to compare investment options.
Greenblatt’s Magic Formula relies heavily on the concept of Earnings Yield. This formula ranks companies based on their earnings yield and return on capital, allowing investors to identify stocks likely to perform well over time.
Key Takeaways
- Greenblatt’s Earnings Yield measures earnings relative to the purchase price.
- It is a key component of Greenblatt’s Magic Formula for stock selection.
- Earnings Yield should be used alongside Greenblatt ROC.
- A good Greenblatt Earnings Yield is in the 20th percentile in an industry – between 2 and 20%.

Is Greenblatt Earnings Yield Profitable?
Yes, my research shows profitable market performance when combining Greenblatt’s earnings yield and return on capital (AKA the magic formula). My LST Beat the Market System, which is built into Stock Rover, demonstrates nine years of high performance.
Charting & Screening for Earnings Yield
You do not need to calculate the Greenblatt Earnings Yield manually; Stock Rover does it for you. Only Stock Rover provides advanced hybrid financial metrics, such as the Altman Z-Score, Piotroski F-Score, Beneish M-Score, Graham Number, Greenblatt ROC, Chowder Rule, Yacktman Forward Rate of Return, and the Sharpe ratio.
The chart screenshot below shows the Greenblatt Earnings Yield plotted over time.
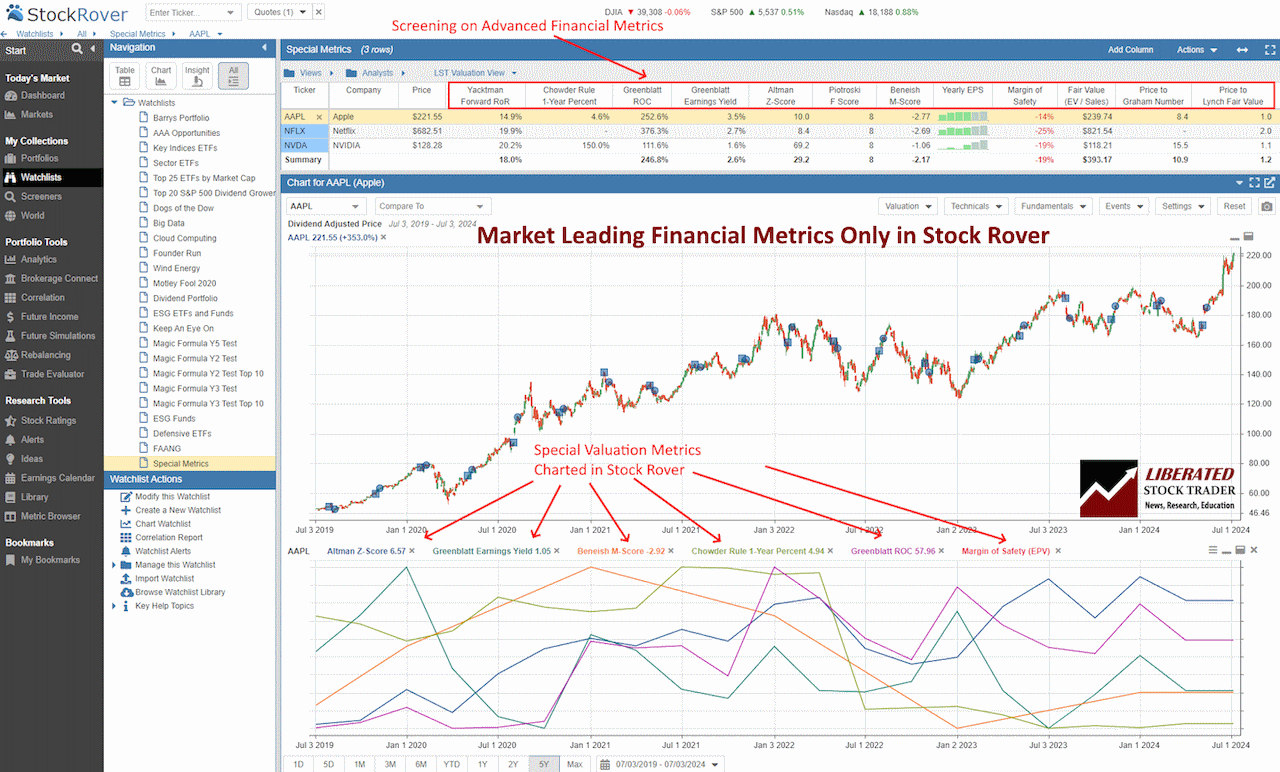
Chart & Screen the Greenblatt Earnings Yield with Stock Rover
Understanding the Greenblatt Earnings Yield
The Greenblatt Earnings Yield is a way to measure how profitable a company is relative to its price. It uses Earnings Before Interest and Taxes (EBIT) divided by the Enterprise Value (EV) to determine the yield. This method helps investors find potential investment opportunities by comparing the profitability of different companies.
Calculation of Earnings Yield
To calculate the Greenblatt Earnings Yield, you need two main figures: EBIT and EV. The formula is:
Earnings Yield = EBIT / EV.
Where:
- EBIT: This stands for Earnings Before Interest and Taxes, and it measures a company’s profitability before taking into account interest and tax expenses.
- EV: This stands for Enterprise Value, which is the total value of a company, including its debt and equity. It takes into consideration not just the stock price but also any outstanding debt.
Once you have these figures, divide EBIT by EV to get the Greenblatt Earnings Yield percentage.
Earnings Before Interest and Taxes (EBIT)
EBIT is a measure of a company’s profitability and indicates its ability to generate profit from operations alone. EBIT is calculated using the formula:
EBIT = Revenue - Operating Expenses - Cost of Goods Sold
This figure is crucial because it excludes interest and tax expenses, focusing solely on the operational efficiency of the company. By using EBIT, the earnings yield accounts for the company’s core profit-making activities, making it a helpful metric for evaluating different firms on a level playing field.
Enterprise Value and Its Components
Enterprise Value (EV) gives a comprehensive picture of a company’s total value. Unlike market cap, which only considers equity, EV includes debt and subtracts cash. The formula for EV is:
EV = Market Cap + Debt + Minority Interest + Preferred Shares - Cash and Cash Equivalents
EV provides a more accurate valuation by including the company’s capital structure. It reflects what it would cost to buy the entire company, taking into account both equity and debt obligations. This broader view makes EV a better metric for comparison across different companies and industries, ensuring a fair assessment when calculating earnings yield.
The Role of Earnings Yield in the Magic Formula
Joel Greenblatt introduced the concept of using earnings yield as an investment metric in his book The Little Book That Beats The Market. Earnings Yield is a crucial component of Joel Greenblatt’s Magic Formula. It helps identify undervalued stocks that may provide higher returns.

He found that companies with a high earnings yield tend to outperform the market over time.
This makes intuitive sense—if you can buy a company at a low price relative to its earnings, you are getting a good return on your investment. Since earnings ultimately drive stock prices, it follows that companies with high earnings yields are likely undervalued and have the potential for future growth.
Principles Behind the Magic Formula Investing
The Magic Formula is based on the idea that cheap, high-quality stocks can outperform the market. Earnings Yield measures how much earnings a company makes relative to its stock price. A higher Earnings Yield suggests a cheaper stock. Return on Capital (ROC) measures a company’s efficiency in generating profit from its capital. Combining Earnings Yield with Return on Capital helps investors find stocks that are both undervalued and efficient.
Magic Formula Investing ranks stocks based on these two metrics. Stocks with high rankings in both categories are considered potential investments. This dual focus aims to balance value and quality, seeking to avoid the pitfalls of investing solely based on low prices or high returns.
Performance and Backtesting Results
Backtesting is essential to evaluate the Magic Formula’s effectiveness over time. Studies such as those on the Oslo Stock Exchange examined the performance from 2003 to 2022. These tests showed that stocks ranked by the Magic Formula generally outperformed the market benchmarks.
Greenblatt claims the Magic Formula produced above-market returns, although some results suggest it might not always generate significant alpha. The analysis often reveals that stocks with high Earnings Yield and Return on Capital tend to perform better over the long term. However, there can be variations in different market conditions.
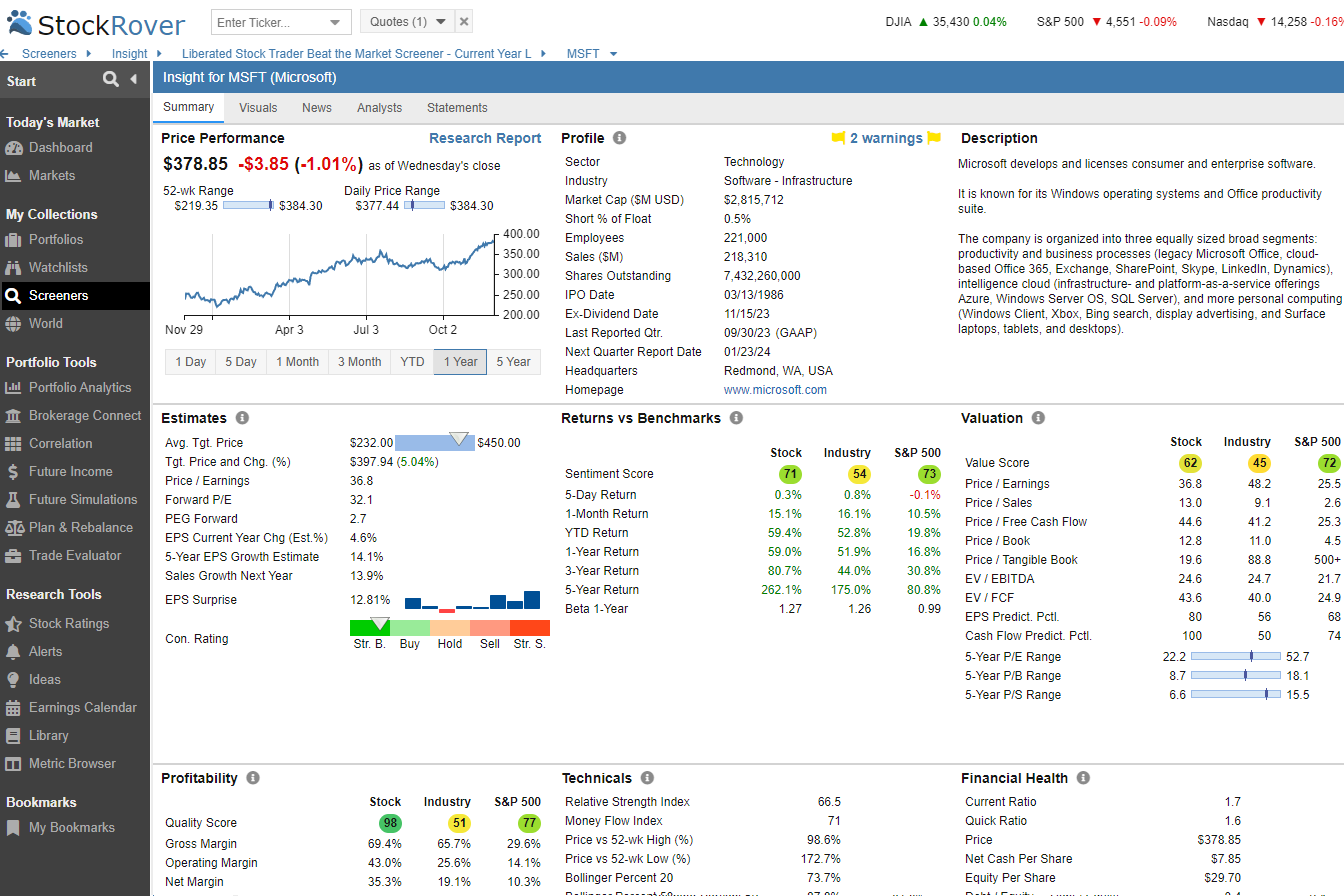
Try Powerful Financial Analysis & Research with Stock Rover
Comparing Earnings Yield to Return on Capital
Earnings Yield and Return on Capital are both crucial, but they serve different purposes. Earnings Yield focuses on value, indicating how “cheap” a stock is. Return on Capital assesses how effectively a company uses its capital to generate profits.
For instance, a stock with a high Earnings Yield might be undervalued, but if its Return on Capital is low, it may not be a good investment. Conversely, a high Return on Capital with a low Earnings Yield might indicate an expensive stock that efficiently generates profits. Thus, Magic Formula Investing aims to balance these metrics, seeking stocks that are both undervalued and financially efficient.
By ranking stocks based on these criteria, investors can better identify potential opportunities. This balance is what sets the Magic Formula apart from other value investing strategies.
Applying Greenblatt Earnings Yield in Investment Portfolios
The Greenblatt Earnings Yield is a key metric in value investing that helps in identifying undervalued stocks with strong earnings potential. This method involves selecting stocks with high earnings yields and rebalancing the portfolio to manage risk effectively.
Selecting Stocks Using Earnings Yield
To select stocks using the Greenblatt Earnings Yield, investors look for companies with a high earnings-to-enterprise value ratio. This ratio highlights stocks that generate high earnings relative to their market price and debt.
Investors start by ranking stocks based on their earnings yield. Stocks with the highest yields are considered for investment. This approach often identifies companies that might be overlooked by traditional growth metrics, offering opportunities in undervalued sectors.
For example, a stock with an earnings yield of 10% is considered more attractive than one with 5%. This metric is particularly useful in volatile markets, where companies with solid earnings can be undervalued.
Ever Dreamed of Beating the Stock Market
Most people think that they can't beat the market, and stock picking is a game only Wall Street insiders can win. This simply isn't true. With the right strategy, anyone can beat the market.
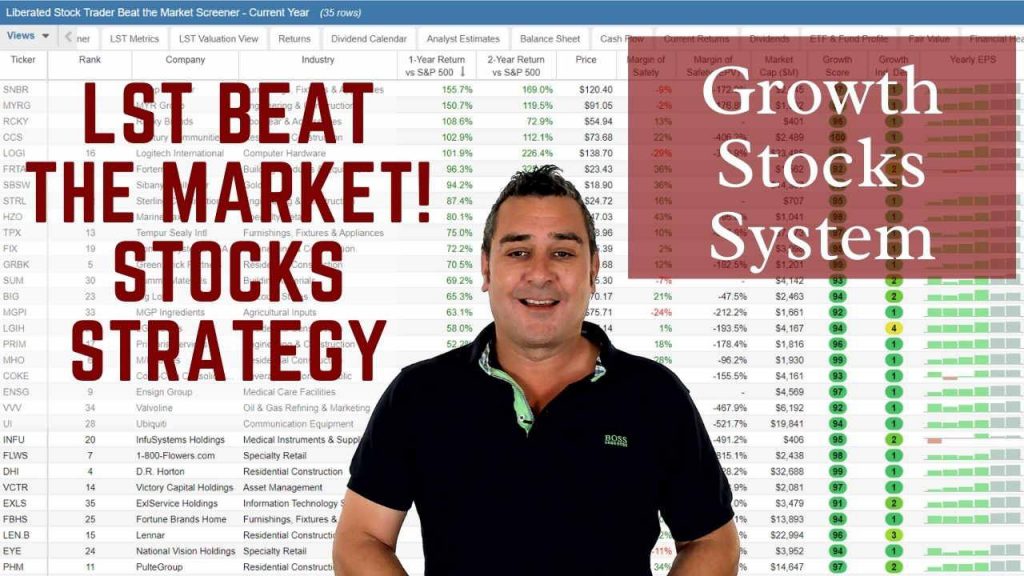
The LST Beat the Market Growth Stock Strategy is a proven system that has outperformed the S&P500 in 8 of the last 9 years. We provide all of the research and data needed to make informed decisions, so you no longer have to spend hours trying to find good stocks yourself.
The LST Beat the Market System Selects 35 Growth Stocks and Averages a 25.6% Annual Return
★ 35 Stocks That Already Beat The Market ★
★ Buy The Stocks & Hold For 12 Months - Then Rotate ★
★ Fully Documented Performance Track Record ★
★ Full Strategy Videos & eBook ★
Take The Pain Out Of Stock Selection With a Proven Strategy
Using Greenblatt ROC & Yield in Stock Selection
Using Greenblatt ROC & Yield, the LST Beat the Market System (powered by Stock Rover) has selected the following stocks to outperform the market in 2024
| Ticker | Rank | Company | Free Cash Flow | EPS | Greenblatt ROC | Greenblatt Earnings Yield | 1-Year Return vs S&P 500 | EPS 1-Year Chg (%) |
| TDW | 1 | Tidewater | 113 | $2.57 | 15.3% | 4.5% | 41.6% | 137.7% |
| BROS | 2 | Dutch Bros | -65 | $0.18 | 5.7% | 1.8% | 17.9% | 1700.0% |
| CCJ | 3 | Cameco | 271 | $0.39 | 12.3% | 1.5% | 39.4% | 145.5% |
| EDU | 4 | New Oriental Education | 1,024 | $1.90 | 14.4% | 5.4% | 73.3% | 80.0% |
| MMYT | 5 | MakeMyTrip | 113 | $1.95 | 18.9% | 1.2% | 214.4% | 987.5% |
| NBIX | 6 | Neurocrine Biosciences | 614 | $3.78 | 33.1% | 3.5% | 23.6% | 106.7% |
| NVO | 7 | Novo Nordisk | 7,245 | $2.88 | 115.4% | 2.6% | 51.4% | 33.8% |
| OWL | 8 | Blue Owl Cap | 807 | $0.15 | 94.0% | 3.6% | 30.7% | 140.0% |
| AGYS | 9 | Agilysys | 40 | $3.31 | 15.2% | 0.8% | 25.9% | 637.2% |
| KSPI | 10 | Kaspi.kz | 1,363 | $9.86 | 70.5% | 10.3% | 41.2% | 24.3% |
| WLFC | 11 | Willis Lease Finance | 63 | $8.94 | 7.4% | 8.0% | 43.9% | 52.0% |
| AROC | 12 | Archrock | 46 | $0.83 | 12.0% | 6.1% | 84.7% | 97.6% |
| HWM | 13 | Howmet Aerospace | 818 | $2.08 | 32.2% | 3.5% | 36.3% | 64.3% |
| PDD | 14 | PDD Holdings | 15,584 | $8.05 | 56.2% | 8.2% | 75.3% | 92.4% |
| PNTG | 15 | Pennant Gr | 16 | $0.55 | 9.6% | 2.8% | 84.5% | 25.6% |
| POWL | 16 | Powell Industries | 221 | $8.59 | 31.3% | 9.1% | 108.7% | 176.4% |
| SILV | 17 | SilverCrest Metals | 73 | $0.84 | 31.5% | 10.2% | 29.2% | 55.6% |
| WFRD | 18 | Weatherford International | 675 | $6.33 | 28.4% | 7.6% | 53.9% | 76.4% |
| WLDN | 19 | Willdan Group | 40 | $0.97 | 21.1% | 5.4% | 40.1% | 1075.0% |
| EME | 20 | EMCOR Group | 1,041 | $15.22 | 62.8% | 6.0% | 71.0% | 51.3% |
| MLR | 21 | Miller Industries | 12 | $5.78 | 22.4% | 13.9% | 33.8% | 70.0% |
| NSSC | 22 | NAPCO Security Techs | 42 | $1.28 | 33.8% | 2.7% | 32.2% | 72.6% |
| AGI | 23 | Alamos Gold | 138 | $0.52 | 8.0% | 4.7% | 17.5% | 26.8% |
| CRS | 24 | Carpenter Tech | 181 | $2.66 | 9.9% | 3.9% | 74.6% | 130.7% |
| DY | 25 | Dycom Industries | 89 | $7.86 | 21.6% | 6.1% | 25.5% | 33.3% |
| WAB | 26 | Westinghouse Air Brake | 1,375 | $5.14 | 46.6% | 4.6% | 17.9% | 36.8% |
| AGS | 27 | PlayAGS | 45 | $0.13 | 33.3% | 6.8% | 90.0% | 33.3% |
| KEX | 28 | Kirby | 237 | $4.26 | 73.0% | 4.8% | 30.7% | 45.9% |
| UTHR | 29 | United Therapeutics | 752 | $22.36 | 41.6% | 11.8% | 23.3% | 19.7% |
| ATGE | 30 | Adtalem Glb Education | 239 | $2.72 | 44.5% | 6.2% | 71.0% | 19.3% |
| IHG | 31 | InterContinental Hotels | 811 | $4.44 | 266.0% | 5.9% | 28.0% | 25.0% |
| KGC | 32 | Kinross Gold | 604 | $0.36 | 10.1% | 6.7% | 64.6% | 125.0% |
| LPG | 33 | Dorian LPG | 356 | $7.63 | 20.4% | 15.2% | 53.7% | 53.5% |
| SCS | 34 | Steelcase | 191 | $0.76 | 17.4% | 7.8% | 44.1% | 85.4% |
| OSG | 35 | Overseas Shipholding Gr | 56 | $0.85 | 11.8% | 9.5% | 81.0% | 51.9% |
| Summary | 1,007 | $4.17 | 38.5% | 6.1% | 53.6% | 188.2% |
Rebalancing and Managing Risk
Rebalancing is crucial when applying the Greenblatt Earnings Yield. Investors periodically assess and adjust their portfolios to ensure they remain aligned with their strategy. This involves selling stocks that no longer meet the earnings yield criteria and buying those that now do.
Regular rebalancing helps manage risk by preventing overexposure to any single stock or sector and ensuring that the portfolio remains diversified. The frequency of rebalancing can vary, but many investors prefer to do it annually or semi-annually.
Managing risk also involves monitoring the performance of selected stocks. If a stock’s earnings outlook changes significantly, it may be necessary to replace it with a better-performing one. Thus, sticking to a disciplined rebalancing schedule can lead to more consistent returns and lower risk.
Challenges
Using earnings yield as an investment metric requires careful consideration due to various market conditions and specific industry challenges. Key points to consider include the impact of market volatility, the unique attributes of financial and utility stocks, and the need to adapt strategies for different market environments.
Market Volatility and Its Effects
Market volatility can significantly impact the reliability of earnings yield. When markets are highly volatile, stock prices can swing drastically, causing earnings yield to fluctuate. This is particularly problematic for long-term investors who rely on stable metrics to make decisions.
High volatility may lead investors to misinterpret a stock’s value, either overestimating or underestimating its actual worth. It is essential to account for these fluctuations and perhaps employ additional metrics to make more informed investment choices.
How to Beat the Stock Market With Stock Rover
I love Stock Rover so much that I spent 2 years creating a growth stock investing strategy that has outperformed the S&P 500 by 102% over the last eight years. I used Stock Rover's excellent backtesting, screening, and historical database to achieve this.
This Liberated Stock Trader Beat the Market Strategy (LST BTM) is built exclusively for Stock Rover Premium Plus subscribers.
Dealing with Financial and Utility Stocks
Financial companies often have complex balance sheets and revenue structures, which can complicate the use of earnings yield calculations. Traditional metrics may not fully capture these companies’ financial health. Bank profit measures, for instance, may not align well with standard earnings yield calculations.
Similarly, utility stocks are typically regulated and have stable earnings, making them less sensitive to market shifts. However, their earnings yield may appear lower compared to more volatile sectors. This means investors need to consider regulatory impacts and the typically lower volatility when evaluating these stocks.
Adapting the Approach to Different Market Environments
Earnings yield must be adapted to different market environments. In bullish markets, high stock prices might lower the earnings yield, making stocks seem less attractive based on this metric alone. Conversely, in bear markets, depressed stock prices can inflate earnings yield.
It’s important to consider foreign companies, which may operate under different tax rates and market conditions, altering their earnings yield compared to domestic companies. Investors should also be wary of companies with different market caps, as large-cap stocks may behave differently from small-cap stocks in various market conditions. Adjusting the approach to consider these factors can lead to more accurate assessments.
Try TradingView, Our Recommended Tool for International Traders
Global Community, Charts, Screening, Analysis & Broker Integration
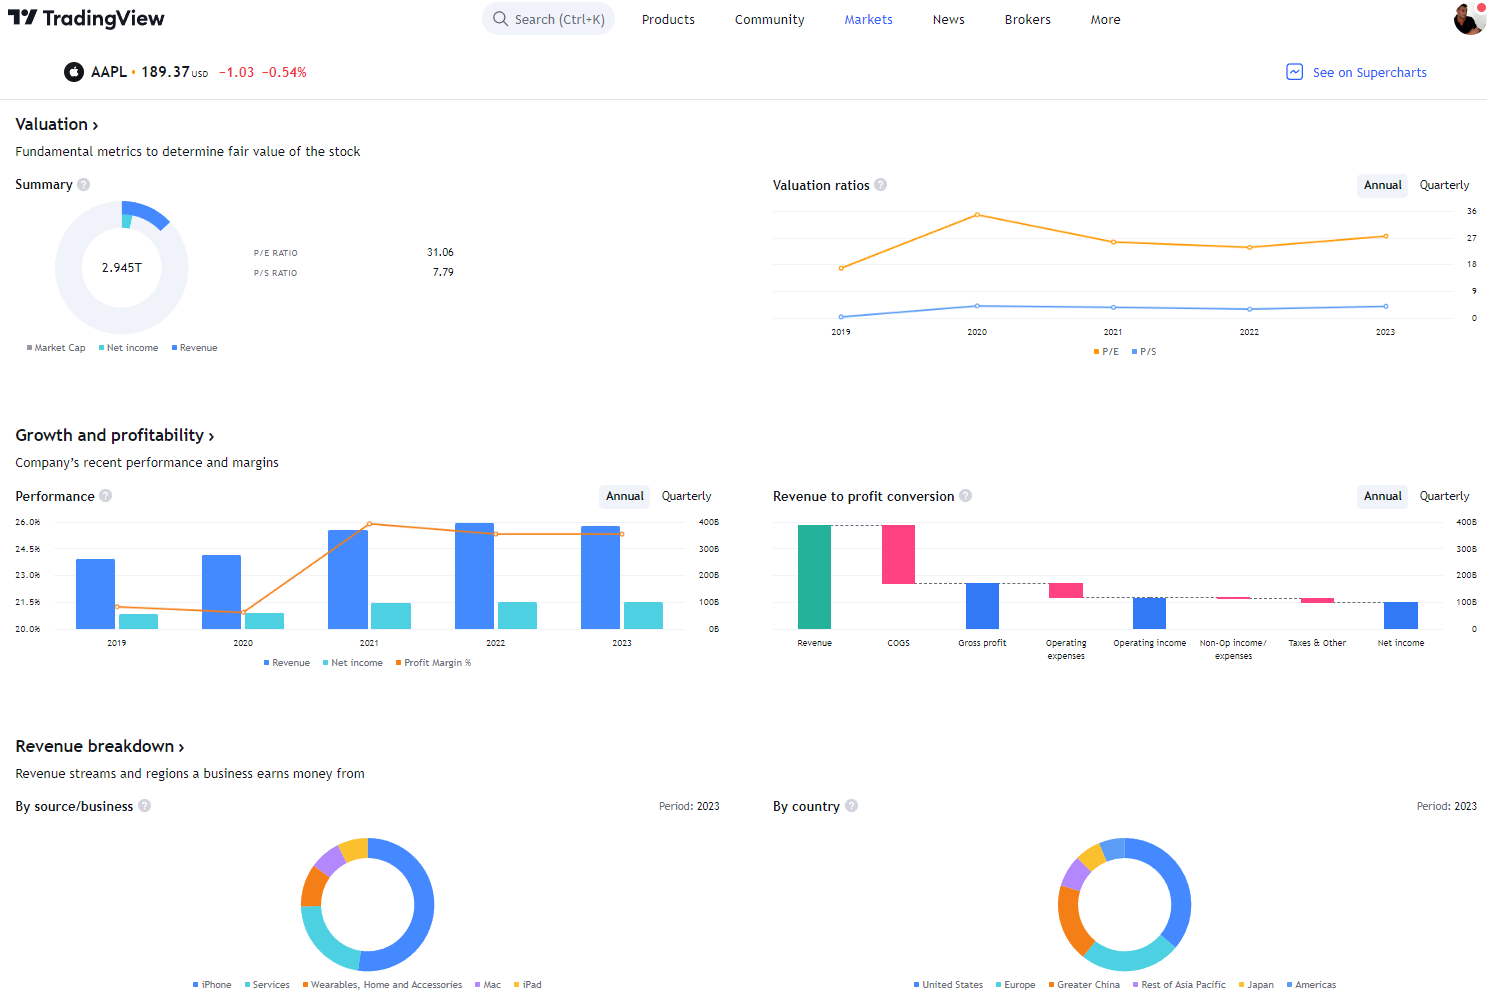
Global Financial Analysis for Free on TradingView
FAQ
What is the best software to chart and analyze the Greenblatt Earnings Yield?
Stock Rover is the best software for screening and charting advanced financial metrics like the Greenblatt Earnings Yield. Our testing shows it offers the widest array of metrics and ratios available on the market today.
How is the earnings yield calculated in the Magic Formula?
Earnings yield is calculated by dividing the earnings per share (EPS) by the share price. For example, if a stock has an EPS of $1.20 and a share price of $12, the earnings yield would be 10%. This measure helps investors find potentially undervalued stocks.
Why is earnings yield preferred over dividend yield in Greenblatt's method?
Earnings yield is preferred because it considers the overall profitability of a company, not just the dividends paid out. Many factors can influence dividends, while earnings reflect the actual business performance, making earnings yield a more comprehensive metric.
Is there a good screener available to identify the Greenblatt Earnings Yield?
Yes, Stock Rover provides a screener that can filter stocks based on their Greenblatt Earnings Yield. It helps investors quickly identify undervalued companies.
What constitutes a high earnings yield, according to Greenblatt?
According to Greenblatt, a high earnings yield is one that ranks in the top percentile among comparable companies. It typically involves selecting stocks that demonstrate significant earnings relative to their market price, indicating potential undervaluation.
How can we compare earnings yield to P/E ratio when assessing stock value?
The earnings yield is the inverse of the price-to-earnings (P/E) ratio. While the P/E ratio shows how much investors are willing to pay for $1 of earnings, earnings yield indicates how much earnings one gets per dollar invested. Both measures help assess a stock's value but from different perspectives.
In what way does Greenblatt's concept of earnings yield differ from the traditional definition?
Greenblatt's earnings yield is adjusted to take into account not only earnings but also enterprise value, which includes debt and cash. This provides a fuller picture of how much a company earns relative to its total value rather than just its market capitalization.
How is the return on invested capital (ROIC) factored into the Magic Formula for stock selection?
Return on invested capital (ROIC) measures how efficiently a company generates profits from its capital. In the Magic Formula, companies are ranked by both their earnings yield and ROIC. The combination of high values in both metrics helps identify companies that are both undervalued and efficient in using their capital.
My thorough testing awarded TradingView a stellar 4.8 stars!
With powerful stock chart analysis, pattern recognition, screening, backtesting, and a 20+ million user community, it’s a game-changer for traders.

Whether you're trading in the US or internationally, TradingView is my top pick for its unmatched features and ease of use.
Explore TradingView – Your Gateway to Smarter Trading!
