Joel Greenblatt has revolutionized value investing with his well-known “Magic Formula.” This strategy focuses on identifying high-quality companies that are undervalued by the market.
Greenblatt Return on Capital (ROC) is a key magic formula metric measuring how effectively a company generates profits from its capital.
A high ROC is essential for identifying strong, undervalued stocks. These companies are efficient in using their capital to produce earnings, making them attractive investments.
Key Takeaways
- Greenblatt’s Magic Formula centers on the Return on Capital (ROC) and Earnings Yield.
- ROC is essential for identifying high-quality, undervalued stocks.
- Applying this formula can help identify companies that are efficient in using their capital to produce earnings.
- A number above 5% is considered good.
The Greenblatt Magic Formula typically yields impressive results, making it a favorite among investors looking to optimize their portfolios.

Understanding Return on Capital
Return on Capital (ROC) is a key metric used to evaluate a company’s efficiency in generating earnings from its capital base. It helps investors understand how well a company is using its capital to generate profits.
Return on Capital measures a company’s ability to generate profit from its capital, including both debt and equity. This metric considers the profits generated before interest and taxes, making it a useful indicator of operational efficiency. ROC is different from Return on Equity (ROE) because it includes debt in the capital calculation, offering a broader perspective on profitability.
Companies with high ROC are often more efficient in using their capital to produce earnings. This metric is particularly insightful when comparing companies within the same industry. It also helps identify firms that can potentially grow their earnings consistently.
Calculating Return on Capital
Greenblatt’s Return on Capital is calculated using the formula:
(EBIT / (Net Working Capital + Net Fixed Assets)) = Greenblatt ROC
Where:
- EBIT stands for Earnings Before Interest and Taxes.
- Net Working Capital is calculated by subtracting current liabilities from current assets. This includes cash, accounts receivable, inventory, and other current assets minus accounts payable, accrued expenses, taxes payable, and other current liabilities.
- Net Fixed Assets include long-term tangible assets such as property, plant, and equipment. They are calculated by subtracting accumulated depreciation from total fixed assets.
A Practical Example
To put this into context, let’s look at an example. Company A has an EBIT of $1,000, net working capital of $500, and net fixed assets of $2,000. Plug these numbers into the formula, and you get a Return on Capital of 40%.
(1,000 / (500 + 2,000)) = 40%
This means that for every dollar invested in the business, Company A generates 40 cents in earnings. This metric takes into account the company’s profitability and efficiency in utilizing its capital.
Is Greenblatt ROC Profitable?
Yes, my research shows profitable market performance when combining Greenblatt’s earnings yield and return on capital (AKA the magic formula). My LST Beat the Market System, which is built into Stock Rover, demonstrates nine years of high performance.
Charting & Screening for ROC
You do not need to calculate the Greenblatt ROC manually; Stock Rover does it for you. Only Stock Rover provides advanced hybrid financial metrics, such as the Greenblatt Earnings Yield, Altman Z-Score, Piotroski F-Score, Beneish M-Score, Graham Number, Chowder Rule, Yacktman Forward Rate of Return, and the Sharpe ratio.
The chart screenshot below shows the Greenblatt ROC plotted over time.
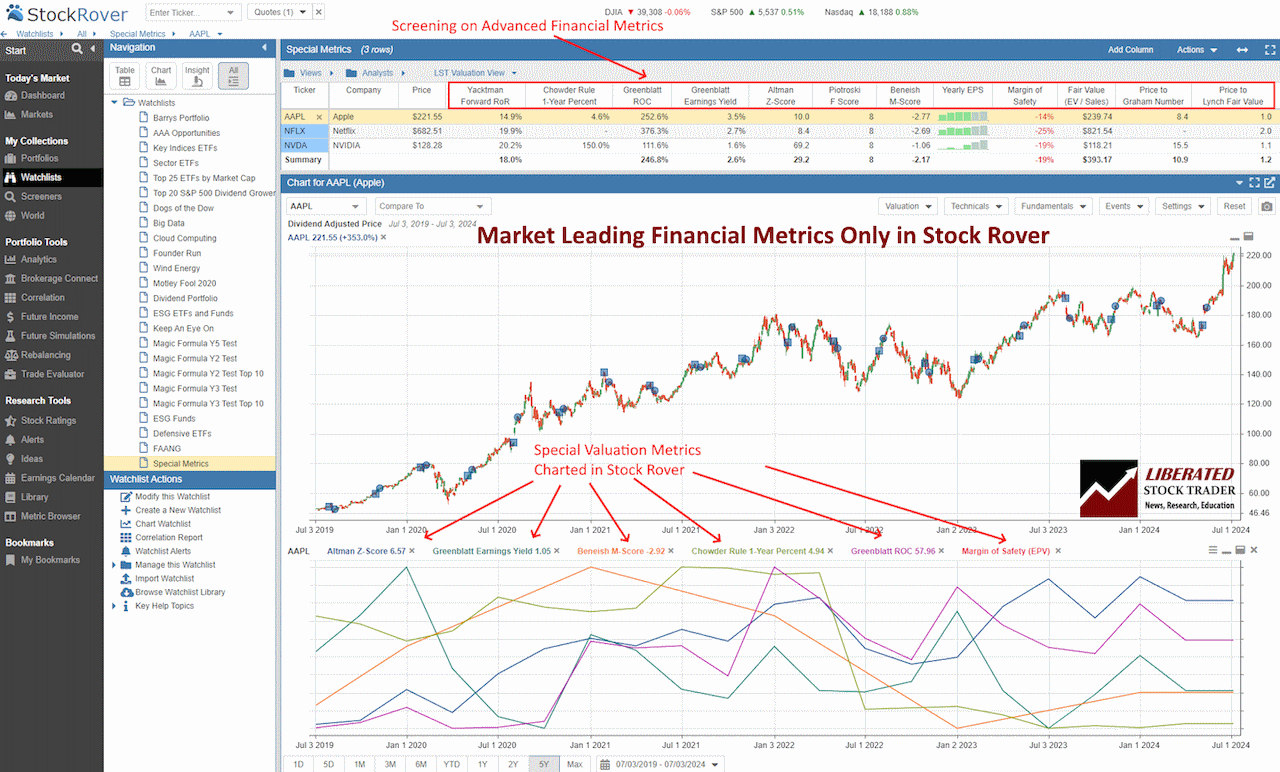
Chart & Screen the Greenblatt ROC with Stock Rover
Greenblatt’s Magic Formula Investing
Joel Greenblatt’s Magic Formula is a stock-picking method that combines the return on capital (ROC) with earnings yield to identify high-quality companies that are also undervalued. The approach aims to simplify investing decisions for value investors.

The Philosophy of Magic Formula Investing
Greenblatt developed the Magic Formula to help investors find good businesses at bargain prices. His method ranks companies based on two criteria: ROC and earnings yield. The ROC measures how efficiently a company uses its capital to generate profits, while earnings yield compares a company’s earnings to its market price. By combining these metrics, Greenblatt aims to identify companies that are both efficient and undervalued.
The formula is designed to be simple and easy to use. It provides a systematic approach to selecting stocks, removing emotional bias from decision-making. This can be especially useful for novice investors trying to navigate the complex world of finance.
Strategies and Criteria
The Magic Formula involves ranking companies based on ROC and earnings yield. Each company receives a rank for its ROC and another for its earnings yield. These ranks are then combined to form a total score. Companies with the best-combined scores are considered the top picks.
To implement the strategy, Greenblatt suggests creating a portfolio of 20-30 stocks. These should be held for a year before being re-evaluated and re-ranked. The portfolio should be evenly weighted, ensuring no single stock has too much influence on overall performance.
Greenblatt also advises focusing on mid to large-cap stocks, as these tend to have more reliable financial data and are less susceptible to market manipulation.
Using Greenblatt ROC in Stock Selection
Using Greenblatt ROC & Yield, the LST Beat the Market System (powered by Stock Rover) has selected the following stocks to outperform the market in 2024
| Ticker | Rank | Company | Free Cash Flow | EPS | Greenblatt ROC | Greenblatt Earnings Yield | 1-Year Return vs S&P 500 | EPS 1-Year Chg (%) |
| TDW | 1 | Tidewater | 113 | $2.57 | 15.3% | 4.5% | 41.6% | 137.7% |
| BROS | 2 | Dutch Bros | -65 | $0.18 | 5.7% | 1.8% | 17.9% | 1700.0% |
| CCJ | 3 | Cameco | 271 | $0.39 | 12.3% | 1.5% | 39.4% | 145.5% |
| EDU | 4 | New Oriental Education | 1,024 | $1.90 | 14.4% | 5.4% | 73.3% | 80.0% |
| MMYT | 5 | MakeMyTrip | 113 | $1.95 | 18.9% | 1.2% | 214.4% | 987.5% |
| NBIX | 6 | Neurocrine Biosciences | 614 | $3.78 | 33.1% | 3.5% | 23.6% | 106.7% |
| NVO | 7 | Novo Nordisk | 7,245 | $2.88 | 115.4% | 2.6% | 51.4% | 33.8% |
| OWL | 8 | Blue Owl Cap | 807 | $0.15 | 94.0% | 3.6% | 30.7% | 140.0% |
| AGYS | 9 | Agilysys | 40 | $3.31 | 15.2% | 0.8% | 25.9% | 637.2% |
| KSPI | 10 | Kaspi.kz | 1,363 | $9.86 | 70.5% | 10.3% | 41.2% | 24.3% |
| WLFC | 11 | Willis Lease Finance | 63 | $8.94 | 7.4% | 8.0% | 43.9% | 52.0% |
| AROC | 12 | Archrock | 46 | $0.83 | 12.0% | 6.1% | 84.7% | 97.6% |
| HWM | 13 | Howmet Aerospace | 818 | $2.08 | 32.2% | 3.5% | 36.3% | 64.3% |
| PDD | 14 | PDD Holdings | 15,584 | $8.05 | 56.2% | 8.2% | 75.3% | 92.4% |
| PNTG | 15 | Pennant Gr | 16 | $0.55 | 9.6% | 2.8% | 84.5% | 25.6% |
| POWL | 16 | Powell Industries | 221 | $8.59 | 31.3% | 9.1% | 108.7% | 176.4% |
| SILV | 17 | SilverCrest Metals | 73 | $0.84 | 31.5% | 10.2% | 29.2% | 55.6% |
| WFRD | 18 | Weatherford International | 675 | $6.33 | 28.4% | 7.6% | 53.9% | 76.4% |
| WLDN | 19 | Willdan Group | 40 | $0.97 | 21.1% | 5.4% | 40.1% | 1075.0% |
| EME | 20 | EMCOR Group | 1,041 | $15.22 | 62.8% | 6.0% | 71.0% | 51.3% |
| MLR | 21 | Miller Industries | 12 | $5.78 | 22.4% | 13.9% | 33.8% | 70.0% |
| NSSC | 22 | NAPCO Security Techs | 42 | $1.28 | 33.8% | 2.7% | 32.2% | 72.6% |
| AGI | 23 | Alamos Gold | 138 | $0.52 | 8.0% | 4.7% | 17.5% | 26.8% |
| CRS | 24 | Carpenter Tech | 181 | $2.66 | 9.9% | 3.9% | 74.6% | 130.7% |
| DY | 25 | Dycom Industries | 89 | $7.86 | 21.6% | 6.1% | 25.5% | 33.3% |
| WAB | 26 | Westinghouse Air Brake | 1,375 | $5.14 | 46.6% | 4.6% | 17.9% | 36.8% |
| AGS | 27 | PlayAGS | 45 | $0.13 | 33.3% | 6.8% | 90.0% | 33.3% |
| KEX | 28 | Kirby | 237 | $4.26 | 73.0% | 4.8% | 30.7% | 45.9% |
| UTHR | 29 | United Therapeutics | 752 | $22.36 | 41.6% | 11.8% | 23.3% | 19.7% |
| ATGE | 30 | Adtalem Glb Education | 239 | $2.72 | 44.5% | 6.2% | 71.0% | 19.3% |
| IHG | 31 | InterContinental Hotels | 811 | $4.44 | 266.0% | 5.9% | 28.0% | 25.0% |
| KGC | 32 | Kinross Gold | 604 | $0.36 | 10.1% | 6.7% | 64.6% | 125.0% |
| LPG | 33 | Dorian LPG | 356 | $7.63 | 20.4% | 15.2% | 53.7% | 53.5% |
| SCS | 34 | Steelcase | 191 | $0.76 | 17.4% | 7.8% | 44.1% | 85.4% |
| OSG | 35 | Overseas Shipholding Gr | 56 | $0.85 | 11.8% | 9.5% | 81.0% | 51.9% |
| Summary | 1,007 | $4.17 | 38.5% | 6.1% | 53.6% | 188.2% |
Ever Dreamed of Beating the Stock Market
Most people think that they can't beat the market, and stock picking is a game only Wall Street insiders can win. This simply isn't true. With the right strategy, anyone can beat the market.
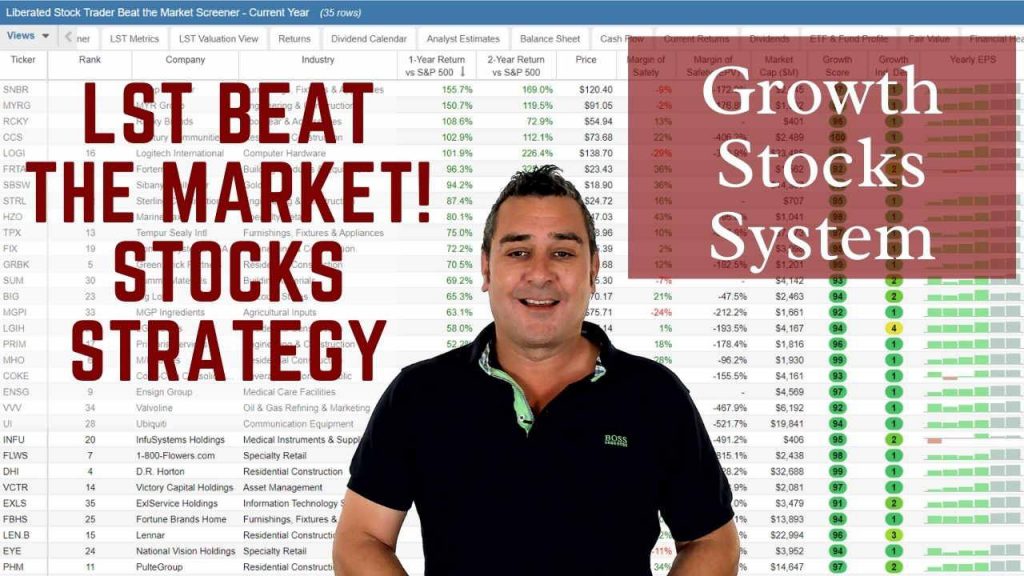
The LST Beat the Market Growth Stock Strategy is a proven system that has outperformed the S&P500 in 8 of the last 9 years. We provide all of the research and data needed to make informed decisions, so you no longer have to spend hours trying to find good stocks yourself.
The LST Beat the Market System Selects 35 Growth Stocks and Averages a 25.6% Annual Return
★ 35 Stocks That Already Beat The Market ★
★ Buy The Stocks & Hold For 12 Months - Then Rotate ★
★ Fully Documented Performance Track Record ★
★ Full Strategy Videos & eBook ★
Take The Pain Out Of Stock Selection With a Proven Strategy
Performance and Backtest Results
Numerous studies have shown that the Magic Formula can generate excess returns. For instance, a backtest of the formula on the Oslo Stock Exchange from 2003 to 2022 indicated significant risk-adjusted returns. This suggests that the method can outperform traditional benchmarks.
Other research supports these findings, showing that the Magic Formula can consistently beat the market over long periods. It offers value investors a straightforward way to achieve better-than-average results without needing extensive financial expertise.
These consistent results make the Magic Formula a valuable tool for anyone looking to invest in quality companies with strong potential for growth.
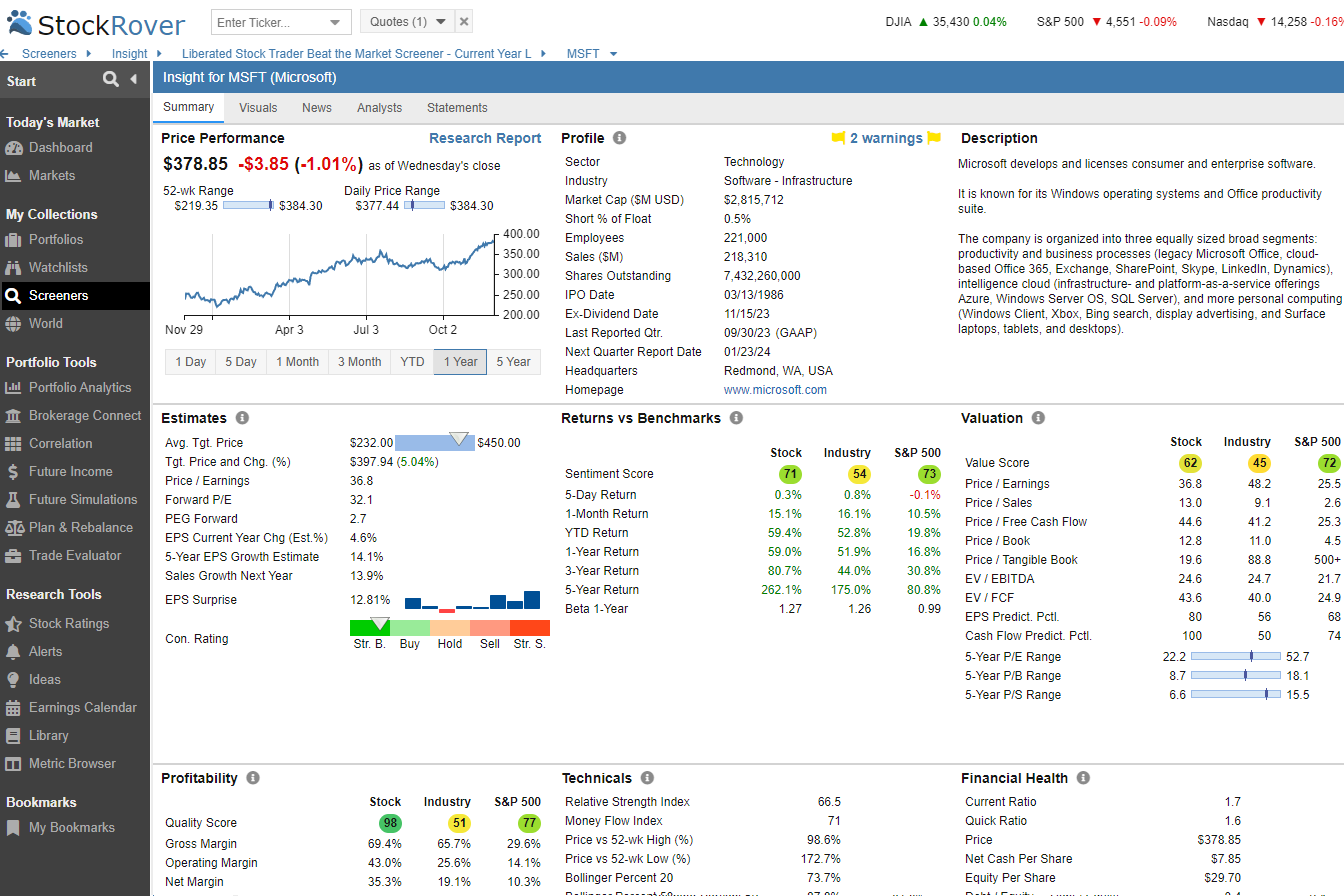
Try Powerful Financial Analysis & Research with Stock Rover
Financial Analysis and Sector Impact
The Greenblatt ROC focuses on maximizing returns through sector-specific strategies and robust financial analysis. Different sectors exhibit unique characteristics, affecting the application of Greenblatt’s methods. Below are the implications and case studies for better comprehension.
Sector-Specific Implications
Different sectors have unique financial structures and performance metrics. For example, the tech sector often shows high growth rates, making its Return on Capital (ROC) metrics more volatile. In contrast, utilities are more stable but capital-intensive.
In the financial sector, the Return on Assets (ROA) is crucial for assessing efficiency. Banks focus on ensuring high ROC by optimizing operating income relative to their assets. Various sectors like healthcare might prioritize revenue over immediate profitability, making sector-specific analysis vital for accurate ROC calculations.
Case Studies of Return on Capital
Different businesses exhibit varied ROC performance. For example, in tech, a study showed that companies with strong innovation but moderate revenue growth still achieved high ROCs. Apple’s efficient use of capital for new products demonstrates this point.
In contrast, real sectors like manufacturing often show fluctuating ROCs due to market demands and raw material costs. Examining Greenblatt’s application in multiple sectors reveals that while ROC is a useful metric, its impact varies.
These case studies highlight the importance of tailored strategies to maximize financial returns. Specific factors such as business model, market conditions, and capital efficiency play crucial roles.
Factors Affecting ROC
Several factors can influence a company’s Return on Capital. Efficient management of working capital, such as inventories and receivables, can significantly boost ROC. Investments in fixed assets, like machinery and buildings, also play a crucial role. The higher the productivity of these assets, the better the ROC.
Debt and equity structure affect ROC as well. Companies with a balanced mix of debt and equity tend to have more sustainable capital structures. High debt levels can lower ROC since interest payments reduce EBIT. Conversely, low debt but high equity may improve ROC by reducing financial costs.
Improving operational efficiency, optimizing asset usage, and maintaining a balanced capital structure can all positively impact a company’s ROC.
Key Considerations for Investors
Market conditions play a crucial role in how ROC impacts investment decisions. During bullish markets, companies with high ROC may see substantial growth in their stock prices. Conversely, in bearish markets, even high ROC companies may struggle.
Investors should analyze current assets and current liabilities to understand a firm’s operating earnings. They should keep in mind the cyclical nature of markets and how ROC might perform differently under various conditions.
Applying Greenblatt’s Concepts
Greenblatt’s investment strategy revolves around selecting companies with high ROCs and low EV/EBIT ratios. This method emphasizes finding companies that can efficiently reinvest earnings.
Investors must be diligent in interpreting financial statements to identify high-ROC firms. By using tools like stock screeners that include ROC and EV/EBIT ratios, investors can more effectively apply Greenblatt’s principles.
Value investing requires a disciplined approach. Investors should continuously evaluate their portfolios and make adjustments based on Greenblatt’s metrics. Maintaining focus on long-term gains rather than short-term market movements is critical for success in this strategy.
By prioritizing these key considerations, investors can better navigate the complexities of the market and improve their chances of achieving sustainable returns.
Try TradingView, Our Recommended Tool for International Traders
Global Community, Charts, Screening, Analysis & Broker Integration
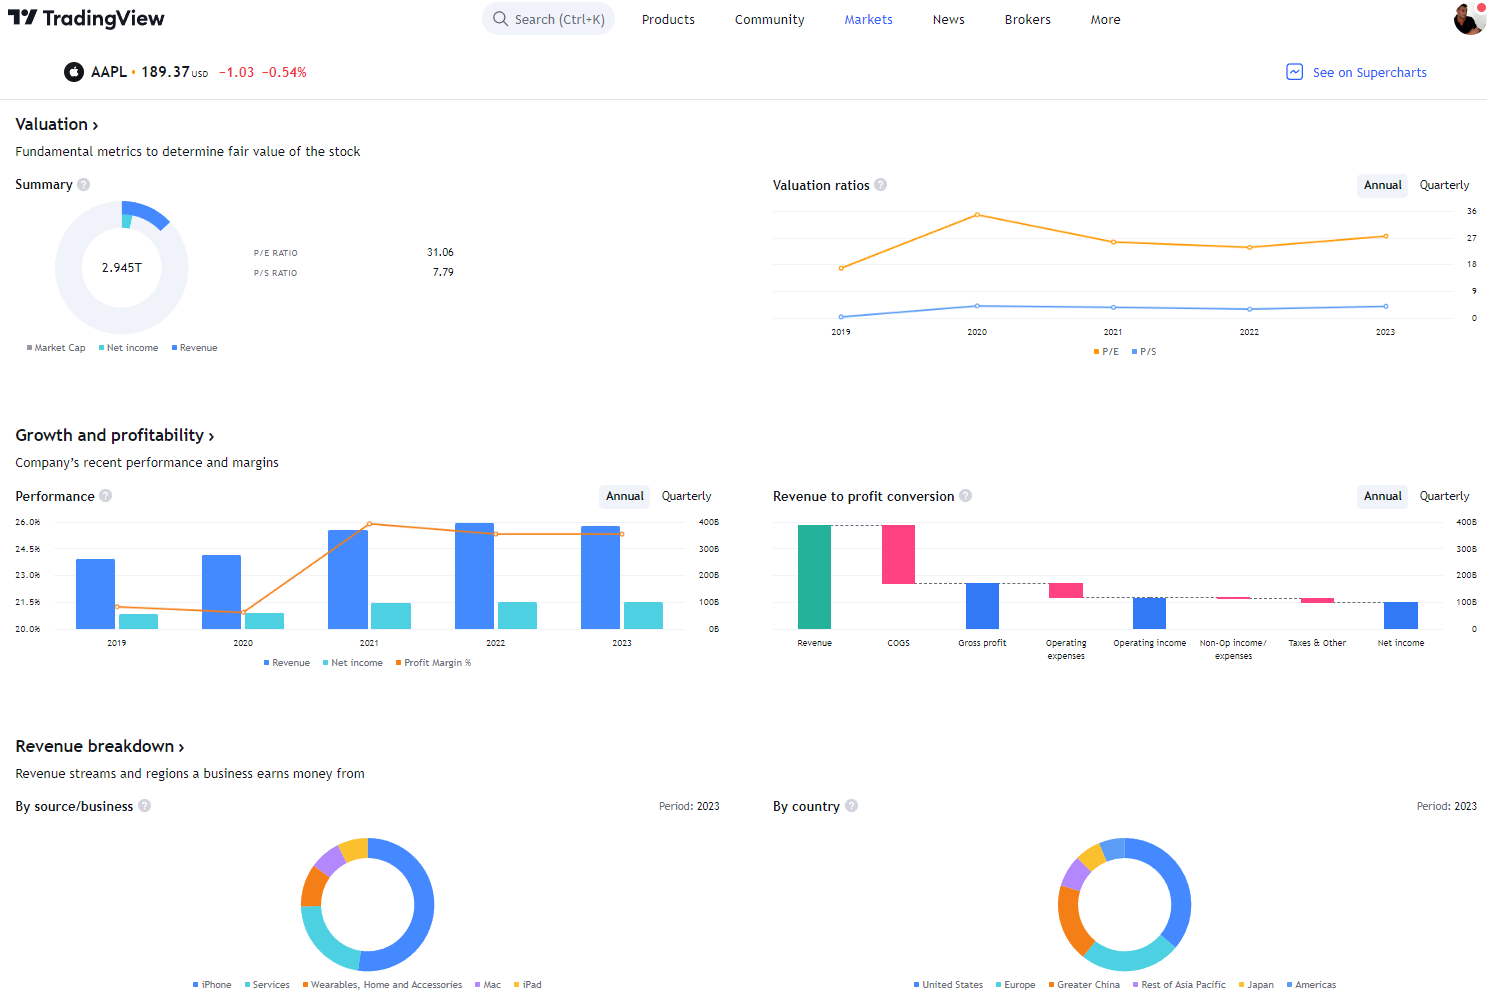
Global Financial Analysis for Free on TradingView
FAQ
How do you calculate Return on Capital using Joel Greenblatt's method?
In Greenblatt's approach, return on Capital (ROC) is calculated by dividing Earnings Before Interest and Taxes (EBIT) by the sum of Net Working Capital and Net Fixed Assets.
What is the best software for charting and analyzing the Greenblatt ROC?
Stock Rover is the best software for screening and charting advanced financial metrics like the Greenblatt ROC. Our testing shows it offers the widest array of metrics and ratios available on the market today.
What distinguishes Joel Greenblatt's Magic Formula from other stock-picking strategies?
Greenblatt's Magic Formula emphasizes simplicity and uses only two main metrics: Return on Capital and Earnings Yield. This differs from other strategies that may include numerous or more complex financial indicators.
Is there a good screener available to identify the Greenblatt ROC?
Yes, Stock Rover provides a screener that can filter stocks based on their Greenblatt ROC and Earnings Yield. It helps investors quickly identify undervalued companies.
Can you explain the concept of Return on Tangible Capital Employed?
Return on Tangible Capital Employed (ROTCE) measures profitability as a percentage of tangible capital used in the business. Tangible capital subtracts intangible assets like goodwill from total capital.
How is the Return on Invested Capital (ROIC) formula derived?
ROIC divides Net Operating Profit After Taxes (NOPAT) by Total Invested Capital. Total Invested Capital includes equity and debt minus non-operational assets.
In what ways does Return on Tangible Capital differ from conventional Return on Capital measures?
Return on Tangible Capital focuses only on tangible assets, excluding intangibles like goodwill. This gives a clearer view of the returns generated on physical assets alone.
What are the key financial metrics used in Greenblatt's Magic Formula for selecting stocks?
Greenblatt's Magic Formula uses Return on Capital and Earnings Yield as its primary metrics. These help identify profitable companies trading at attractive prices.
My thorough testing awarded TradingView a stellar 4.8 stars!
With powerful stock chart analysis, pattern recognition, screening, backtesting, and a 20+ million user community, it’s a game-changer for traders.

Whether you're trading in the US or internationally, TradingView is my top pick for its unmatched features and ease of use.
Explore TradingView – Your Gateway to Smarter Trading!
