The shark is a price pattern formation within harmonic analysis that has captured the interest of traders looking to improve their strategy’s profitability.
The Shark pattern has a unique structure that follows predefined Fibonacci ratios, which indicate potential reversal zones. This pattern guides traders on entry and exit points using historical price patterns.
Sure, the pattern has a memorable name, but is it worth trading it?
Is it profitable? My research dives into the question, is trading the shark worth it?
Key Takeaways
- The Shark Pattern is a unique harmonic trading formation created by Scott Carney.
- Carney does not share any backtesting results in his harmonic trading books.
- The shark is one of the most profitable harmonic patterns.
- The bullish shark proves profitable, hitting its target 66.75% of the time, with an average trade gain of +2.94% on the Nasdaq 100 index.
- Testing the bearish shark showed it should be avoided as it is unreliable.
- Identifying the shark pattern manually on charts is complicated and involves recognizing specific Fibonacci ratios.
- Traders can use a TradingView Harmonics indicator to identify and backtest the pattern on charts automatically.
Identifying the Shark Pattern
Like all harmonic patterns, the shark relies on Fibonacci ratios. However, the shark is outside the typical M and W harmonic framework. This section discusses the pattern’s structure and how to differentiate between bullish and bearish variations.
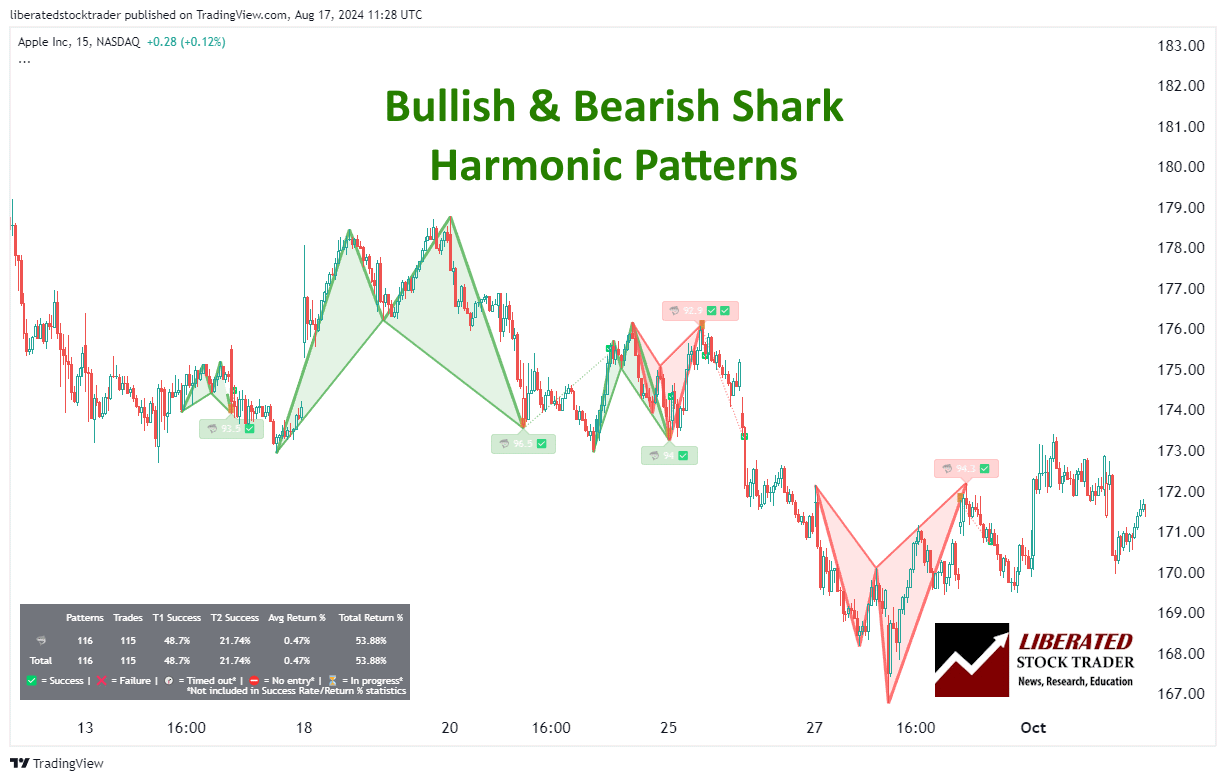
The Shark pattern includes specific swings: 0X, XA, BC, and CD. The XA forms the initial move. The BC swing then retraces AB by either 0.382 or 0.886. Following this, the CD leg extends to between 113% and 161.8% of the BC swing.
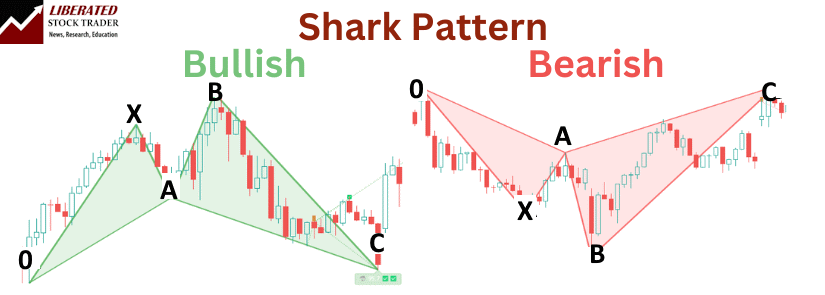
Fibonacci ratios play a crucial role, particularly in that the C leg shows extreme retracement from A by 1.618 to 2.24.
| Shark Leg | Move | Retracement/Extension |
|---|---|---|
| 0X | Initial Move | N/A |
| XA | Initial Move | N/A |
| AB | Extension | 1.13 – 1.618 of X |
| BC | Retracement | 1.618 to 2.24 |
| CD Target | Extension | A and B |
All this talk of Fibonacci ratios gets complicated very quickly, so allow me to show you how to automate these tricky calculations.
Automating Shark Pattern Identification
Harmonic patterns like the shark are incredibly difficult to identify manually. However, you can avoid searching and drawing them because TradingView has a special indicator that can detect all harmonic patterns automatically.
I have tested most of the harmonic indicators in TradingView, and the best one to enable is below.
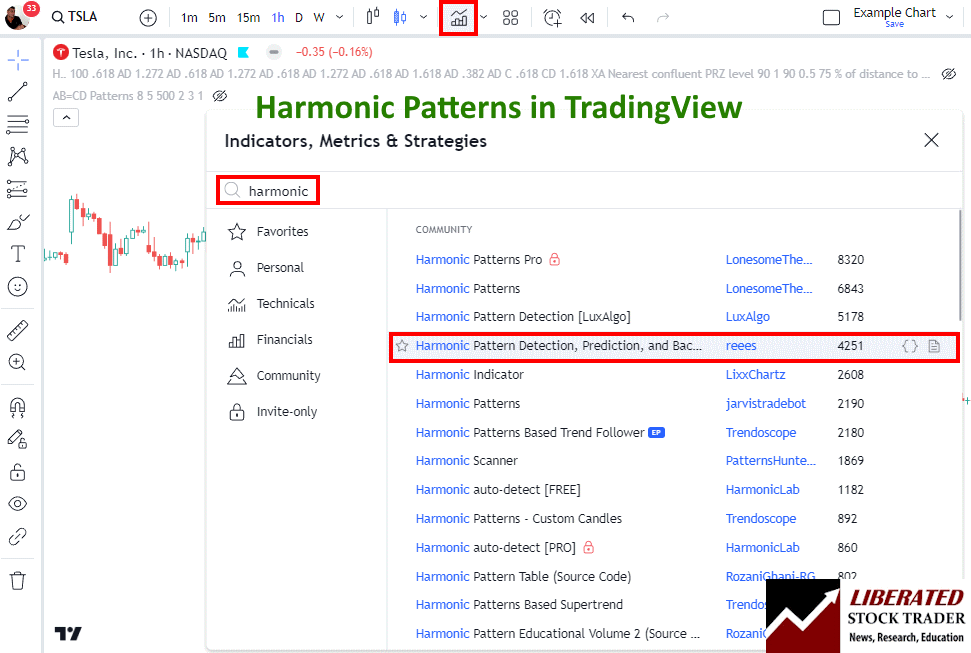
To enable automated harmonic pattern detection in charts, follow these steps:
- Visit TradingView
- Select Indicators -> Search for Harmonic
- Select Harmonic Pattern Detection by User “Reees”
This script not only identifies the patterns but also performs backtesting automatically.
Trading Bullish Sharks
Bullish Shark patterns begin with a downtrend (XA). After a retracement (BC), the final leg (target) extends upwards, suggesting a potential price reversal. The first price target is A, and the second is C, as defined in the chart below.
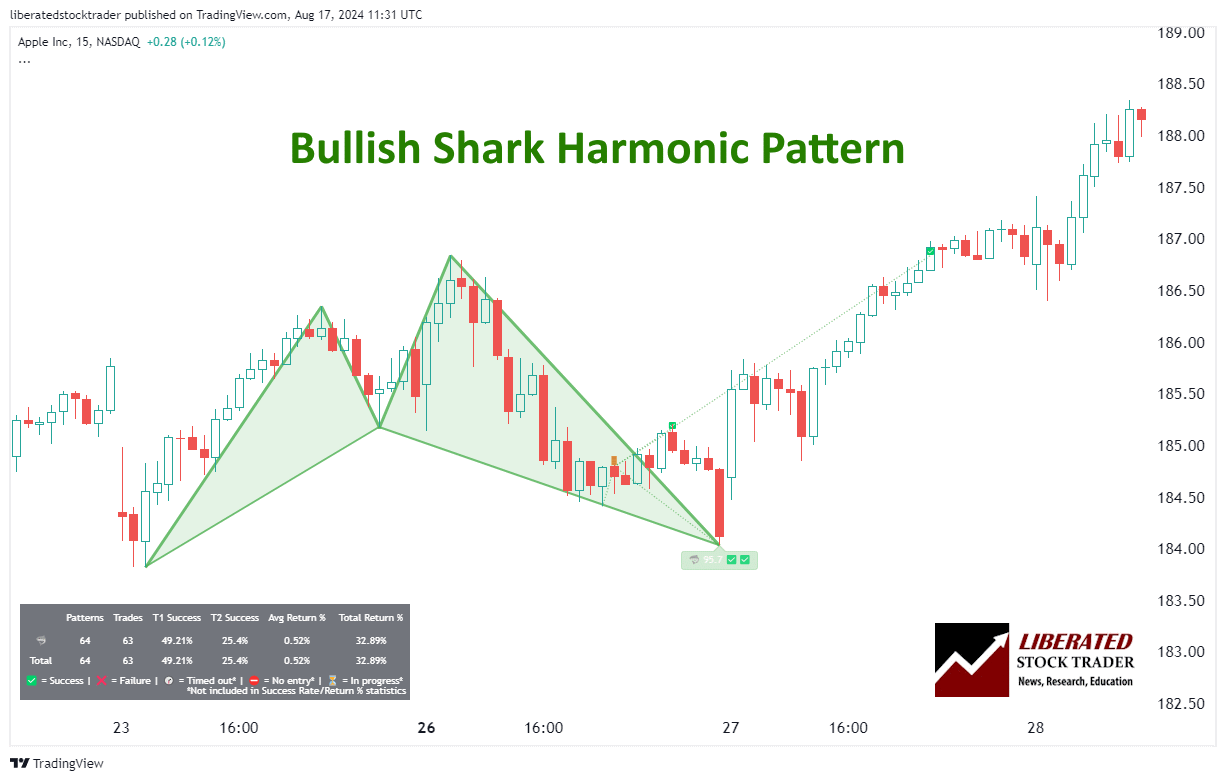
Automatic Shark Pattern Recognition with TradingView
6 Steps for Trading a Bullish Shark
- Ensure the pattern occurs in a downtrend in a bull market.
- When point C is confirmed, wait for a price increase to begin.
- Set a stop-loss under point C.
- The initial price target is point A, and the secondary target is point B.
- Once the price reaches the initial target, consider taking partial profits and trailing your stop-loss to secure any gains.
- If the price continues to rise, you can use additional Fibonacci retracement levels as potential exit points or set a new take-profit point at a key resistance level.
Is the Bullish Shark Reliable or Profitable?
Yes, based on our backtested trades, the bullish shark performs well and is reliable. Based on 23 years of S&P 500 data, it achieved its price target 54.35% of the time, with a 1.69% average return per trade. On the Nasdaq 100, it achieved its target of 66.75% with an average trade of +2.94%
Performance varies incredibly for each stock; for example, Tesla had only a 28% win rate and a 35% average loss per trade.
Trading the bullish shark with Microsoft Corp. would have resulted in 68.75% of trades hitting the price target, which produced an average return per trade of 6.29%.
Because of these mixed results, traders should ensure they trade stocks in a strong uptrend.
Trading Bearish Sharks
Bearish Shark patterns begin with a downtrend (AB). After a retracement (BC), the final leg (target) extends downwards, suggesting a potential price reversal. The first price target is A, and the second is C, as defined in the chart below.
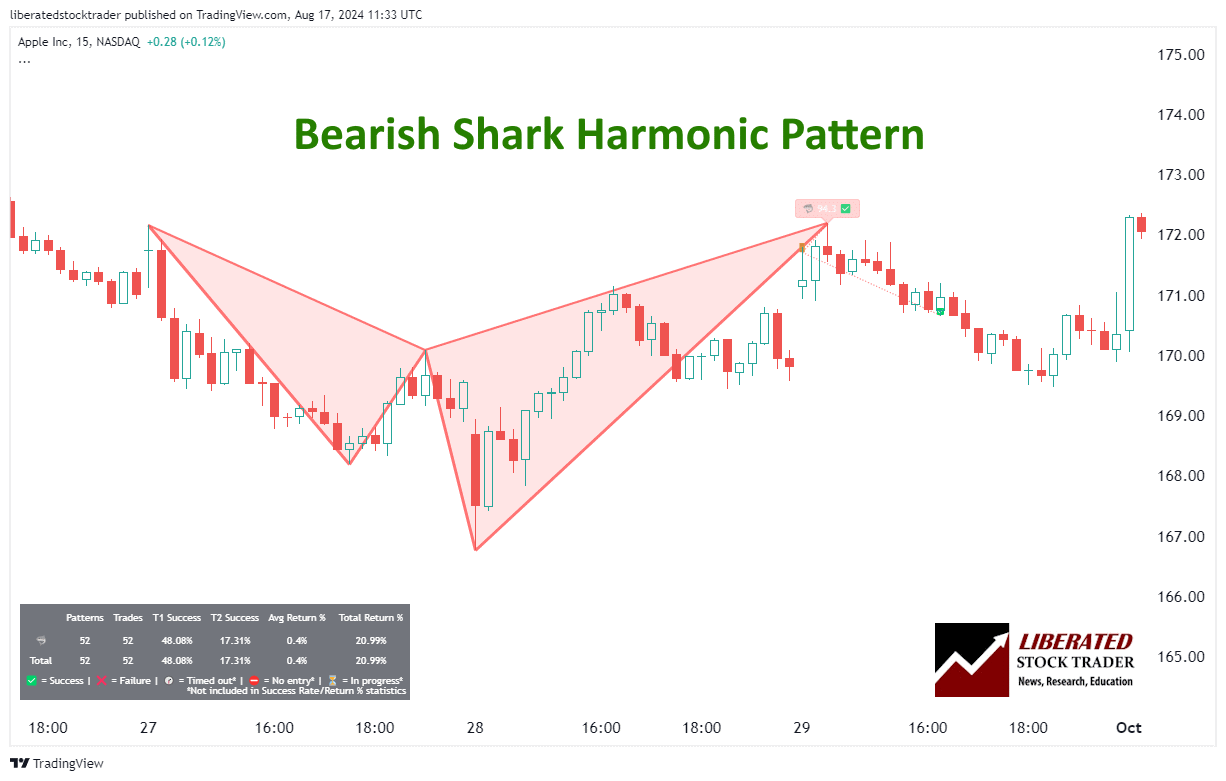
6 Steps for Trading a Bearish Shark
- Ensure the pattern occurs in an uptrend in a bear market.
- When point C is confirmed, wait for a price decrease to begin.
- Set a stop-loss above point C.
- The initial price target is point A, and the secondary target is point B.
- Once the price reaches the initial target, consider taking partial profits and trailing your stop-loss to secure any gains.
- If the price continues to fall, you can use additional Fibonacci retracement levels as potential exit points or set a new take-profit point at a key resistance level.
Is the Bearish Shark Reliable or Profitable?
No, trading the bearish shark pattern is not reliable. Based on our backtested trades on 23 years of Nasdaq 100 exchange data, it achieved its price target only 38% of the time, with a 1.8% average loss per trade. The S&P 500 was similar, with a price target achieved only 38% of the time and a 0.85% average loss per trade.
Performance varies incredibly for each stock; for example, Tesla had a 71% win rate and a 23.66% average win per trade.
However, trading the bearish shark with Microsoft Corp. would have resulted in only 41% of trades hitting the price target, which produced an average return per trade of 0.04%.
Because of these mixed results, traders should use this pattern only in strong downtrends.
Try TradingView, Our Recommended Tool for International Traders
Global Community, Charts, Screening, Analysis & Broker Integration
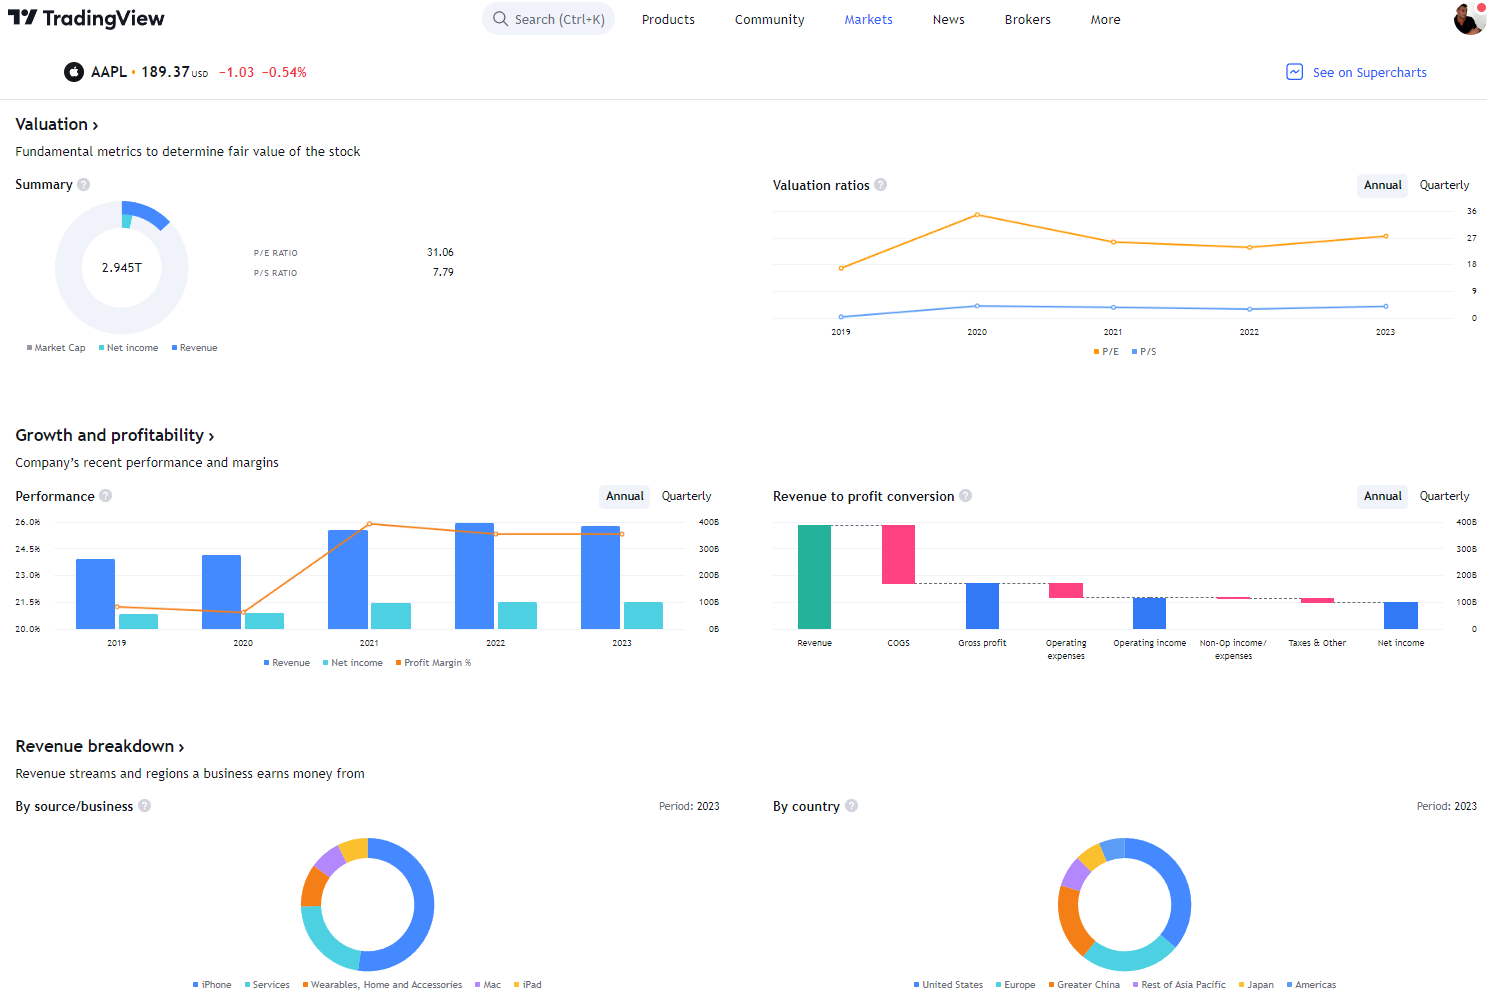
Global Financial Analysis for Free on TradingView
Trading the Shark Pattern
Utilizing the Shark Pattern in trading involves strategic entry points and precise stop loss and profit targets. This approach maximizes opportunities by focusing on key technical indicators and price structures.
Setting Up Entry Points
Identifying the Potential Reversal Zone (PRZ) is crucial. The Shark Pattern forms when the price structure reaches point C. Traders often use additional technical indicators like RSI or Stochastics to confirm the likelihood of a reversal.
Charts and price actions at these levels provide visual confirmation. Active management and vigilance ensure timely and accurate executions.
Determining Stop Loss and Profit Targets
Placing a Stop Loss is essential to manage risk. A Protective Stop Loss should be set just beyond the Potential Reversal Zone to avoid premature exits due to minor price fluctuations.
Combining Shark Patterns With Other Indicators
Using highly profitable chart indicators, such as VWAP, Stochastics, and the Alligator in shark pattern trading, could strengthen the trading strategy. You can test these combinations using TradingView.
Trading Sharks in Forex and Futures
Shark patterns can also be used in Forex trading. My backtesting on the EUR/USD revealed a 56% chance of the price target being achieved and a 1.2% average trade return. For the USD/EUR, the success rate is 48%, with a lower 0.12% average win per trade.
Do Shark Patterns Work?
Yes, bullish shark patterns work well on indices, usually between 54% and 66% of the time. On individual stocks, the profit per trade can vary widely from fractions of a percent to 8% per trade. But avoid trading bearish shark patterns.
Testing the shark on major Forex pairs did yield strong results on some currency pairs and not on others. Average win percentages varied between 45% and 55%, with average returns between 0.1% and 1.2%.
Is the Shark Pattern a Good Trade?
Yes, in my opinion, the bullish shark pattern has solid testing results, with some highly profitable trades and some losers. However, the bearish shark should be avoided, as it leads to many losses. Ensure you test before trading this pattern.
The Most Reliable Chart Patterns
Decades of research reveal the Head and Shoulders as the most reliable chart pattern, boasting an impressive 89% success rate. Following closely are the Double Bottom at 88% and the Triple Bottom and Descending Triangle at 87%. The Rectangle Top emerges as the most profitable, yielding an average win of 51%, closely trailed by the Rectangle Bottom at 48%.
- Find out more about reliable chart patterns in this article.
Other Harmonic Patterns
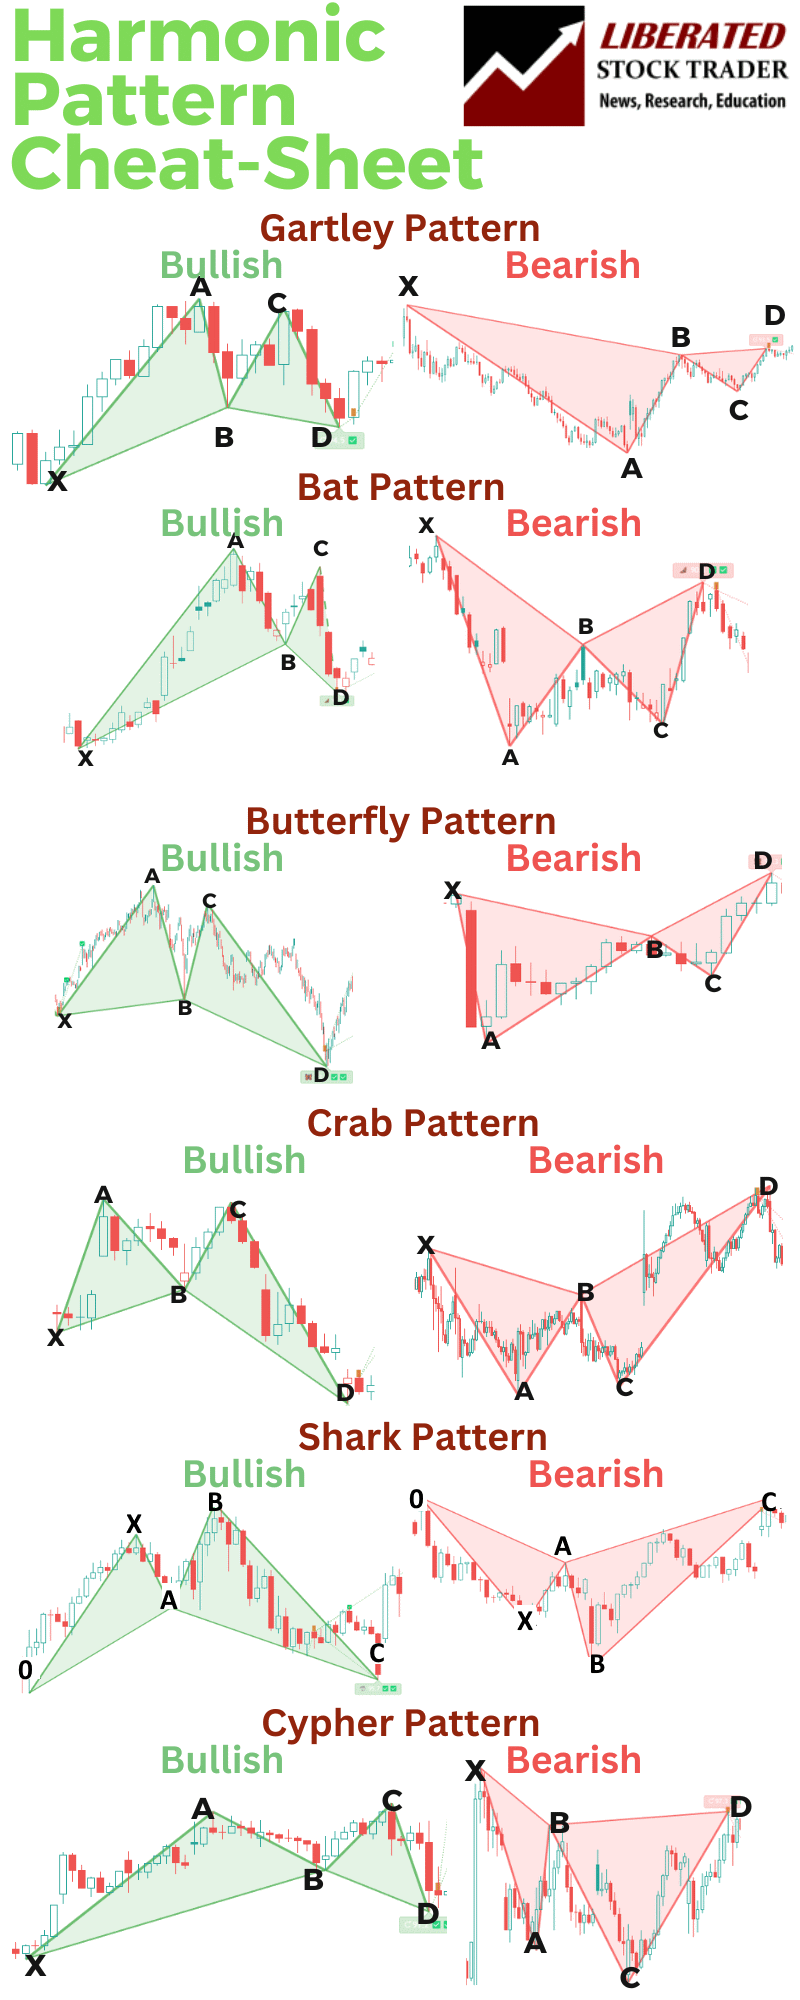
The six key harmonic patterns in technical analysis are Gartley, Bat, Crab, Butterfly, Shark, and Cypher. While the shark pattern is relatively new, understanding all pattern performance is crucial for harmonic traders.
Our Harmonic Patterns Cheat Sheet
FAQs
What is the best software for trading a shark chart pattern?
After extensive testing, I personally use TradingView to backtest and trade harmonic patterns like the shark. Its custom indicator, Harmonics, automatically detects all harmonic patterns.
How can one identify a shark pattern in trading charts?
A shark pattern in trading charts is distinguished by its specific five-point structure labeled as O, X, A, B, and C. It typically reflects a harmonic pattern used to predict potential price movements. This pattern involves precise Fibonacci retracement and extension levels, mainly focusing on the 0.886 and 1.13 ratios.
What are the key differences between a shark and a cipher pattern?
The shark and cipher patterns both help predict market reversals. The shark pattern is characterized by its focus on the specific Fibonacci ratios mentioned above. In contrast, the cipher pattern distinguishes itself by its precise 0.786 retracements from the X to C move and a final reversal point that aligns with 0.618.
How does a bullish shark pattern help investors?
A bullish shark pattern indicates a potential reversal from a bearish trend to a bullish trend. For investors, this suggests an opportunity for buying or entering long positions. The pattern usually signals the end of downward price movements and the beginning of new upward trends.
How do you identify a shark pattern on charts?
I recommend using TradingView to identify shark patterns automatically. Doing it manually is exceptionally time-consuming and prone to errors.
What is the completion point in a bullish shark pattern?
In a bullish shark pattern, the completion point serves as a crucial level where traders often look to enter positions. This point marks the potential reversal area where buying pressure may start to outweigh selling pressure, indicating a shift towards a bullish market sentiment.
How can traders manage risk when trading a bullish shark pattern?
To manage risk when trading a bullish shark pattern, traders can consider placing stop-loss orders below the point where the pattern would be invalidated. This risk management strategy helps protect against potential losses if the anticipated bullish reversal does not materialize as expected.
