Algorithmic trading is a method of executing trades using automated pre-programmed trading instructions to account for variables such as time, price, indicators, patterns, and volume. It is designed to move at a speed and consistency beyond the capability of a human trader.
Typically, the strategies behind algorithmic trading are based on a combination of mathematical models, statistical analysis, and rigorous backtesting, enabling traders to achieve their goals in the markets.
I have spent many years developing algorithmic approaches to investing. I currently use two systems for my trading. The Market Outperforming Stock ETF System (MOSES) and the Liberated Stock Trade Beat the Market (LSTBTM) stock selection strategy.
In this guide, I will show you my approach to developing an algorithmic trading system from scratch to implementation. I will also share many of the indicator and pattern test results I have performed in the past.
The use of algorithms in trading has several advantages, such as minimizing emotional decision-making, reducing the impact of market noise, and ensuring disciplined trading. However, traders must be aware of the risks, which include system failures, network connectivity issues, and the intricacies of the trading algorithms themselves.
Key Takeaways
- Algorithmic trading uses software to execute trades with precision, consistency, and speed.
- The core elements of algorithmic trading are price, volume, indicators, and patterns.
- Automated strategies improve your confidence and reduce your emotions.
- Developing a successful system can take from months to years.
- Algo trading also has technological risks that must be managed.
Understanding Algorithmic Trading
Algorithmic Trading, sometimes known as ‘Algo-Trading,’ is the practice of using algorithms (a set of instructions) to buy and sell securities on an exchange. These algorithms are designed to execute orders according to a predetermined trading strategy. The main goals are to execute trades at optimal prices, reduce human error, and increase efficiency.
Key Components of Algo-Trading
The essential components of Algo-Trading involve:
- Algorithmic trading software:
- At the heart lies sophisticated software capable of executing trades without manual intervention, according to predefined criteria.
- A trading strategy:
- This outlines the specific conditions under which trades will be initiated, managed, and closed. Strategies can be as simple as entering a trade at a certain price or as complex as a multiphase algorithmic model considering various market factors.
Ensuring effective trade execution, these algorithms monitor the market for the right price movements and timing, often executing large volume trades in fractions of a second, which is beyond human capability.
My thorough testing awarded TradingView a stellar 4.8 stars!
With powerful stock chart analysis, pattern recognition, screening, backtesting, and a 20+ million user community, it’s a game-changer for traders.

Whether you're trading in the US or internationally, TradingView is my top pick for its unmatched features and ease of use.
Explore TradingView – Your Gateway to Smarter Trading!
Advantages of Algorithmic Trading
Algorithmic trading harnesses computational power to execute trades at optimal speeds and volumes, enabling efficiency that surpasses human capabilities. By emphasizing precision in timing and consistency in trade execution, it capitalizes on opportunities that would be impossible to leverage manually.
Additionally, a fundamental advantage of algorithmic trading is its ability to reduce emotional decision-making. Algorithms adhere strictly to a predefined set of rules, eradicating the erratic nature of human psychology from the trading process.
Finally, the discipline required to develop, backtest, and implement an algo strategy helps improve your confidence and commitment to the system.
8 Steps to Create Your Algo Trading System
To create an algo trading system, I recommend choosing a strategy, selecting a trading platform, choosing the asset type, selecting the indicators and patterns, backtesting, and refining the strategy.
1. Choose a strategy
Arbitrage and trend following are the two most common strategies employed by algo traders.
Arbitrage Strategies
Arbitrage strategies seek to exploit price discrepancies across different markets or related financial instruments. One common example is Triangular Arbitrage, which involves three currency trades to capitalize on differences in exchange rates. Another is Statistical Arbitrage, which uses complex mathematical models to identify price differences of similar assets. These strategies rely heavily on high-speed execution as the discrepancies they target can be fleeting.
- Example: If gold is priced differently on two exchanges, an arbitrage algorithm can buy on the lower-priced exchange and sell on the higher-priced one to capture the price difference.
- Challenges: Arbitrage is the most common strategy used by hedge funds in high-frequency trading (HFT). It provides a stable source of income by executing many small trades for fractions of a cent profit. Implementing this strategy for independent investors is a challenge because it is expensive and complex. You will need a highly available, powerful computer connected directly to the exchange and a zero commissions broker. This all comes at great expense.
- Recommendation: Retail investors should avoid the complexity and cost involved in HFT algo trading.
Trend Following Strategies
Trend-following strategies are designed to detect and exploit market trend direction. Algorithms may use indicators like moving averages, momentum indicators, and rate of change when initiating trades. They work on the principle that markets have momentum and are likely to continue in their primary trend once established.
- Example: An algorithm might generate a buy signal when a stock’s short-term moving average crosses above its long-term average, suggesting the beginning of an upward trend.
- Challenges: With so many indicators, patterns, and strategies available in a system, it is difficult to know where to start. Fortunately, in the next section, I will share the most successful strategies I have personally tested.
- Recommendation: Trend-following strategies are the place to start when creating your algo trading system.
2. Select the Algo Trading Platform to Match Your Strategy
Once you have determined your trading strategy, the next step is to choose the right algo trading platform to implement it. Various options are available in the market, each with its own unique features and capabilities. Some popular platforms for HFT trading currencies include MetaTrader 4 and NinjaTrader.
When selecting a platform, consider factors such as ease of use, reliability, backtesting capabilities, and compatibility with your chosen strategy. It’s also important to check if the platform offers access to real-time market data and allows for customization of parameters and rules.
Additionally, some platforms offer built-in libraries of technical indicators and charting tools that can be useful for developing your strategy. Others may have social sharing features where you can learn from other traders’ strategies or even copy trade.
My Favorite Algo Trading Software
Here is my recommended and hands-on tested software for algorithmically trading stocks, crypto, and currencies.
- TrendSpider: Point & Click Algo Creation, Backtesting & Execution (I use this the most)
- Trade Ideas: Leading Pre-Build Algorithmic Trading Solution
- TradingView: Global Stocks & Crypto Algo Trading Platform
- Tickeron: Hundreds of Tested Trading Algo’s & Strategies
- VectorVest: Algo Signals for Stock Traders
Algo Trading Software Compared
| Algo Trading Software | TrendSpider | TradeIdeas | TradingView | Tickeron | VectorVest |
| Awards |  |
 |
|||
| Algo Software Rating |
4.8 | 4.7 | 4.6 | 4.4 | 4.0 |
| Trading Signals |
✅ | ✅ | ✅ | ✅ | ✅ |
| Alerts |
✅ | ✅ | ✅ | ✅ | ✅ |
| Algo Pattern Recognition |
✅ | ✅ | ✅ | ✅ | ✅ |
| Structured Algo Strategies |
✅ | ✅ | ✅ | ✅ | ✅ |
| Backtesting |
✅ | ✅ | ✅ | ✅ | ❌ |
| Point & Click Backtesting |
✅ | ❌ | ❌ | ❌ | ❌ |
| Automated Trading Bots |
✅ | ✅ | ✅ | ❌ | ❌ |
| 1-on-1 Training |
✅ | ❌ | ❌ | ❌ | ❌ |
| Try It | TrendSpider | TradeIdeas | TradingView | Tickeron | VectorVest |
Table 1: Algo Trading Software Comparison Table & Ratings
3. Select the assets to trade
It is important to select the assets you want to trade. I personally trade only stocks and ETFs using short-, medium-, and long-term trend-following strategies. This allows me to stay in the market longer and extract higher returns over time. Stocks typically move from 0.5 to 5% in a single day and swing trading over ten days can yield profits or losses of 20% or more.
When trading currencies, price movements are often minimal. As a result, leveraging is necessary to achieve substantial profits, but it also carries substantial risks.
The rest of the steps in this overview will focus on stocks, but many of the patterns and indicators can also be applied to currency trading.
4. Observe the market action
After selecting your assets, it’s time to observe the market action. This means monitoring the price movements of the stocks or currencies you’ve chosen to trade.
When I say observe, I mean really take time to understand exactly what the chart and indicators are telling you. Pay attention to any significant uptrends or downtrends, as well as any notable support and resistance levels.
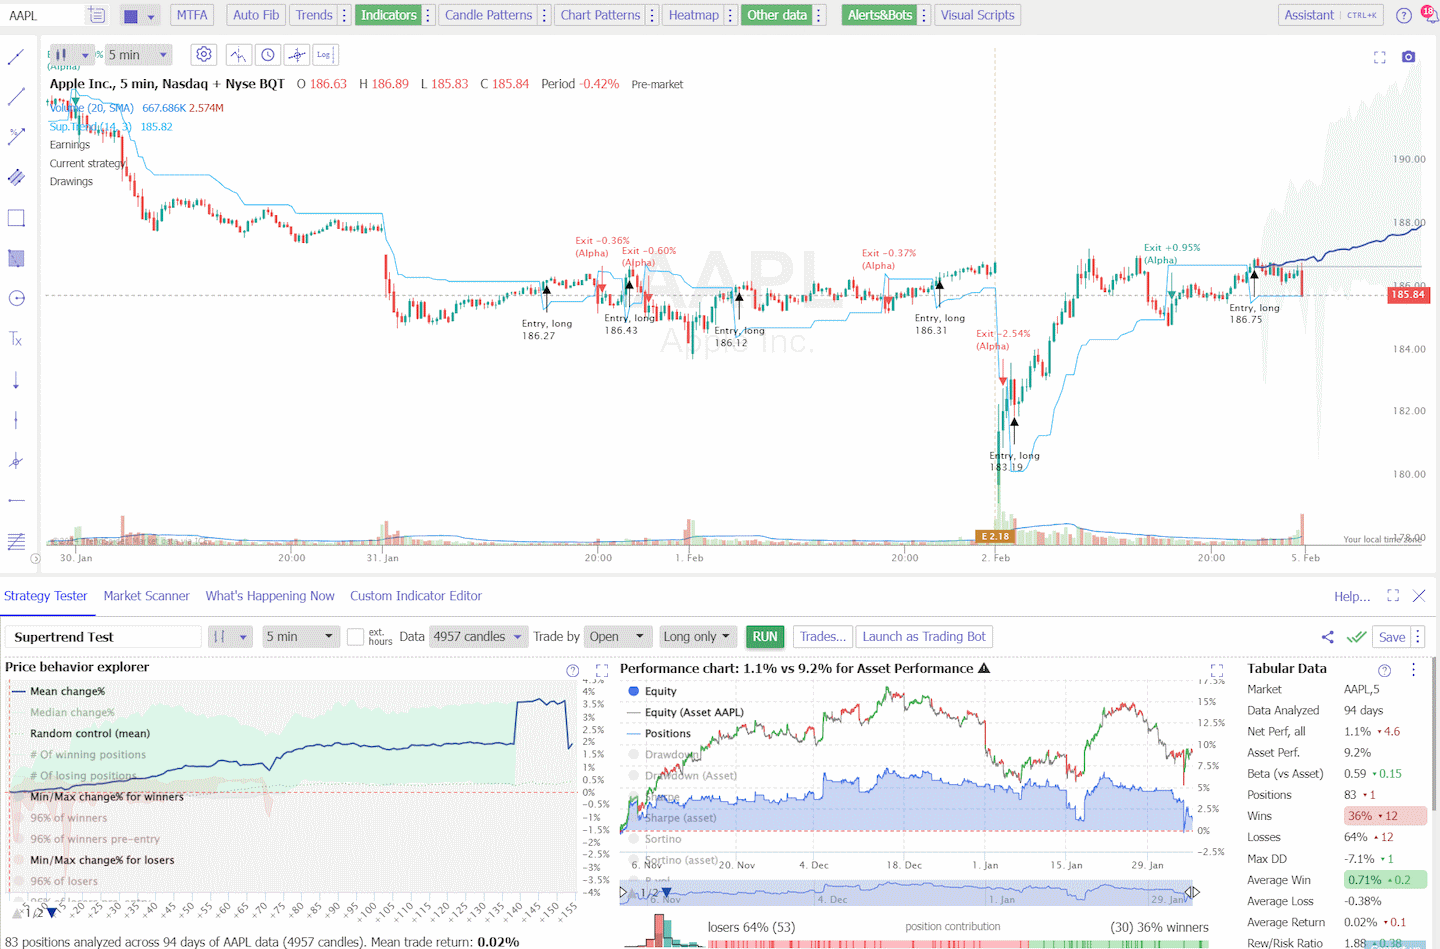
You can plot technical indicators such as moving averages, Rate of Change, Bollinger Bands, or MACD (Moving Average Convergence Divergence) to help identify potential trend reversals or continuation patterns. Ask yourself these questions:
- Do the indicators help predict future price movements?
- Do they produce false signals?
Additionally, it’s important to monitor any relevant news or events that may impact the market. This could include company earnings reports, economic data releases, or geopolitical developments.
5. Select the indicators and patterns to test
Now that you have observed the market, it’s time to start selecting and testing the charts, indicators, and patterns you may want to use in your system.
This can be incredibly time-consuming, especially when starting from scratch. However, I have been testing indicators, candle patterns, and chart patterns for decades and can provide you with performance statistics, which will save you time.
The core components of an algorithmic trading system are the chart type, indicators, chart price patterns, and candlestick patterns. The next section highlights my test results and article to read for a more in-depth analysis.
Chart Types
My research indicates that traders benefit most from utilizing Heikin Ashi, Candlestick, Raindrop, and Renko charts. These chart types offer a well-rounded mix of price data and trend reversal signals, aiding investors in crafting robust trading strategies.
Heikin Ashi Charts
According to our testing, Heikin Ashi (HA) charts are the best-performing charts. They factor in recent price action to create more reliable and accurate data points than regular candlestick charts. It makes them ideal for traders who need to identify potential trading signals and long-term investors who want to confirm their investment strategies.
Japanese Candlestick Charts
Japanese Candlestick charts provide a graphic representation of price data over time. They comprise a body (the area between the open and closing price) and shadows (the area above or below the body).
The key benefit of using candlestick charts is that they allow traders to quickly identify potential patterns in the market, which can help them decide when to enter or exit a trade. For example, if a pattern appears where the upper shadow is consistently larger than the lower shadow, then this could indicate that buying pressure is increasing.

Heikin-Ashi Charts on TradingView
Price Patterns
Believe it or not, chart patterns really work. Not all of them, just a specific set of patterns, have proven to be reliable and profitable over time. These patterns are formed by the movement of stock prices on a chart, and they can provide valuable insights into future price movements.
This table shows the chart pattern success rate/probability of a price increase in a bull market and the average price increase after emerging from the pattern. For example, the inverse head and shoulders pattern has an 89% chance of success when the price moves up through the resistance level, and the average gain is 45%.
Price Pattern Reliability Table
| Reliable Chart Patterns | Success Rate | Average Price Change |
| Inverse head and shoulders | 89% | 45% |
| Double-bottom | 88% | 50% |
| Triple bottom | 87% | 45% |
| Descending Triangle | 87% | 38% |
| Rectangular top | 85% | 51% |
| Rectangle bottom | 85% | 48% |
| Bull flag | 85% | 39% |
| Ascending triangle | 83% | 43% |
| Rising Wedge | 81% | 38% |
Get the full results in this article: 12 Accurate Chart Patterns Proven Profitable & Reliable.
Indicators
Chart indicators are another way to analyze stock price patterns and determine potential breakout opportunities.
My analysis of 10,400 years of exchange data reveals that the most effective day trading indicators include the Price Rate of Change, VWAP, Weighted Moving Average, Hull Moving Average, Simple Moving Average, and RSI. These indicators have been shown to generate successful trades at a rate of at least 43%.
Conversely, numerous stock chart indicators result in losses when not properly configured.
Chart Indicator Win Rate Results
| Trading Indicators | Chart | Win Rate |
| Price Rate of Change | 5-min | 93% |
| VWAP | 5-min | 93% |
| Weighted Moving Average | 5-min | 83% |
| Hull Moving Average | 5-min | 77% |
| Simple Moving Average | 5-min | 70% |
| Relative Strength Index | 5-min | 53% |
| Commodity Channel Index | 60-min | 50% |
For the full results, see this article: 10 Best Day Trading Indicators Proven with Data!
Candlestick Patterns
Candlestick patterns represent the psychology of people trading in a market. They comprise one or more candlesticks representing a particular trend or movement in the asset’s price. According to our testing, the most reliable and profitable candlestick patterns include the Inverted Hammer, Bearish Marubozu, Doji, and Bearish Engulfing patterns.
Candlestick Pattern Performance Results
The Inverted Hammer shows the highest reliability with a % profit per trade at 1.12% and a 60.0% success rate. Following closely are the Bearish Marubozu, Gravestone Doji, and Bearish Engulfing.
| Top Candle Patterns | % Profit/Trade | % Winners |
| Inverted Hammer | 1.12% | 60.0% |
| Bearish Marubozu | 0.80% | 56.1% |
| Gravestone Doji | 0.65% | 57.0% |
| Bearish Engulfing | 0.62% | 57.0% |
| Bullish Harami Cross | 0.58% | 55.3% |
For the full research, see this article: Top 10 Reliable Candle Patterns: 56,680 Trades Tested
6. Backtest and tune criteria combinations
Now, you have a starting point for testing. You have chosen your asset, indicators, price patterns, and charts. This is how we begin the really fun part: backtesting.
Backtesting begins with a hypothesis on market behavior, like the idea that prices move in waves. Traders then create and fine-tune a strategy based on this hypothesis, testing it with historical data to check if it’s profitable over time. The key is to verify your hypotheses and assess different strategy performances.
Backtesting with TrendSpider
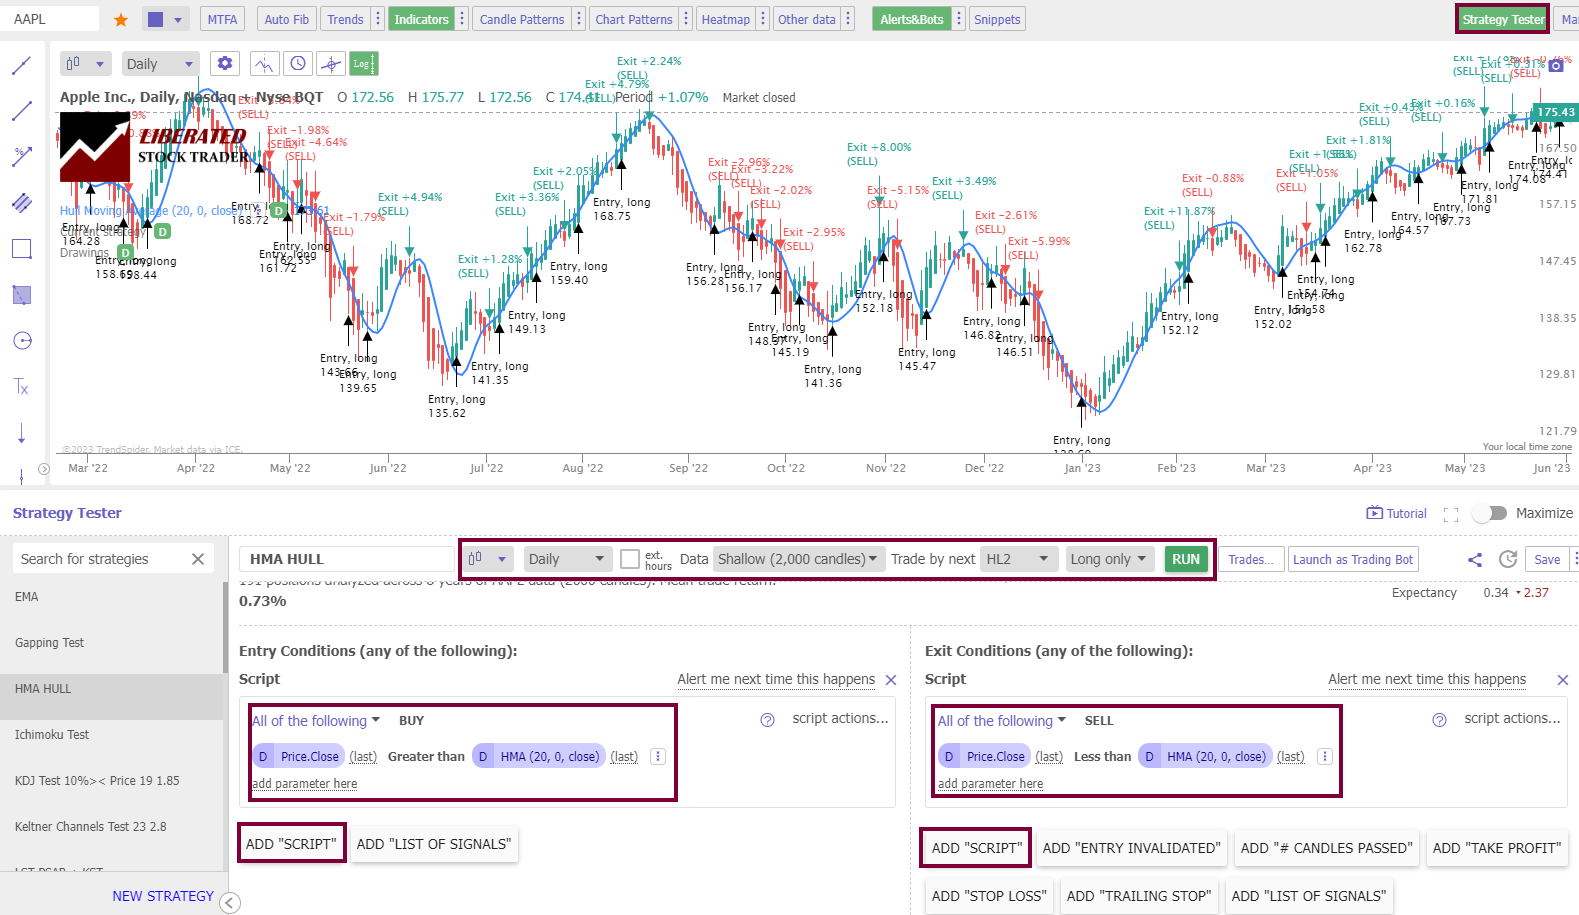
TrendSpider is our recommended backtesting tool. It offers an advanced strategy tester and backtest engine. Its simple point-and-click features make it easy for users to construct complex strategies without coding knowledge. It also has a wide range of pre-built technical indicators and powerful visualizations for analyzing the backtested results.
Get Code Free TrendSpider Backtesting
How to Set Up Moving Average Backtesting
To set up backtesting, I used TrendSpider, our recommended trading software for serious traders. The screenshot below shows the exact configuration for our SMA backtesting. To set up backtesting in TrendSpider, follow these simple steps:
- Register for TrendSpider
- Select Strategy Tester > Entry Condition > Add Script > Add Parameter > Condition > Price > Greater Than > Moving Average.
- For the Sell Criteria, select > Add Script > Add Parameter > Condition > Price > Less Than > Moving Average.
- Finally, click “RUN.”
Backtesting with TradingView
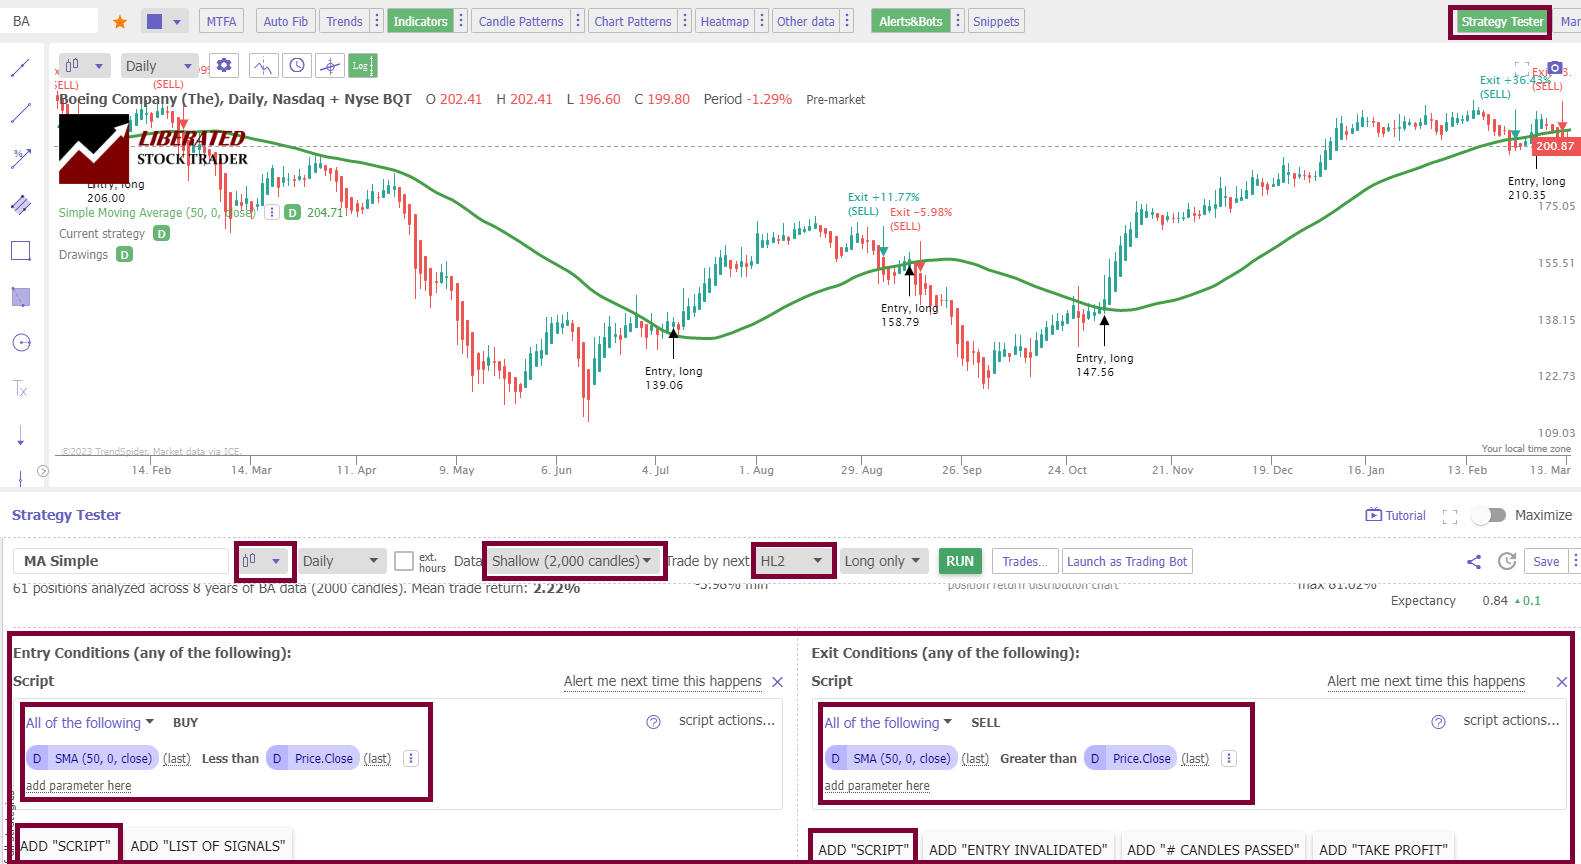
TradingView is a trading analysis platform that provides users with powerful charting tools, data analytics, and algorithmic backtesting. The platform has hundreds of indicators and drawing tools that allow traders to design automated strategies. These strategies can then be tested using historical data over predetermined time frames. To develop original strategies, you will need to learn Pine coding.
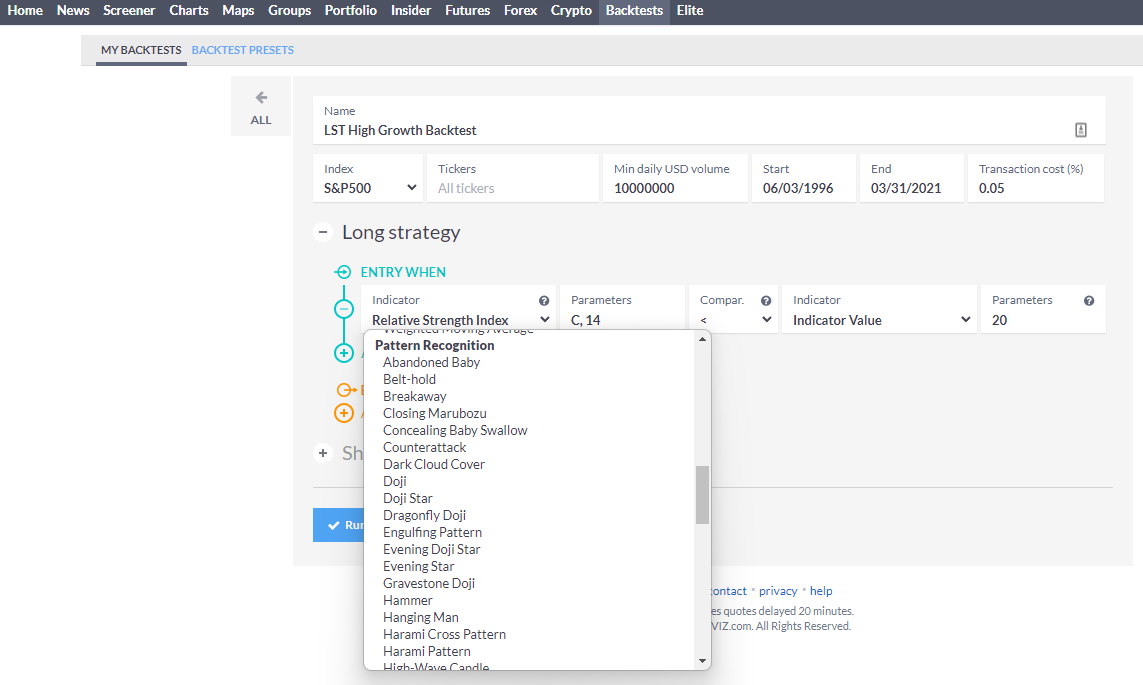
Backtesting with Finviz
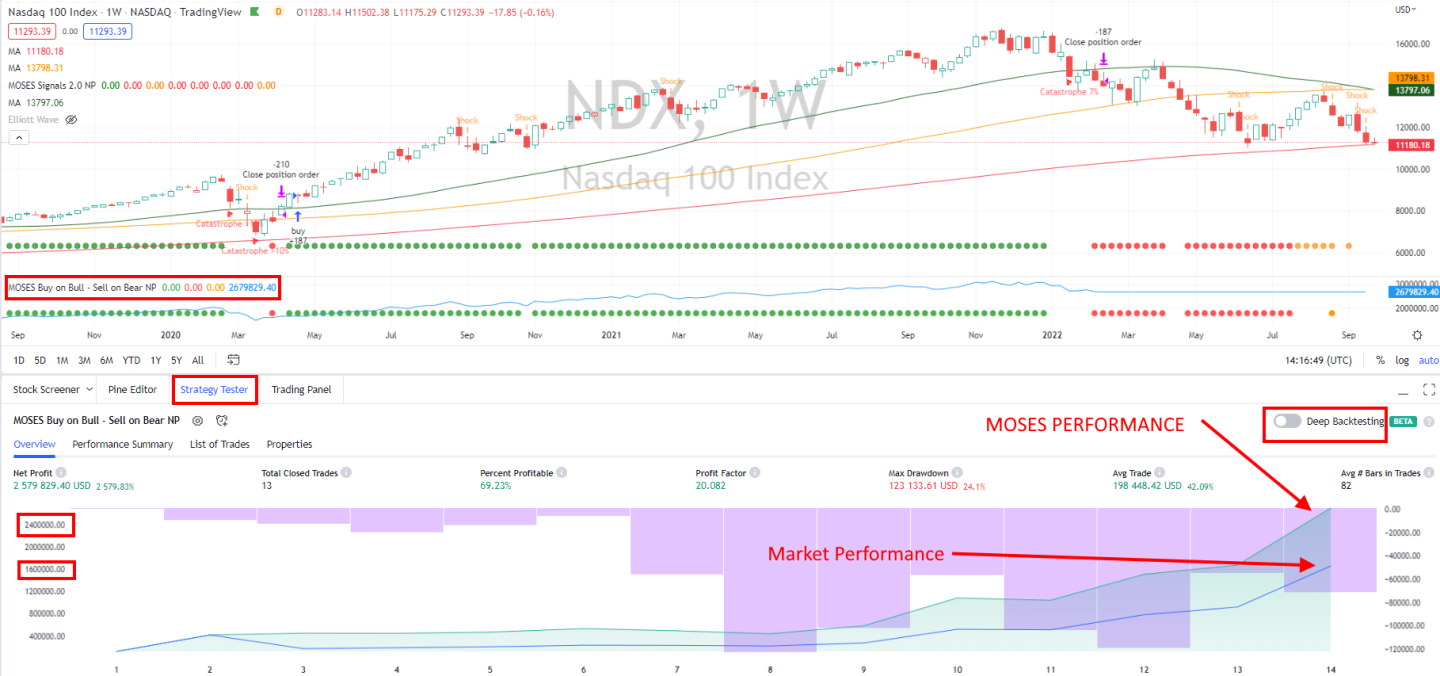
Finviz is a cloud-based stock screening and analysis tool that allows users to test various strategies quickly. It includes a backtesting feature with data going back up to 15 years, allowing traders to analyze different stocks and compare their performance against different time frames or market conditions. Finviz also provides comprehensive charting tools for further exploring analyzed stocks.
7. Run a paper trading simulation
Simulations serve as the cornerstone of any backtesting procedure. Traders or analysts deploy historical data to test how a particular strategy would have fared. This requires them to construct a virtual trading environment where historical prices trigger buy or sell signals as in real-time trading. Critical parameters are set, including initial capital, transaction costs, and entry and exit timing.
- Initial Capital: The amount allocated at the onset of the simulated trading period.
- Transaction Costs: These are often incorporated to reflect realistic trading conditions.
- Entry/Exit Timing: Precise rules determining when positions are entered and exited.
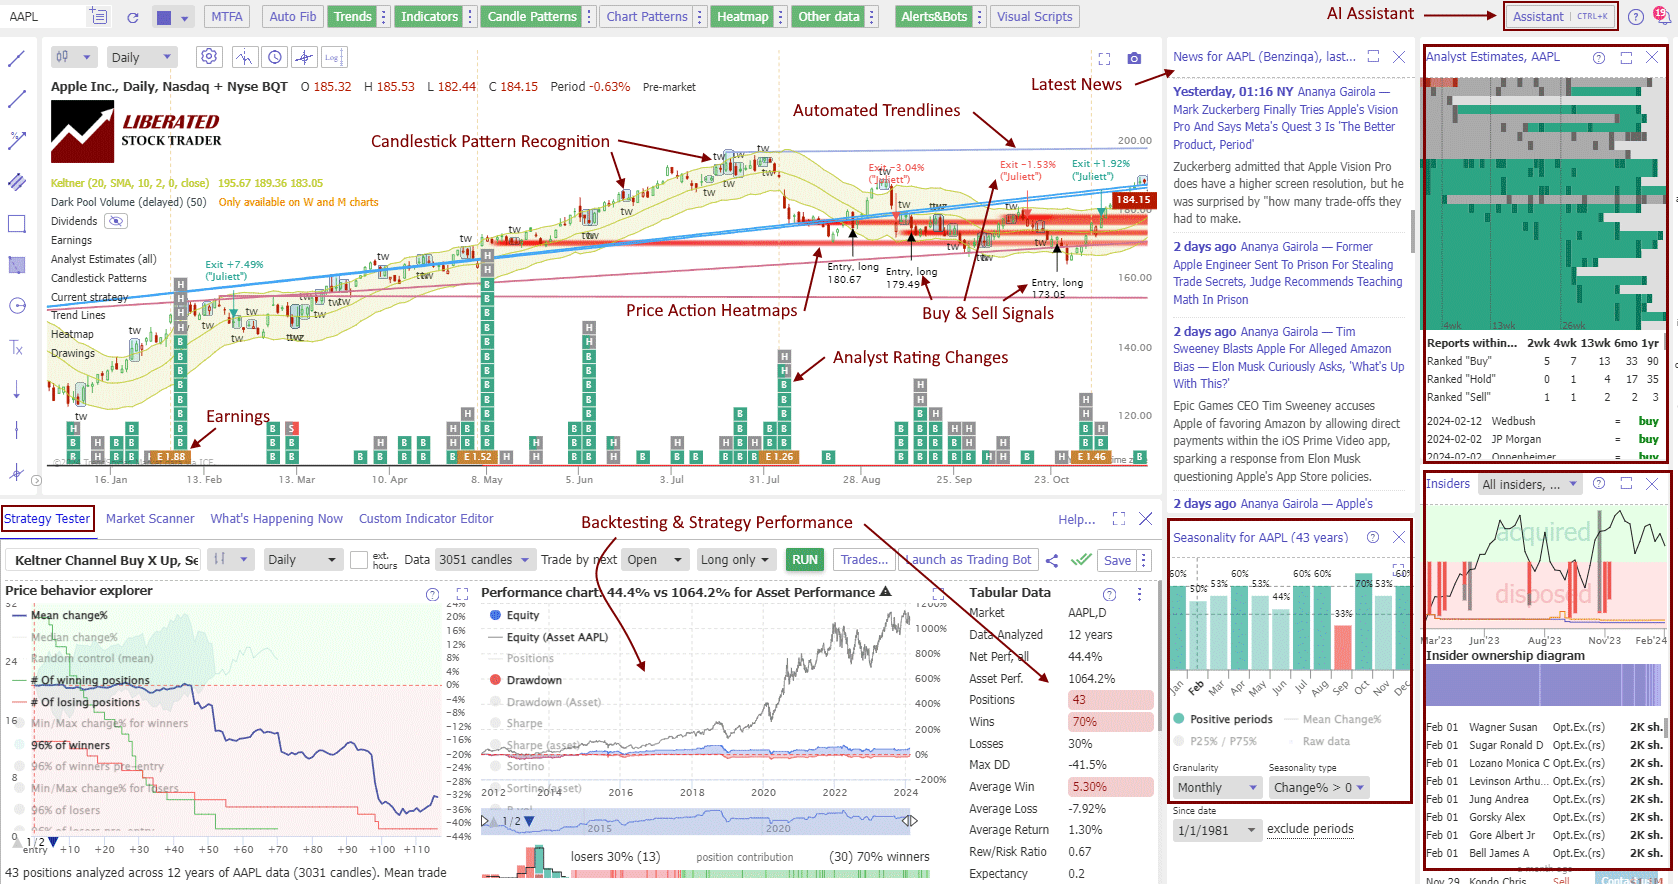
Analyzing Profit/Loss Scenarios
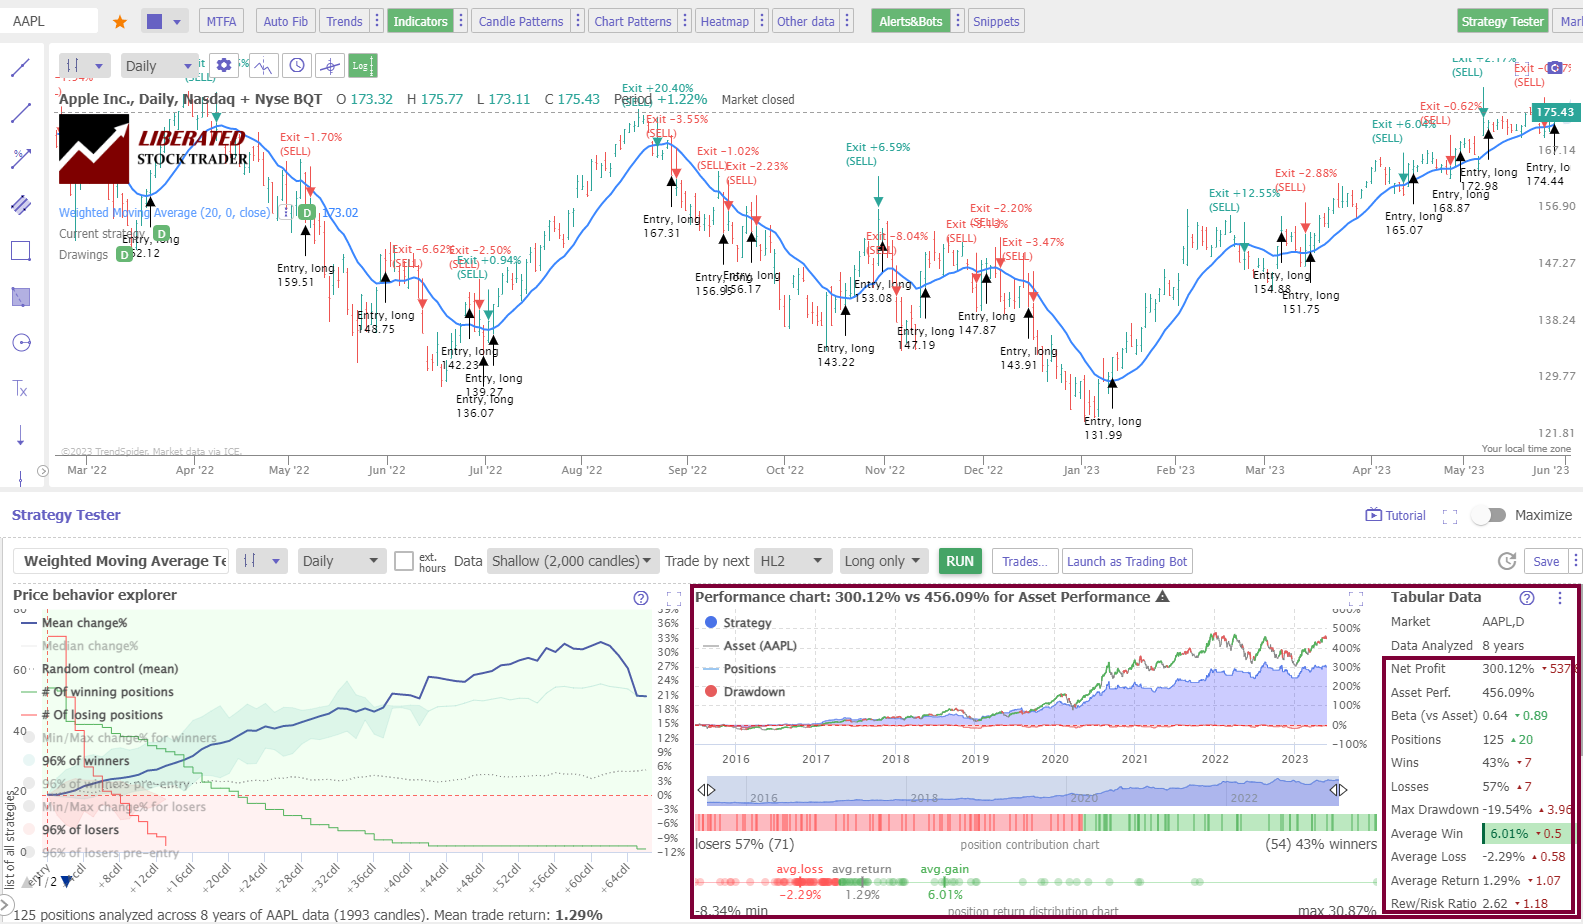
Once the simulation is complete, profit/loss outcomes analysis is fundamental. This step assesses the strategy’s potential financial performance by calculating net profits, the ratio of winning to losing trades, and the potential drawdowns—peaks to troughs in investment value—during the trading period.
- Net Profit: Total gains minus total losses and expenses.
- Win/Loss Ratio: The frequency of profitable trades relative to unprofitable ones.
- Drawdown: The measure of decline from a historical peak in the capital of the investment strategy.
Try the Best AI-Powered Backtesting with TrendSpider
Designing Trading Rules
The cornerstone of an algorithmic trading strategy lies in its trading rules. These are specific criteria and parameters that dictate entry and exit points for trades.
For example, a simple rule could trigger a buy order when a stock’s 50-day moving average crosses above its 200-day moving average. Rules must be based on robust market analysis and trading theories to enhance the potential for success. Make sure to test your strategy in bull and bear markets over multiple years.
8. Implement the system
Implementing your algo system to begin auto-trading is a big step. Your chosen software will need to integrate auto-trading or provide a webhook interface to your broker of choice. Of the software we recommend, only three can enable auto-trading.
| Algo Trading Software | TrendSpider | TradeIdeas | TradingView |
| Awards |  |
||
| Algo Software Rating |
4.8 | 4.7 | 4.6 |
| Trading Signals |
✅ | ✅ | ✅ |
| Alerts |
✅ | ✅ | ✅ |
| Algo Pattern Recognition |
✅ | ✅ | ✅ |
| Structured Algo Strategies |
✅ | ✅ | ✅ |
| Backtesting |
✅ | ✅ | ✅ |
| Point & Click Backtesting |
✅ | ❌ | ❌ |
| Automated Trading Bots |
✅ | ✅ | ✅ |
| 1-on-1 Training |
✅ | ❌ | ❌ |
WebHook Bot Integration
Enabling AI Bot integration on TradingView or TrendSpider is easy: Right-click a chart, Select “Add Alert,” Click “Notifications,” and add a Webhook URL. (See my screenshot image below.)
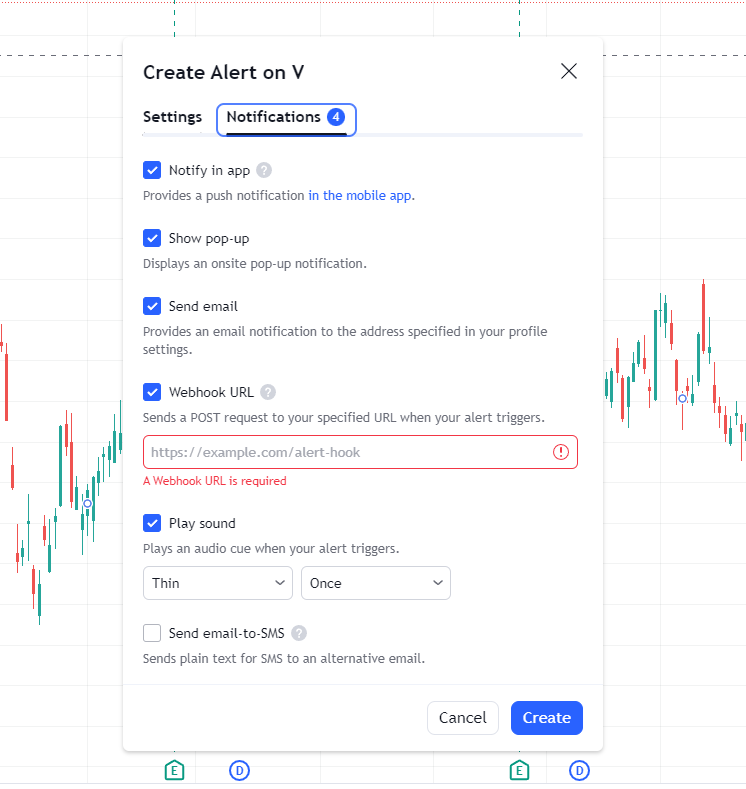
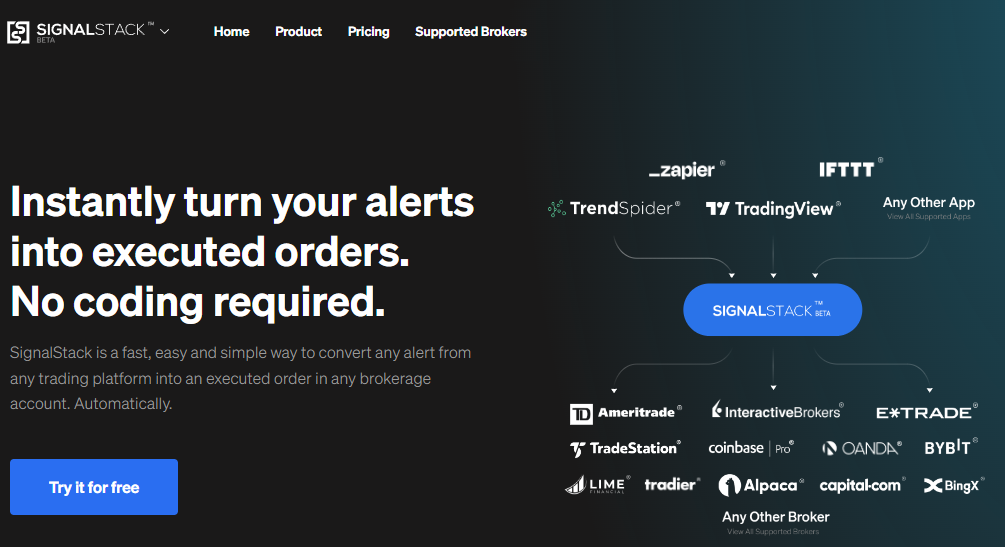
Additionally, SignalStack is an AI webhook-based automation tool that creates bots by connecting charting software like TradingView and TrendSpider to brokers like TradeStation and Interactive Brokers. These bots enable traders to automate and react quickly and accurately to market conditions without manually monitoring the markets all day.
Get 25 Signals Free With SignalStack
Risks of Algorithmic Trading
Algorithmic trading, while capable of generating profits and enhancing market efficiency, carries significant risks. Market participants must understand potential adverse outcomes, such as substantial market impact and overfitting, alongside susceptibilities linked to flash crashes and a heavy reliance on technological systems.
Market Impact and Overfitting
Market Impact: Large orders executed via algorithms may seriously influence market prices. If strategies become predictable, other market participants could exploit these expectations, leading to potential losses.
Overfitting: When an algorithm is too finely tuned to historical data, it may fail to adapt to current market conditions. Traders may experience losses if the algorithm cannot effectively generalize to unseen data.
Flash Crashes and Technology Dependency
Flash Crashes: Automated trading has been associated with sudden and severe market downturns, such as flash crashes, where prices plummet and recover quickly. This volatility can cause widespread market disruption, eroding investor confidence and leading to significant financial fallout.
Technology Dependency: Algorithmic trading hinges on complex infrastructure. A technological failure, like a software bug or hardware malfunction, could derail the entire trading strategy, potentially resulting in considerable financial losses and compliance issues.
Key Considerations for Successful Algorithmic Trading
To excel in algorithmic trading, one must meticulously manage risk, optimize infrastructure, ensure low latency, and adopt advanced techniques such as machine learning and AI. These core areas are critical in designing systems that can execute trades efficiently and effectively.
Risk Management
In algorithmic trading, risk management is paramount to preserving capital and maintaining steady performance. It involves setting predefined limits on investment size, capital deployment, and potential losses. Traders should establish a stop-loss strategy to cap losses on individual trades. Diversification across different asset classes can reduce the risk of significant drawdowns.
Infrastructure and Latency
The foundation of successful algorithmic trading is robust infrastructure that supports rapid execution and minimizes latency. Latency is the delay between order initiation and execution, and even milliseconds can make a difference. Traders should employ high-speed internet connections and colocate servers near exchange facilities to improve response times.
Machine Learning and AI
Machine learning and AI are transforming algorithmic trading by enabling more sophisticated analysis and decision-making. They use historical data to predict market movements and generate trade signals.
Utilizing these technologies can enhance the capability to identify profitable opportunities and improve order execution strategies. However, it’s vital to continuously monitor and tweak these algorithms to adapt to market changes.
FAQ
What are the core components of an algo trading system?
An algorithmic trading system is built upon a foundation of data analysis using charts, price, volume, indicators, patterns, backtesting, and risk management. It requires historical market data for backtesting, real-time market data for trading, and a trade execution engine.
How can one develop a profitable algorithmic trading strategy?
Developing a profitable algorithmic trading strategy involves thorough market research, backtesting strategies against historical data, optimizing algorithms, and adhering to rigorous risk management practices to maintain profitability.
What are some examples of algorithmic trading strategies?
Common examples include momentum strategies, statistical arbitrage, market making, and mean reversion. Each strategy utilizes mathematical models to identify trading opportunities based on market conditions.
How can beginners start with algorithmic trading?
Beginners can start algorithmic trading by learning technical analysis and practicing strategy development on a trading simulator or paper trading platform like TrendSpider or TradingView before executing real trades.
Can individual investors implement algorithmic trading?
Yes, individual investors can implement algorithmic trading. They can do this by leveraging trading platforms and software that support automated trading. They must also develop or procure a robust trading strategy.

