Trading seasonal trends can be a powerful strategy for those looking to maximize their investments in financial markets.
By understanding the natural rhythms of the markets, traders can capitalize on predictable patterns that occur at certain times of the year.
Seasonal trends refer to certain sectors, like retail, which often perform better during holiday seasons, while agricultural products might see spikes during harvest times.
One key benefit of trading seasonal trends is the ability to anticipate market movements based on historical data. Through careful analysis, traders can identify patterns that repeat annually. For example, many investors prepare for increased retail sales during the fourth quarter due to holiday shopping, which often leads to stock price increases for companies in that sector.
Key Takeaways
- Understanding market cycles can help improve investing strategies.
- Historical data can reveal predictable annual patterns in financial markets.
- Seasonal trends offer a roadmap for timing investments effectively.
- Seasonal charts help identify these trends accurately.
Understanding Seasonal Trends in Trading
Seasonal trends play a key role in trading by highlighting patterns that emerge at specific times during the year. These trends, driven by historical data, supply and demand, and market behavior, can help traders make informed decisions across various assets like stocks and commodities.
📈 Chart: S&P 500 Seasonal Trends
Check out the live chart below displaying 32 years of seasonality data for the S&P 500. The bars represent the percentage of months in the 32 years where the index closed higher than its opening. For instance, did you know that over the past 32 years, November saw gains in the S&P 500 Index 77% of the time? Fascinating stuff!
📈 S&P500 (SPY) Monthly Seasonality Chart Analysis
Based on 32 years of data, November emerges as the prime time to invest in stocks. With a positive rate of 77% and an average S&P500 growth of 2.4%, this month shines bright. Surprisingly, almost 30% of the yearly gains are captured in this single month!
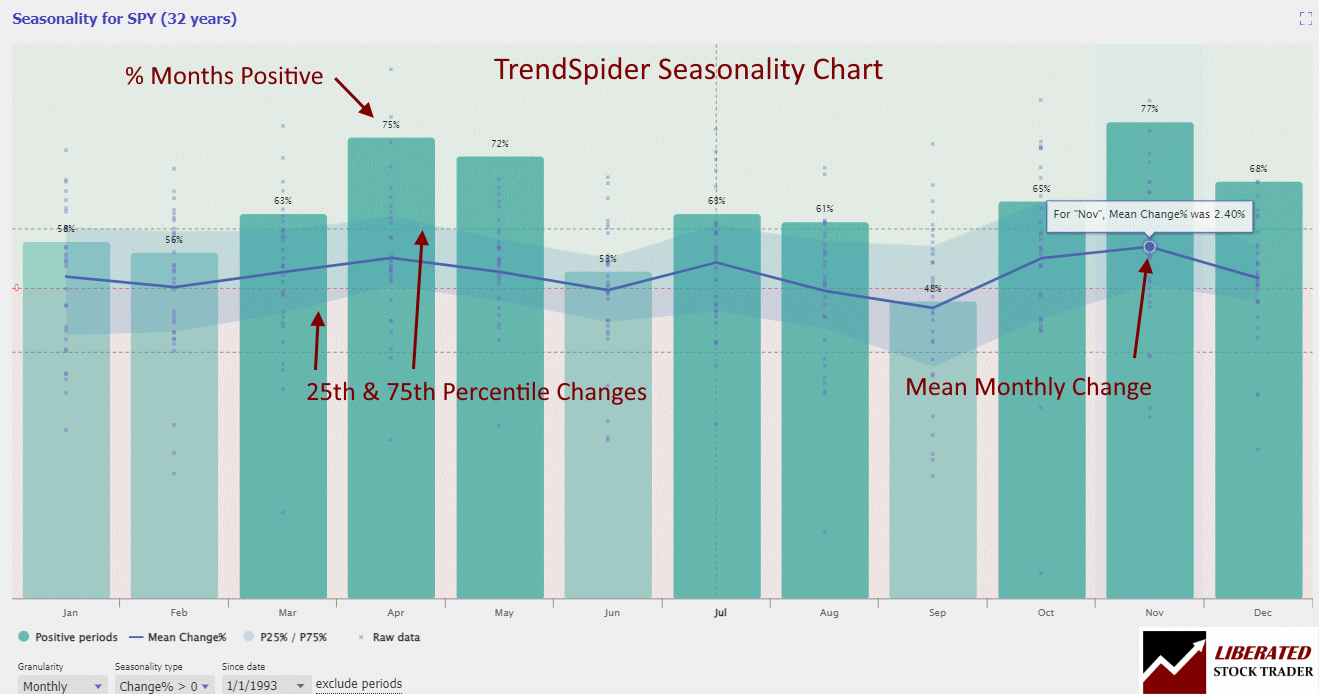
Get Powerful Seasonality Charting with TrendSpider
The TrendSpider chart above shows the percentage of positive months, the mean gain per month, and the distribution of percentage gains. It is a powerful way to analyze seasonality.
Defining Seasonality and Its Impact on Markets
Seasonality refers to the predictable changes that occur in markets due to regular influences like holidays, weather, and business cycles. These changes can affect trading volumes and prices, making some periods more favorable for trades. For instance, retail stocks often experience higher prices during the holiday season due to increased consumer spending. Conversely, agricultural commodities might show seasonal patterns based on planting and harvest cycles.
Historical Data and Seasonal Patterns
Historical data is crucial for identifying seasonal patterns in trading. By examining how prices and trading volumes have changed over the years, traders can spot trends and predict future movements. For example, studying past data on the S&P 500 might reveal that certain months of the year consistently show higher returns. This information helps traders build strategies that align with seasonal trends.
The Roles of Supply and Demand
Supply and demand are fundamental in shaping seasonal trends. When demand increases during a specific time of year, prices typically rise. For example, demand for oil often spikes in the summer due to increased travel, which can lead to higher prices. On the other hand, the supply of agricultural products like wheat can fluctuate with the seasons, affecting their market prices. Understanding these dynamics is essential for trading assets impacted by these seasonal changes.
Analyzing Seasonality in Various Assets
Different assets exhibit unique seasonal patterns. In the stock market, retail stocks may rise during the fourth quarter, while tech stocks could perform better at the start of the year. Commodities like gold and oil also show seasonal trends, such as increased gold demand in the fourth quarter due to holiday purchases. These patterns can also influence ETFs (Exchange-Traded Funds) that track these commodities or sectors. A trader must analyze each asset class carefully to leverage these seasonal trends effectively.
My thorough testing awarded TradingView a stellar 4.8 stars!
With powerful stock chart analysis, pattern recognition, screening, backtesting, and a 20+ million user community, it’s a game-changer for traders.

Whether you're trading in the US or internationally, TradingView is my top pick for its unmatched features and ease of use.
Explore TradingView – Your Gateway to Smarter Trading!
Strategic Trading Approaches for Seasonal Trends
Trading seasonal trends involves leveraging predictable patterns to optimize trading strategies. This section will detail calendar-based strategies, technical and fundamental analysis, and essential risk management techniques.
Calendar-Based Trading Strategies
Calendar-based strategies capitalize on predictable seasonal patterns. Traders use historical data to identify recurring trends, such as year-end rallies or summer slowdowns. For instance, the “January Effect” suggests that stock prices often rise in the first month of the year.
These methods often rely on historical backtesting to validate patterns. By analyzing past performance, traders can refine their entry and exit points. Implementing calendar-based strategies requires consistency and discipline, as deviating from the established pattern can lead to suboptimal results.
Technical Analysis and Seasonal Trading
Technical analysis involves using price charts and indicators to identify trends. In seasonal trading, this method helps pinpoint favorable times to buy or sell assets. Key tools include moving averages, Relative Strength Index (RSI), and MACD.
Indicators can confirm seasonal patterns, providing added confidence in trades. For example, a trader might look for a moving average crossover that aligns with an anticipated seasonal trend. It helps to combine technical analysis with seasonal data to enhance accuracy in predicting price movements.
Fundamental Analysis in Seasonal Trading
Fundamental analysis evaluates an asset’s intrinsic value based on economic data, industry trends, and company performance. In seasonal trading, this approach helps understand the broader context behind seasonal trends.
For instance, retail stocks might perform better during the holiday season due to higher consumer spending. Analyzing earnings reports, industry news, and economic indicators can provide insights into why certain patterns repeat annually. This deeper understanding aids in making more informed trading decisions.
TradingView Seasonality Charts
TradingView is also an excellent option for accessing seasonality charts. This popular charting platform offers a wide range of technical analysis tools, including the ability to view seasonal trends for various assets.
To access seasonality charts on TradingView, users can select the “Seasonality” option under the “Indicators” tab. From there, they can choose from a variety of markets and time frames to view seasonal patterns.
Additionally, TradingView has a “Compare” feature that allows investors to compare multiple assets and their seasonal trends side by side. This is especially useful for those looking to diversify their portfolio or track correlations between different markets.
Try TradingView Seasonality Charts for Free
Notable Seasonal Trading Patterns and Effects
Seasonal trends in the stock market offer investors chances to optimize their strategies. This section explores three significant patterns: the January Effect, the “Sell in May and Go Away” strategy, and the Santa Claus Rally.
January Effect and How to Leverage It
The January Effect refers to the trend where stock prices typically rise in January. This pattern is believed to occur because investors sell off underperforming stocks in December for tax purposes and buy them back in January, causing prices to increase.
Investors can leverage this by purchasing stocks in late December and selling them in late January. Small-cap stocks tend to benefit the most during this period. Keeping an eye on market trends and tax-related moves can further enhance this strategy. Explore this research to learn more about this effect.
Sell in May and Go Away Strategy
The “Sell in May and Go Away” strategy suggests that stocks perform better from November to April than from May to October. Historical data supports this seasonal trend, often attributed to lower trading volumes and investor vacations during the summer months.
Traders who follow this rule sell their holdings at the beginning of May and reinvest at the start of November. This approach can reduce exposure to market volatility. However, exceptions exist, so it is crucial to stay informed and make decisions based on current market conditions.
The Santa Claus Rally and End-of-Year Trading
The Santa Claus Rally occurs in the last week of December and the first two trading days of January. This pattern sees stock prices rise, likely due to holiday optimism, year-end bonuses being invested, and portfolio adjustments by fund managers.
To capitalize on this rally, investors can buy stocks just before Christmas and sell them early in the new year. While this trend is statistically significant, it doesn’t happen every year. Monitoring market sentiment and economic conditions can aid in better timing. For more information on this phenomenon, view this article.
Evaluating the Effectiveness of Seasonal Trading
Evaluating the effectiveness of seasonal trading involves analyzing various factors, such as data patterns, traders’ limitations, and the importance of continuous learning from market observations. This allows traders to maximize their profitability and understand the cyclical nature of financial instruments.
Data-Driven Decision-Making in Seasonality
Data-driven decision-making is essential for identifying effective seasonal trading patterns. Historical data on stock performance, commodity prices, or other financial instruments can be analyzed to determine recurring trends. This can involve complex statistical methods or simple moving averages.
Utilizing tools and software that automate data analysis helps traders make informed choices. For instance, traders might use seasonally adjusted data to identify trends that could affect their trading strategies. Additionally, spreadsheets and specialized software can simplify the calculation of these trends.
By relying on data, traders can remove emotions from their decisions, increasing the likelihood of consistent returns. This method also allows them to backtest their strategies to see how they would have performed in the past.
Try TradingView, Our Recommended Tool for International Traders
Global Community, Charts, Screening, Analysis & Broker Integration

Global Financial Analysis for Free on TradingView
Limitations and Considerations for Traders
While seasonal trading can be profitable, it also has its limitations and drawbacks. Market sentiment plays a significant role and can sometimes override historical patterns. For example, economic news or geopolitical events can disrupt expected trends.
Traders must also be aware of the efficiency of their strategies, as not all seasonal patterns guarantee profits. Traders should recognize that past performance is not always indicative of future results. This is where diversification in strategies and financial instruments becomes crucial to mitigate risks.
FAQ
What software do I use to analyze seasonality?
I personally chose TrendSpider as the best software for seasonality charting and analysis. It offers Monthly, daily, weekly, and hourly seasonality charting for stocks, forex, and futures, making it the top choice for traders.
What strategies can be employed to capitalize on stock market seasonality?
Traders often use historical data to identify patterns that repeat in certain months or seasons. One common strategy is the "Halloween Indicator," which suggests buying stocks in late October and selling them in early May. Another approach is sector rotation, where traders move their investments to optimal sectors based on seasonal trends.
Which software tools are recommended for trading seasonality?
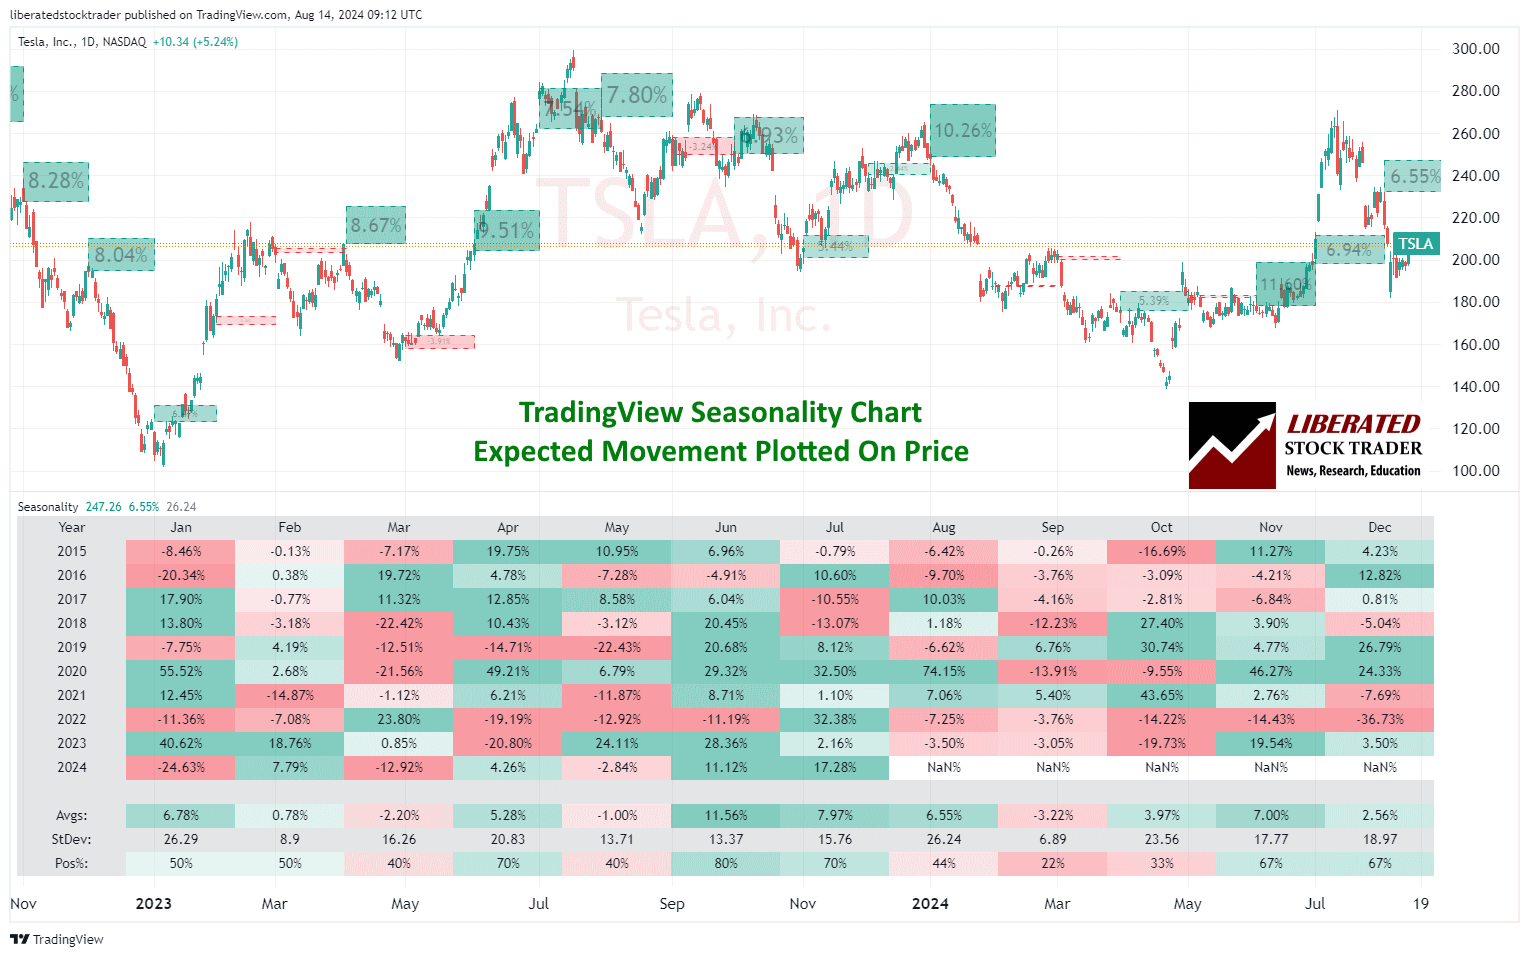
Software like MetaStock and TradingView offer tools to analyze seasonal trends. These platforms provide historical data and advanced charting options that help identify repeating patterns. The seasonality indicator in TradingView plots forecasted moves directly onto the chart.
How does seasonality affect forex trading, and how can traders adjust their strategies?
Seasonality in forex trading often reflects patterns linked to global economic cycles and central bank policies. Traders might see recurring trends in currency pairs during specific times of the year. Incorporating seasonal fluctuations and adjusting strategies based on economic data releases or fiscal quarters can help align their trades with expected movements.
Can you explain the concept of seasonal timing in investment?
Seasonal timing involves making investment decisions based on the time of year or cyclical patterns. For instance, certain stocks might perform better during holiday seasons or fiscal year ends. The idea is to exploit these predictable periods to maximize returns. This can involve entering and exiting positions aligned with these performance cycles.
What are the key patterns to look for in seasonal stock market trends?
Key patterns include the January effect, where stocks often rise after year-end tax-loss selling, and the Santa Claus rally, which describes stock increases in the last week of December. Observing tendencies in different parts of the year can help traders predict and benefit from such patterns.