Investment turnover is a financial metric for investors and analysts seeking to understand how effectively a company uses its capital to generate revenue.
Investment turnover is calculated by comparing a business’s revenue to the sum of its equity and debt, providing insight into the company’s management’s ability to deploy its financial resources.
Knowing a company’s investment turnover can help stakeholders gauge its operational efficiency and potential for growth.

While a higher investment turnover ratio indicates a more efficient use of investment funds to produce revenue, a lower ratio may suggest that the company is not utilizing its investments as effectively.
This measurement is particularly relevant when comparing companies within the same industry, as it sheds light on how well each business is managing its capital in relation to its competitors.
Key Takeaways
- Investment turnover indicates how well a company generates revenue from its invested capital.
- A higher turnover ratio reflects better capital efficiency and potential for growth.
- Comparing turnover ratios can offer competitive insights within an industry.
Understanding Investment Turnover
Investment turnover is a critical measure that reflects the efficiency of asset utilization and portfolio management. This metric is essential for investors to assess their investments’ performance.
Concept of Turnover in Investments
Investment turnover refers to the frequency at which assets, such as inventory or securities within a portfolio, are bought and sold over a period. High turnover indicates active trading, while low turnover indicates a more static investment strategy.
This concept can be applied broadly, from analyzing the efficiency of a company’s use of its assets to evaluating a mutual fund manager’s strategy in buying and selling investments. It measures how effectively the entity generates sales or revenue from its assets.

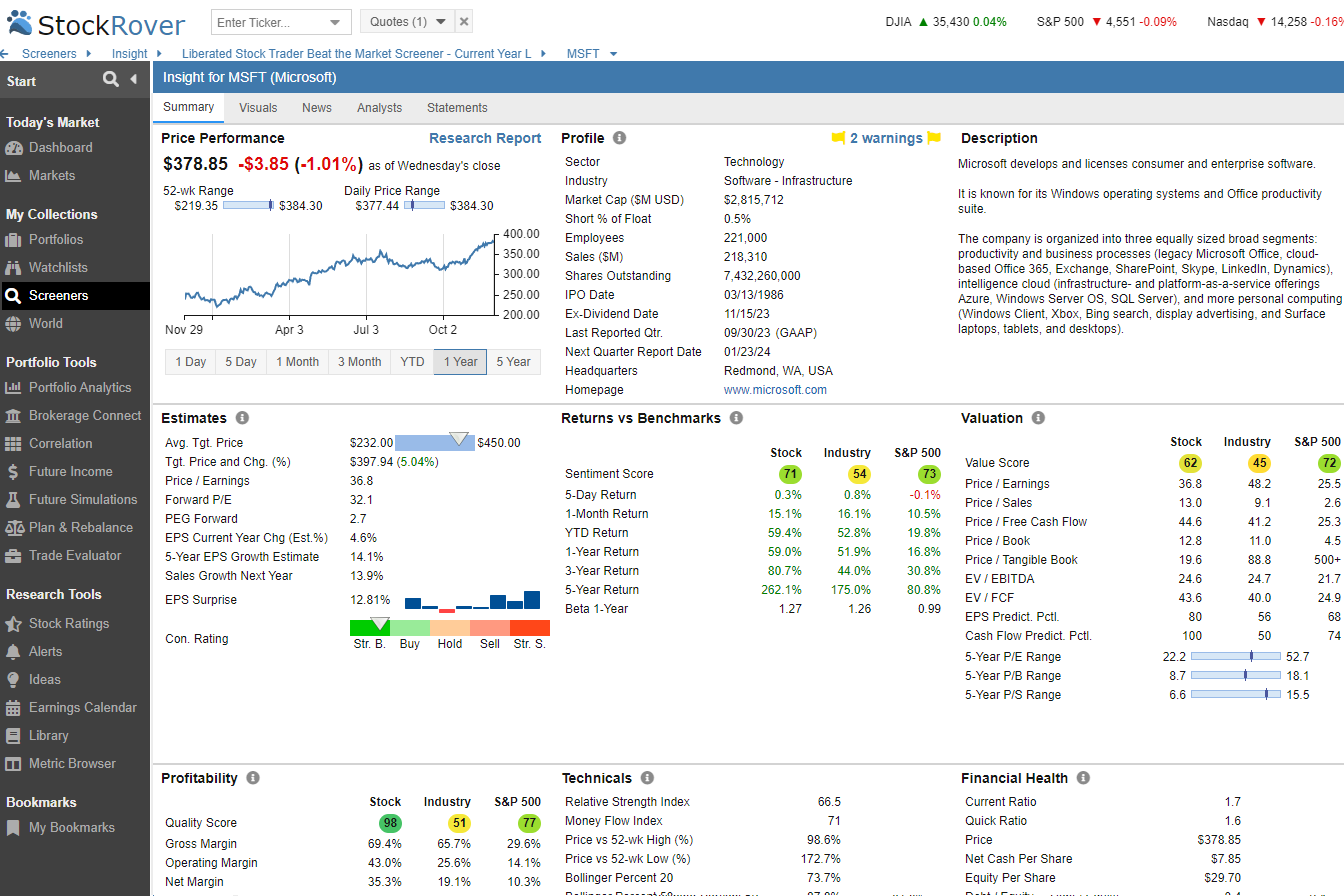
Try Powerful Financial Analysis & Research with Stock Rover
Calculating Turnover Ratio
The investment turnover ratio provides a clear formula to quantify the turnover of investments. It is an important indicator of how well a company uses its assets to produce sales. The ratio is typically calculated using the following formula:
Investment Turnover Ratio = Sales Revenue / Average Total Assets
Here’s a streamlined approach to performing the calculation:
- Identify Total Sales: Start with the total sales or revenue figures.
- Determine Average Assets: Calculate the average total assets for the period by adding the assets at the beginning and end of the period and then dividing by two.
- Apply the Formula: Divide the sales revenue by the average total assets to determine the ratio.
For example, if a company has annual sales of $100,000 and average assets of $50,000, its asset turnover ratio would be 2. This implies that for every dollar of assets owned by the company, it generated two dollars of sales within the year.
In portfolio management, the turnover ratio is often used to assess the trading activity of investments like mutual funds or ETFs. A portfolio’s turnover ratio is the percentage of holdings traded in a given timeframe, which can affect transaction costs and tax efficiency.
Investment Turnover and Business Efficiency
Investment turnover ratios are crucial in assessing a company’s efficiency in using its assets to generate revenues, which ultimately reflects on the profitability of operations.
Interpreting Asset Turnover
Asset turnover reflects how efficiently a business can use its assets to produce revenues. This figure is derived from the financial statement and gives insight into a company’s operational efficiency.
To calculate this ratio, total sales are divided by average assets for a period. Industries with low margins tend to have higher asset turnover, while those with high margins typically show lower turnover. Comparing asset turnover ratios against sector averages provides a relative performance indicator.
- Formula: Asset Turnover Ratio = Total Sales / Average Assets
- High Ratio: Indicates efficiency in asset utilization.
- Low Ratio: Could signal potential inefficiencies.
Inventory Turnover in Business
Inventory turnover measures how often inventory is sold and replaced over a specific period, a direct indicator of inventory management and sales effectiveness. A higher ratio implies strong sales or effective inventory management, whereas a lower ratio may indicate overstocking or deficiencies in the product line or marketing.
Inventory Turnover Ratios by Sector:
- Retail: Tends to have a higher inventory turnover due to fast-moving consumer goods.
- Manufacturing: Varies, but companies aim for higher turnover to reduce holding costs.
- Service: Typically not applicable as services do not hold physical inventory.
This ratio provides specifics on efficiency and sheds light on the alignment between a business’s production, warehousing, and sales operations.
Investing In Stocks Can Be Complicated, Stock Rover Makes It Easy.
Stock Rover is our #1 rated stock investing tool for:
★ Growth Investing - With industry Leading Research Reports ★
★ Value Investing - Find Value Stocks Using Warren Buffett's Strategies ★
★ Income Investing - Harvest Safe Regular Dividends from Stocks ★

"I have been researching and investing in stocks for 20 years! I now manage all my stock investments using Stock Rover." Barry D. Moore - Founder: LiberatedStockTrader.com
Impact of Investment Turnover on Returns
Investment turnover can significantly influence investor’s returns by affecting profit margins and incurring various costs.
Turnover Ratio and Profit Margins
Turnover ratio is a metric that gauges the frequency with which assets within a portfolio are bought and sold. Investors often examine this ratio to understand a fund’s trading activity.
A higher turnover ratio indicates more trading activity, which can lead to higher transaction costs and potentially reduced profit margins. These costs can erode the bottom line, as frequent sales and purchases may generate short-term capital gains, which are taxed at a higher rate than long-term gains.
Costs Associated with High Turnover
High portfolio turnover often results in increased costs for investors. These costs come in the form of transaction costs and fees, both of which can detract from the portfolio’s returns. For example, every sale or purchase incurs brokerage fees, which can accumulate significantly over time.
Additionally, a high turnover can impact market impact costs and opportunity costs, both of which can negatively affect an investor’s equity. Investors need to consider these costs when evaluating the performance of their investments, as they directly impact the revenue generated from their portfolios.
Performance Metrics and Analysis
Metrics such as the turnover rate and fixed asset turnover ratio play a pivotal role in evaluating the efficiency of an investment’s operations. They are essential for comparing performance across different sectors and conducting a deep analysis using financial statements.
Dupont Analysis of Investment Turnover
The Dupont Analysis dissects the components of return on equity (ROE). It helps investors understand how a company utilizes its assets to generate profits.
A key element of the Dupont Analysis is the investment turnover, which can be further broken down into the ratio of sales to assets. This reveals how effectively the company converts its investment into sales.
A higher investment turnover rate typically suggests better performance, indicating that the company is generating more revenue per dollar of assets. Financial statements are the source of the raw data needed to calculate these ratios and to provide insight into operational efficiency.
Comparative Sector Analysis
When analyzing investment turnover, one must consider the sector in which the company operates. A Comparative Sector Analysis allows investors to set a relevant benchmark for performance metrics.
It’s important to note that turnover rates vary between sectors due to differences in capital intensity and market dynamics. For example, the fixed asset turnover ratio, which indicates how well a company uses its fixed assets to generate sales, might be higher in a service sector than in a capital-intensive sector like manufacturing.
By contextualizing financial results through a sector comparison, investors can gauge whether a company is outperforming its sector peers or has room for improvement in its operational strategies.
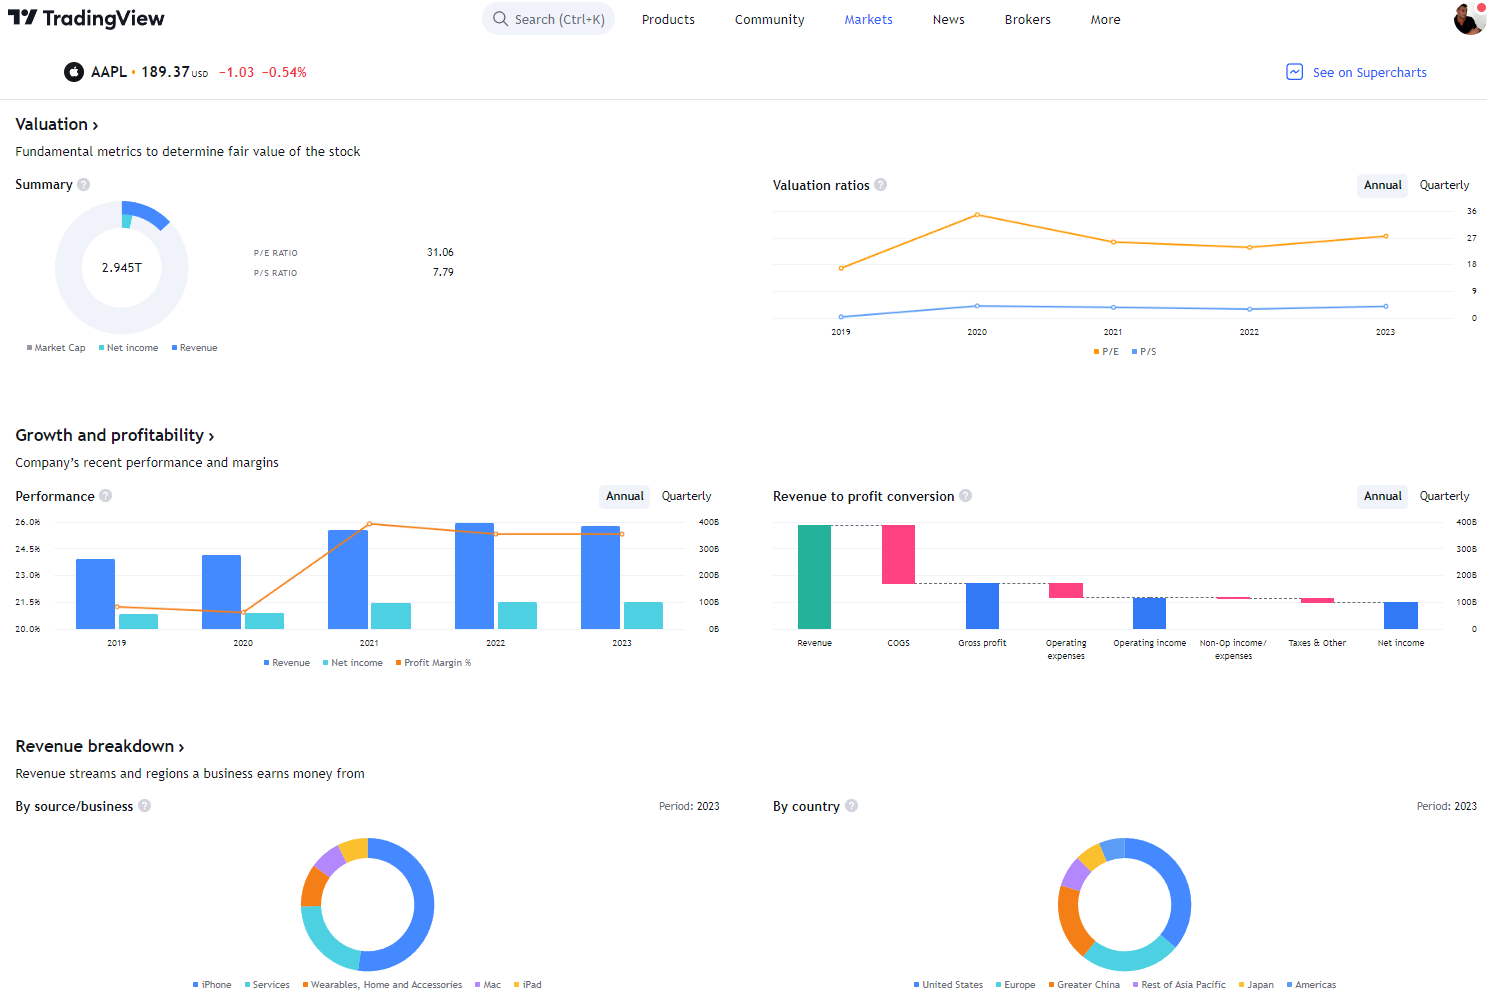
Try TradingView, Our Recommended Tool for International Traders
Global Community, Charts, Screening, Analysis & Broker Integration

Global Financial Analysis for Free on TradingView
Strategizing Investment Turnover
Investment turnover should be approached with a clear strategy to ensure portfolio efficiency and alignment with investment goals. Effective turnover management can balance the cost of transactions against the potential for improved performance.
Optimizing Portfolio Turnover
Optimizing portfolio turnover focuses on achieving the ideal balance between buying and selling within a portfolio to enhance returns without incurring excessive transaction costs. A portfolio manager may adjust turnover based on numerous factors, including research on market conditions and shifts in related sectors.
A low portfolio turnover ratio often reflects a buy-and-hold strategy. This suggests that investments are retained for long periods to allow for natural growth, typically associated with mutually managed funds.
Conversely, a high turnover implies frequent transactions and could indicate an actively managed approach, aiming to capitalize on short-term price movements and sector opportunities.
- Portfolio Turnover Strategies:
- Buy-and-Hold: Minimizes turnover and transaction costs.
- Active Management: Increases turnover to potentially harness market volatility.
Investment Strategies and Turnover
The relationship between investment strategy and turnover is significant; each strategy has its intrinsic turnover tendencies.
For instance, an actively managed fund often experiences higher turnover rates due to the frequent transactions made in pursuit of superior returns. Investment strategies prioritize various objectives, and turnover is an operational measure reflecting a strategy’s trading activity level.
My thorough testing awarded TradingView a stellar 4.8 stars!
With powerful stock chart analysis, pattern recognition, screening, backtesting, and a 20+ million user community, it’s a game-changer for traders.

Whether you're trading in the US or internationally, TradingView is my top pick for its unmatched features and ease of use.
Explore TradingView – Your Gateway to Smarter Trading!
The investment turnover ratio is a critical metric for assessing how much of a fund’s holdings are traded over a period. It informs investors of the portfolio manager’s trading style and the resultant costs involved.
- Key Metrics:
- Investment Turnover Ratio: Helps measure trading activity.
- Transaction Costs: A vital consideration in strategy effectiveness.
Matching the investment strategy with the investor’s goals and market expectations is essential when strategizing investment turnover. Whether the focus is on the long-term stability of a buy-and-hold strategy or the dynamic trading of an actively managed fund, understanding and effectively managing turnover is paramount for investment success.
FAQ
This section addresses key aspects of investment turnover and its impact on financial analysis through common queries.
How do you differentiate between investment turnover and asset turnover?
Investment turnover pertains to the rate at which investments are bought and sold within a portfolio, whereas asset turnover relates to how efficiently a company uses its assets to generate sales.
Why is turnover distinct from profit in financial analysis?
Turnover measures the volume of trading activity or sales, while profit is the financial gain after deducting expenses. Turnover focuses on operational efficiency, not just the end financial gain.
How is turnover calculated in business operations?
In business operations, turnover is calculated by dividing total sales by average inventory to reflect the number of times inventory is sold or replaced over a period.
What factors contribute to a high or low investment fund turnover?
A high or low investment fund turnover can result from factors like a fund's investment strategy, market volatility, and the portfolio manager's trading decisions. A high turnover often implies active management, where securities are frequently traded.
How does investment turnover correlate with profit margin?
Investment turnover can indicate the efficiency of investment management but does not directly correlate with profit margin. Profit margin considers the costs involved in generating revenues, beyond just the trade volume.
What indicators signify a favorable turnover ratio within an investment portfolio?
A favorable turnover ratio suggests a balance between active management and trading costs; an optimal level may range from moderate to low turnover, indicating efficient portfolio management without excessive trading costs.
