Trading based on market sentiment involves understanding the emotions and opinions of market participants and using that information to make better trading decisions.
By analyzing factors such as news reports, economic news, investor behavior, and overall market movements, traders can attempt to predict price movements and trends more accurately.
Successful traders use market sentiment to gain a competitive edge and improve their chances of making profitable trades.
To start, traders need to be familiar with VIX volatility, the NYSE advance/decline ratio, the AAII sentiment indicator, and the Federal Reserve Bank financial stress index. Learning to read these indicators correctly can help traders identify bullish or bearish trends and act accordingly.
Key Takeaways
- Trading based on market sentiment involves analyzing market emotions.
- Technical analysis is core to sentiment analysis.
- The VIX volatility index is a widely used gauge of market sentiment that measures the expected volatility over the next 30 days.
- The NYSE advance/decline ratio compares the number of advancing stocks to declining stocks and can indicate whether overall market sentiment is bullish or bearish.
- The AAII sentiment indicator surveys individual investors to determine their level of bullish or bearish sentiment towards the market.
- The Federal Reserve Bank’s financial stress index tracks indicators such as credit spreads and stock prices to measure market financial stress.
Understanding Market Sentiment
Market sentiment refers to the general attitude or feeling that traders and investors have about the market or specific securities. It encompasses emotions like fear and greed, impacting trading decisions and strategies.
Defining Market Sentiment
Market sentiment is the collective mood of investors and traders in the financial markets. It is influenced by various factors, including economic news, geopolitical events, and market trends. Fundamental analysis and technical analysis are used to gauge this sentiment. Fundamental analysis looks at the financial health of assets, while technical analysis examines prices and supply and demand.
Traders use market sentiment to predict future price movements. Positive sentiment often leads to buying, driving prices up, while negative sentiment can result in selling and lower prices. Understanding market sentiment helps investors make educated decisions about entering or exiting positions.
The Psychology Behind Sentiment
Emotions play a crucial role in market sentiment. Fear and greed are the primary emotions affecting investor behavior. When prices rise, greed can drive traders to buy more, fearing they might miss out on profits. Conversely, during market declines, fear can lead to panic selling.
This emotional cycle creates a feedback loop, where rising prices prompt more buying, and falling prices trigger more selling. Traders need to recognize these emotional patterns to manage their reactions and understand others’ actions.
Investor behavior models, such as the Behavioral Finance Theory, explain how biases and irrationality can influence market movements. By being aware of these psychological factors, traders can better predict market sentiment shifts.
Sentiment Indicators Overview
Sentiment indicators are tools used to measure market mood. They can be divided into two categories: qualitative and quantitative. Qualitative indicators include news sentiment and investor surveys. Quantitative indicators include metrics like the Volatility Index (VIX) and the Put/Call Ratio.
The Volatility Index (VIX) is known as the “fear gauge” and measures market volatility expectations. A high VIX indicates high fear levels among investors. The Put/Call Ratio compares the trading volume of put options to call options, giving insight into whether traders are more bearish or bullish.
By using these indicators, traders can gain a clearer picture of the market’s emotional state, aiding in developing sentiment trading strategies. This enables them to make more informed trading decisions based on the prevailing sentiment.
Measuring Market Sentiment
To effectively trade using market sentiment, it’s crucial to measure it accurately. This involves utilizing both traditional and modern tools that can provide insights into the mood of the market.
Traditional Sentiment Indicators
Traditional sentiment indicators are tools that traders have used for years to gauge market psychology. Commonly used indicators include the CBOE Volatility Index (VIX), often referred to as the “fear index,” which measures expected market volatility. The put/call ratio indicates bearish vs. bullish options activity.
The Bullish Percent Index (BPI) measures the percentage of stocks in bullish patterns. It is often used as a contrarian indicator. The Advance/Decline Line counts the number of advancing versus declining stocks, providing insight into market breadth. The Commitment of Traders (COT) report by the CFTC shows the positions of various trading groups in future markets, which is helpful in understanding market sentiment.
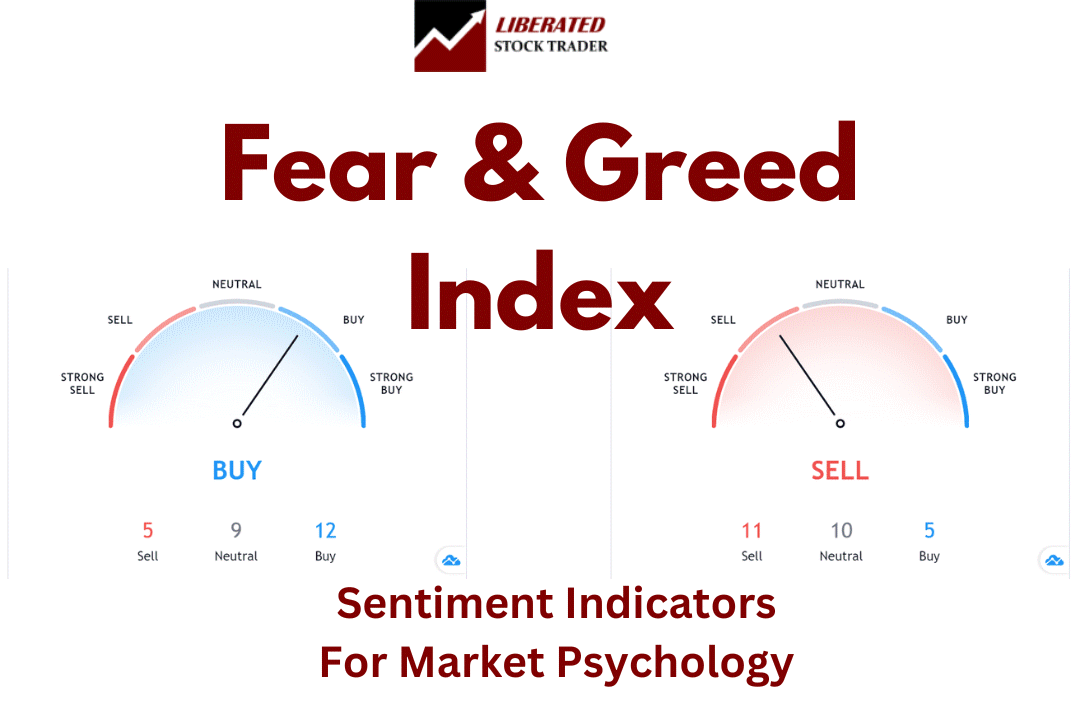
📈 Technical Sentiment Indicators
TradingView powers this buy-and-sell gauge. This index is an excellent way to measure fear and greed, combining 16 of the most popular technical supply and demand price and volume indicators to establish a buy-and-sell signal.
📈 CBOE VIX Volatility Index
Another popular sentiment indicator is the CBOE VIX (Chicago Board Options Exchange Volatility Index). This index measures the expected volatility of the S&P 500 over the next 30 days based on options trading data. A higher VIX indicates higher market volatility and may be a sign of fear in the market.
Powered by Chicago Board Options Exchange, CBOE Volatility Index: VIX [VIXCLS], retrieved from FRED, Federal Reserve Bank of St. Louis; https://fred.stlouisfed.org/series/VIXCLS
📈 NYSE Advance-Decline Ratio
The New York Stock Exchange Advance Decline Ratio quantifies the ratio of stocks that gained versus those that lost value in a day. Price dictates emotions like fear and greed, whereas increasing stock values signify bullish sentiments.
A ratio of 1 indicates an equal number of advancing and declining stocks; a ratio above two signals a market inclined towards greed, with two stocks on the rise for every one falling.
📈 Federal Reserve Bank Financial Stress Index
Financial stress refers to disturbances in the normal operation of financial markets. This crucial leading indicator is released monthly, providing valuable insights into investor anxiety within the financial realm. Metrics such as TED spread, Swap spread, Stock Bond Correlation, Bank Stock Volatility, and others are used to gauge this stress.
When the value line surpasses zero, it signifies heightened financial stress above historical norms (fear). Conversely, a value below zero signals the markets are functioning as usual (greed). A value exceeding 0.8 typically denotes significant stress and fear in the markets, as observed in 1999, 2007, and 2020. The index spiked to a staggering value of 6 in September 2008.
📈 AAII Sentiment Indicator
The American Association of Independent Investors (AAII) Investor Sentiment Survey measures the percentage of individual investors who are bullish, bearish, and neutral on the stock market for the next six months; individuals are polled from the ranks of the AAII membership every week. On the chart, the central horizontal line represents the average bullish sentiment over the period; 0.35 means 35% of investors polled were optimistic that the stock market would rise over the next six months.
This indicator is best used as a contrarian indicator; when sentiment is extremely high, it indicates a need to sell, and when it is extremely low, it indicates a need to buy stocks.
Interpreting Sentiment Data
Interpreting sentiment data involves more than just looking at numbers. A high VIX might indicate fear, but it can also signal a potential buying opportunity if the trader is contrarian. Similarly, a low put/call ratio can mean bullish sentiment but might also suggest that the market is overbought.
Tools like the AAII Sentiment Index and the High-Low Index can provide additional context. For example, a strongly bullish reading could be a warning sign of market complacency. On the other hand, the High-Low Index gives an idea of the market’s strength based on highs versus lows.
By combining traditional and modern approaches, traders can develop a more nuanced view of market sentiment, which can help them make informed trading decisions.
My thorough testing awarded TradingView a stellar 4.8 stars!
With powerful stock chart analysis, pattern recognition, screening, backtesting, and a 20+ million user community, it’s a game-changer for traders.

Whether you're trading in the US or internationally, TradingView is my top pick for its unmatched features and ease of use.
Explore TradingView – Your Gateway to Smarter Trading!
Incorporating Sentiment into Trading Strategies
Incorporating market sentiment into trading strategies requires a structured approach. Traders need to develop a sentiment-based trading plan, implement risk management techniques, and adjust their strategies according to changes in market sentiment.
Developing a Sentiment-Based Trading Plan
A sentiment-based trading plan starts with selecting the right tools and indicators to measure sentiment. Tools like social media analysis and sentiment-scoring algorithms can be effective.
The plan must specify which sentiment indicators to follow, such as positive or negative news. The trader should determine entry and exit points based on these indicators. For example, a trader might decide to buy stocks when positive sentiment exceeds a certain threshold.
Sentiment data should be regularly reviewed. This helps update the plan as market conditions and sentiments change.
Risk Management and Sentiment
Risk management is crucial when using sentiment in trading. Traders should set stop-loss limits to protect against sudden market downturns. Diversification can help spread risk across different assets.
Using sentiment data helps identify periods of high volatility. During these times, it may be wise to reduce the size of trades. Tools like stop-limit orders can automatically sell assets if the market moves against you.
Remaining disciplined with your risk management rules is key. This prevents emotional reactions to market sentiment.
Adjusting Strategies to Market Sentiment
Market sentiment is dynamic, so trading strategies must be flexible. Regularly monitoring sentiment indicators helps identify shifts in market mood.
When negative sentiment dominates, traders might switch to more defensive strategies, like holding cash or buying put options. Conversely, positive sentiment calls for more aggressive moves, like increasing positions in growth stocks.
Adjustments should also consider external factors such as economic reports and political events. Aligning strategies with these factors and market sentiment ensures more informed and effective trades.
Regular backtesting of strategies against historical sentiment data can help fine-tune approaches, making them more resilient to changing market conditions.
Try TradingView, Our Recommended Tool for International Traders
Global Community, Charts, Screening, Analysis & Broker Integration

Global Financial Analysis for Free on TradingView
Adapting to Changing Sentiments in Financial Markets
Successful trading often requires adapting to the dynamic nature of market sentiments. Recognizing these changes, understanding the pros and cons of following them, and learning from past market impacts can provide traders with valuable insights.
Recognizing Shifts in Market Sentiment
Recognizing shifts in market sentiment is crucial for traders. One way to track sentiment is by analyzing indicators like the McClellan Oscillator and the Summation Index. Retail traders often look at the direction of these indicators to gauge whether a bullish or bearish trend is forming.
Instruments like the Commodity Futures Trading Commission’s reports on net long and net short positions also offer insights. These reports indicate the open positions held by commercial traders and large speculators. A significant shift in these positions can signal a change in overall sentiment. For instance, a spike in net long positions in gold might indicate growing bullish sentiment among traders.
Pros and Cons of Following Market Sentiment
Following market sentiment offers both opportunities and risks. On the positive side, aligning with trader sentiment during a bull market can present numerous trading opportunities. Catching trends early can lead to profitable outcomes, as seen in the rise of forex trading strategies that capitalize on prevailing market moods.
However, herd mentality can trap traders when the sentiment rapidly shifts. Contrarian investors often exploit these situations. They trade against the popular direction, betting that extreme sentiments will eventually reverse. A forex trader may take short positions when the market is overly optimistic, anticipating a correction.
Case Studies: Sentiment Shifts and Market Impact
Several case studies illustrate the impact of sentiment shifts. For example, during periods of crisis, like the 2008 financial crash, investor sentiment plummeted, leading to massive sell-offs in stocks and commodities. This shift was reflected in the behavior of large speculators who rapidly moved to protect their positions.
Central banks also influence market sentiment through interest rate actions. For instance, a reduction in interest rates can boost sentiment by making borrowing cheaper, leading to increased market activity. Meanwhile, social media now affects market sentiment, too. A Twitter trading strategy can react swiftly to trending news, significantly impacting market moves.
Studying these cases helps traders understand how open positions, changes in sentiment, and external factors like central bank policies can all converge to create significant market movements.
FAQ
Which charting software has the best sentiment indicators?
TradingView is a popular choice for charting software with advanced sentiment indicators, including AAII sentiment, CBOE VIX, NYSE Advance/Decline ratio, and the Fed Financial Stress Index.
How do large speculators influence market sentiment?
Large speculators, such as hedge funds or financial institutions, can have a significant impact on market sentiment by rapidly buying or selling large amounts of assets. This can lead to price movements that reflect their actions and can influence other traders' decisions.
Do central banks play a role in market sentiment?
Yes, central banks play a crucial role in market sentiment through their policies, particularly interest rate decisions. A decrease in interest rates can boost sentiment by making borrowing cheaper and increasing market activity.
Can social media affect market sentiment?
Yes, social media can have a major impact on market sentiment. Traders often turn to social media platforms like Twitter and Reddit for information and opinions about the market. Positive or negative posts from influential individuals or organizations can sway market sentiment.
What are some indicators of market sentiment?
Some common indicators of market sentiment include the CBOE Volatility Index (VIX), which measures the expected volatility in the S&P 500 index, and the Chicago Board Options Exchange (CBOE) Put/Call Ratio, which tracks the buying and selling of put options versus call options.
What indicators are most effective for gauging market sentiment in forex trading?
Effective indicators for gauging market sentiment in forex trading include the Commitment of Traders (COT) report, the VIX (Volatility Index), and sentiment surveys like the AAII Sentiment Survey. Additionally, tools such as social media sentiment analysis and news sentiment tracking are crucial for understanding market moods.
Can sentiment analysis be applied profitably in trading strategies?
Yes, sentiment analysis can be applied profitably in trading strategies. By analyzing market sentiment, traders can identify potential market movements and trends. For instance, high levels of bullish sentiment might indicate an upcoming market correction, allowing traders to make informed decisions.
What are some examples of sentiment-based trading strategies?
Examples of sentiment-based trading strategies include the contrarian strategy and the trend-following strategy. Contrarian traders act opposite to market sentiment, selling when sentiment is overly positive and buying when it is negative. Trend-followers, on the other hand, trade in the direction of prevailing market sentiment.
How can current market sentiment be analyzed and interpreted?
Current market sentiment can be analyzed and interpreted using sentiment indicators, analyzing social media trends, news articles, and financial reports. Sentiment scores from these sources help traders gauge whether the market is optimistic, pessimistic, or neutral, guiding their trading decisions accordingly.
What are the benefits of incorporating market sentiment into trading decisions?
Incorporating market sentiment into trading decisions offers several benefits. It allows traders to anticipate market movements, identify potential reversals, and understand broader market psychology. This can improve the timing of trades and help in managing risks more effectively.
How does one use sentiment indicators to make informed trading decisions?
Traders use sentiment indicators by integrating data from various sources, such as sentiment surveys, social media, and market reports, into their trading models. These indicators provide insights into the market's collective mood, which helps them predict price movements and make informed entry and exit points for trades.