Return on Common Equity (ROE) is a key financial metric that evaluates a company’s profitability in relation to the common equity its shareholders have invested.
This metric indicates how well a company uses the capital from its common stockholders to generate net income.
For potential and current investors, ROE is a crucial factor to consider as it provides insight into a company’s efficiency at converting the investment into profit.
Calculating this ratio helps investors understand the performance of their shares and assists in making informed comparisons between companies across industries.
Key Takeaways
- ROE provides insight into the efficiency of a company in generating profit from common shareholders’ equity.
- It is calculated using net income and average common equity, representing the percentage return to shareholders.
- Investors use ROE for performance evaluation and comparing profitability across companies.

The calculation of ROE is fairly straightforward. It involves the company’s net income and the average common equity over a specific period. Net income is the profit after all expenses, taxes, and interest are deducted from total revenue, which represents the return generated for shareholders.
The average common equity is determined by taking the sum of the beginning and ending common stock equity for a period and dividing it by two. By expressing the net income as a percentage of the average common stockholders’ equity, investors gain a clear picture of the return generated on their investments.
ROE is also used for comparative analysis, allowing investors to compare efficiency across different firms or within the same firm over different periods.
Understanding ROE and Its Significance
Return on Equity (ROE) is a revealing financial ratio that illustrates how effectively a company utilizes its equity base to generate profits. It is a key indicator of managerial efficiency and a company’s potential for long-term value creation for shareholders.
Concepts of ROE and Shareholder Value
ROE provides insight into how well a company handles its investments to produce income. Specifically, it measures the net income returned as a percentage of shareholders’ equity.
The formula to calculate ROE is fairly straightforward:
ROE = Net Income / Average Shareholders’ Equity.
A positive ROE signifies that a company efficiently generates profits from its equity financing.
This efficiency contributes to the overall shareholder value, as it directly reflects how well the company’s management uses investors’ funds to grow the business and increase equity value.

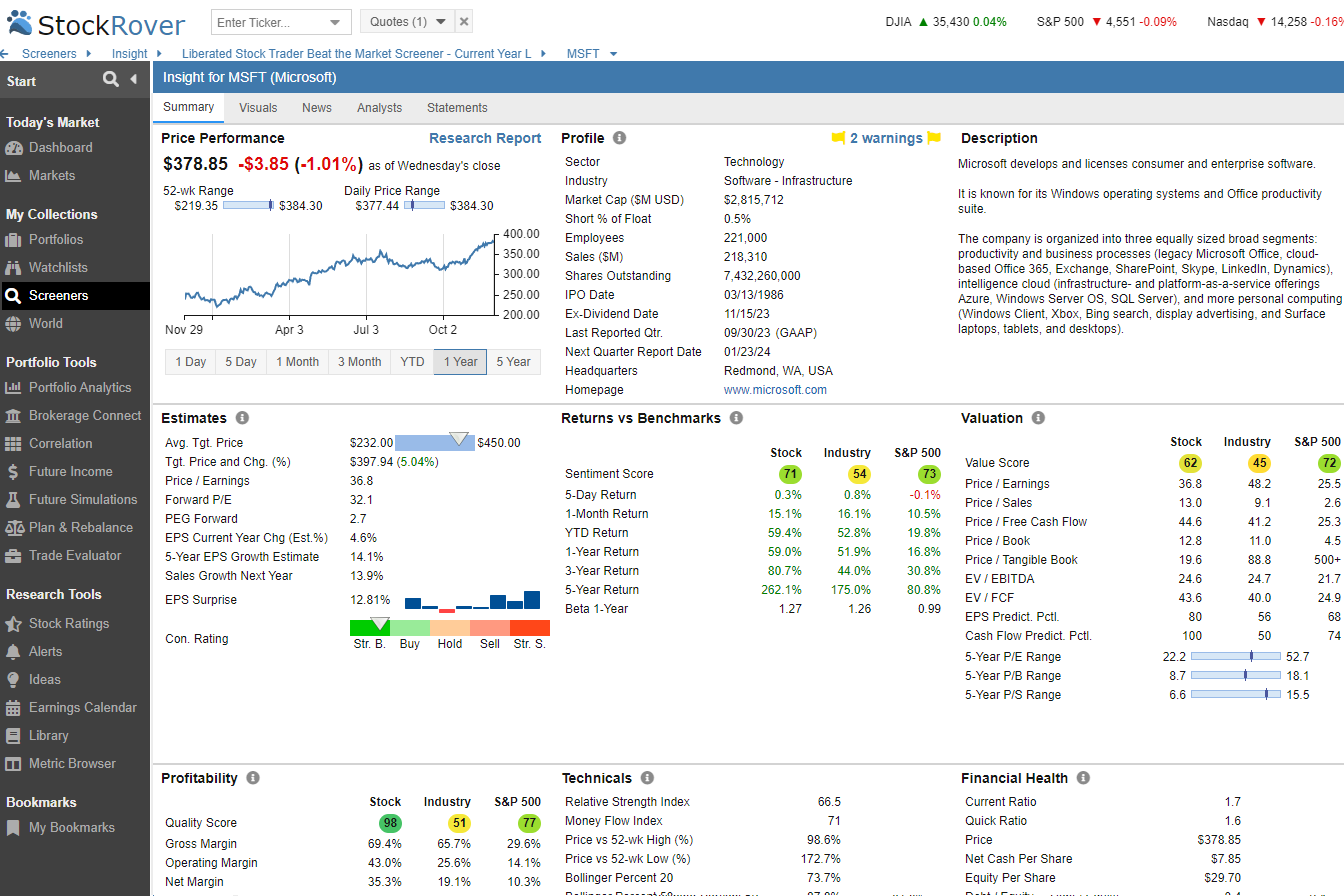
Try Powerful Financial Analysis & Research with Stock Rover
The Importance of ROE in Financial Analysis
For analysts, ROE is a critical measure when comparing the financial performance of companies within the same sector. It enables them to identify which firms are better at converting equity investments into profits. Thus, a higher ROE can distinguish a company as a potentially better investment choice.
Analysts also consider ROE from a management standpoint, as it helps evaluate the team’s effectiveness in using investment capital to develop new products, streamline operations, or expand market share. A company with a consistently high ROE is often perceived as being well-managed.
ROE Calculation Methodology
Calculating the Return on Common Stockholders’ Equity (ROE) allows investors to gauge how efficiently a company employs its equity capital to generate profit. Analysts can use the ROE formula as a performance metric by scrutinizing the balance sheet and income statement.
Components of the ROE Formula
The ROE formula requires two primary components from a company’s financial statements: net income and average shareholders’ equity. Net income, the profit after all expenses and taxes have been deducted, is often found on the company’s income statement. Shareholders’ equity represents a company’s net assets (total assets minus total liabilities) and can be found on the balance sheet.
The equation expresses the calculation of ROE:
ROE = (Net Income / Average Common Shareholders' Equity)
Where:
- Net Income = Net profit after all expenses and taxes have been deducted
- Average Common Shareholders’ Equity = Average of the shareholders’ equity at the beginning and end of a period (usually one year)
Interpreting the ROE Equation
The outcome of the ROE equation indicates how well a company leverages its equity base to generate earnings. A higher ROE implies more effective management and utilization of equity capital. However, it’s essential to consider the company’s capital structure, as debt can influence ROE. For a thorough analysis, comparing a company’s ROE against its industry average provides a clearer picture of relative performance.
A Practical ROE Example
| Financial Information | TechCo ($ m) | HealthInc ($ m) |
|---|---|---|
| Net Revenue | 500 | 450 |
| Cost of Goods Sold | 200 | 150 |
| Expenses | 100 | 120 |
| Earnings Before Interest & Taxes (EBIT) | 200 | 180 |
| Interest Expense | 50 | 40 |
| Earnings Before Taxes (EBT) | 150 | 140 |
| Net Earnings | 120 | 112 |
| Average Common Shareholders’ Equity | 600 | 500 |
| ROE | 20% | 22.6% |
Given this information, we can calculate ROE using the formula:
ROE for TechCo = Net Earnings / Average Common Shareholders’ Equity = 120 / 600 = 0.2 or 20%
ROE for HealthInc = Net Earnings / Average Common Shareholders’ Equity = 112 / 500 = 0.224 or 22.4%
Now, let’s break this down in simple terms.
Return on Common Equity (ROE) measures how efficiently a company uses the money invested by its common shareholders to generate profits. In our example, for every dollar of common shareholders’ equity, TechCo generates 20 cents of profit, while HealthInc generates 22.4 cents of profit.
Even though TechCo has higher net earnings, HealthInc is more efficient at using its equity to generate profit. This could be due to better management, more favorable market conditions, or other factors.
Investors often use ROE to decide where to invest their money. A higher ROE can indicate a more profitable company, but it is important to look at the bigger picture, including risk, market trends, and other financial ratios.
Remember, while ROE can be a useful tool for comparing two companies’ profitability, it doesn’t tell the whole story. Always consider other financial metrics and qualitative factors when making investment decisions.
My thorough testing awarded TradingView a stellar 4.8 stars!
With powerful stock chart analysis, pattern recognition, screening, backtesting, and a 20+ million user community, it’s a game-changer for traders.

Whether you're trading in the US or internationally, TradingView is my top pick for its unmatched features and ease of use.
Explore TradingView – Your Gateway to Smarter Trading!
Factors Affecting ROE
The return on common stockholders’ equity (ROE) gauges a company’s proficiency in generating profits from its equity. Directly linked to a company’s financial decisions, it is influenced by several key financial metrics.
Impact of Net Profit Margin on ROE
Net profit margin is a crucial indicator of a company’s efficiency in converting sales into profits. A high net profit margin increases ROE because the company generates more net income from each dollar of revenue. Net profit margin considers all expenses, taxes, and interest, and the resulting net profits significantly influence the equity holders’ returns.
Influence of Asset Turnover and Leverage
asset turnover measures how well a company uses its assets to produce revenue; the higher the asset turnover, the more efficient it is at generating revenue from its assets, enhancing the ROE. Conversely, financial leverage, which involves using borrowed capital for investment, amplifies the potential ROE. Companies with high leverage can experience volatile ROCEs, particularly if the debt costs change or the market conditions fluctuate.
Role of Equity Financing versus Debt Capital
The balance between equity financing and debt in a company’s capital structure also dictates ROE. Equity financing increases the shareholder’s equity base, which can dilute the ROE since the same amount of profits is spread over a larger amount of equity. On the other hand, utilizing debt capital can improve ROE, provided the company earns more on investments than it pays in interest, manifesting the benefits of leveraging liabilities to bolster stakeholder returns.
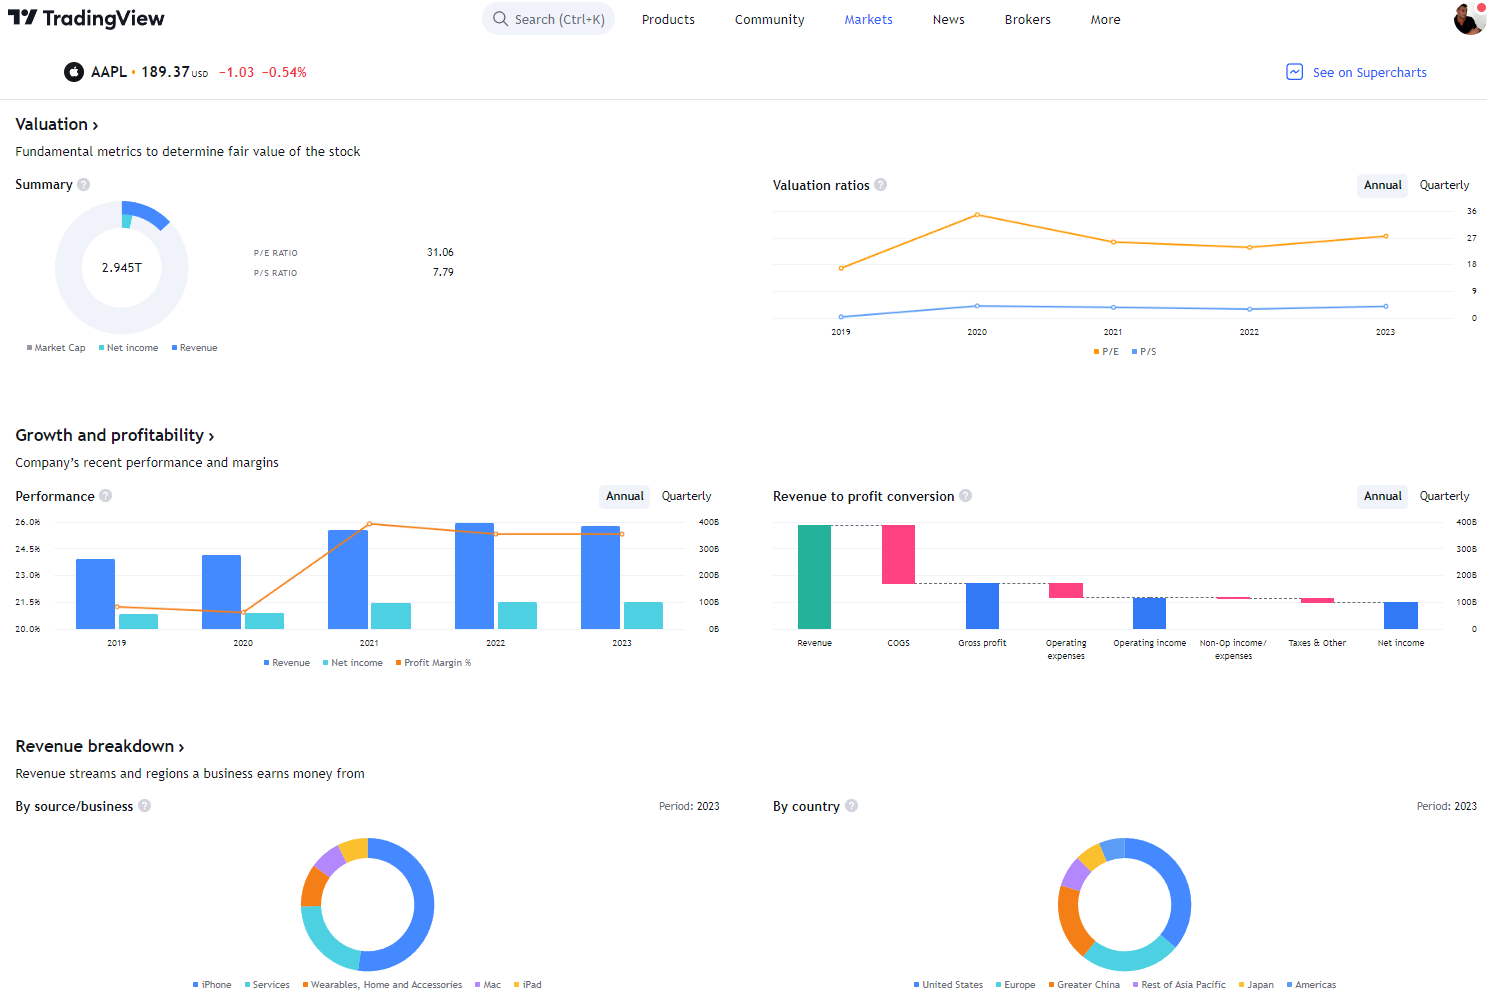
Try TradingView, Our Recommended Tool for International Traders
Global Community, Charts, Screening, Analysis & Broker Integration

Global Financial Analysis for Free on TradingView
Comparative Analysis and Benchmarks
In finance, Return on Common Stockholders’ Equity (ROE) is crucial for comparing profitability and growth metrics across different industries and within peer groups.
Cross-Industry ROE Comparison
Comparing Return on Equity (ROE) among different industries reveals the varying levels of profitability and financial health that can exist across the economic spectrum. A financial metric, ROE, fundamentally measures how effectively a company uses investors’ funds to generate profits. For instance, technology firms may demonstrate higher ROE ratios than utility companies, indicating a more robust potential for growth and returns on equity in the tech industry. Benchmarking against industry averages aids in assessing a company’s performance against its competitors.
ROE and Growth Metrics across the Same Industry
Analyzing ROE alongside growth metrics within the same industry allows investors to identify which companies are managing their equity most efficiently. It involves critically comparing equity returns to the industry’s benchmarks to ascertain a firm’s standing relative to its peers. For example:
- High ROE and High Growth Rate: A signal that a company is generating substantial profits from its equity and is growing rapidly.
- High ROE and Low Growth Rate: This may suggest that while the company is currently efficient, it might not invest enough in future growth.
- Low ROE and High Growth Rate: This could indicate heavy reinvestment that has yet to yield high returns but may do so.
Organizations that consistently maintain higher ROE than the industry average are often considered healthier and more adept in their financial strategies.
Assessing Risks and Limitations of ROE
Return on Equity (ROE) is a widely used indicator of a company’s profitability but can sometimes provide a distorted view of financial performance. Understanding its risks and limitations is crucial for a clear and accurate assessment.
When ROE Can Be Misleading
Return on equity can be misleading if not analyzed in the proper context. For instance, a high ROE might suggest exceptional efficiency in generating profits, yet this figure may be inflated. Companies with significant debt can exhibit elevated ROE levels because their equity base is smaller due to borrowing. It’s also important to consider that extraordinary items or one-time events can skew ROE, presenting an unsustainable performance snapshot.
Sustainable ROE and Financial Health
Sustainable ROE indicates a company’s ability to achieve healthy long-term financial performance. Using DuPont Analysis, it dissects ROE into three components: net profit margin, asset turnover, and financial leverage. This analysis helps investors determine whether a high ROE results from strong profit margins, efficient use of assets, or excessive financial leverage. Truly sustainable ROE is derived from a company’s core operations and not from factors that pose risks to its future stability.
FAQ
How is the return on common stockholders' equity computed?
Return on common stockholders' equity is calculated by dividing a company's net income by its average common stockholders' equity. This formula highlights the returns generated specifically on the equity held by common shareholders. Understanding this calculation is essential for investors evaluating a company's profitability relative to shareholder equity.
What does a high return on equity indicate about a company?
A high return on equity typically signifies that a company effectively utilizes its equity base to generate profits. It indicates management's efficiency in converting shareholders' investments into earnings, which can be a positive sign to investors looking for companies with strong operational capabilities.
What factors contribute to the return on common stockholders' equity?
Several factors, including profit margins, asset turnover, and financial leverage, can influence common stockholders' equity returns. Companies often seek balance among these factors to optimize returns without taking on excessive risk.
How does the common equity ratio impact return on equity?
The common equity ratio, which reflects the proportion of a company's total equity available to common shareholders, impacts the return on equity by determining how much of the company's earnings is attributable to common shareholders. A higher ratio suggests that common shareholders have a larger claim on earnings.
What is considered a strong return on equity for a company?
A strong return on equity is contingent on the industry and economic context. Still, as a rule of thumb, rates that exceed the average for the company's industry can be considered strong. Investors often compare a company's ROCE against that of its peers to discern its relative performance.
How can a company improve its return on common stockholders' equity?
A company can improve its return on common stockholders' equity through initiatives such as cost-cutting, increasing sales, optimizing asset utilization, or paying down debt. Each strategy aims to bolster profitability or efficiency, thus potentially enhancing the returns to common shareholders.
Investing In Stocks Can Be Complicated, Stock Rover Makes It Easy.
Stock Rover is our #1 rated stock investing tool for:
★ Growth Investing - With industry Leading Research Reports ★
★ Value Investing - Find Value Stocks Using Warren Buffett's Strategies ★
★ Income Investing - Harvest Safe Regular Dividends from Stocks ★

"I have been researching and investing in stocks for 20 years! I now manage all my stock investments using Stock Rover." Barry D. Moore - Founder: LiberatedStockTrader.com
