Stock market indices are collections of selected stocks representing either a whole market or specific sectors. By providing a snapshot of market trends, they act as benchmarks for investors, fund managers, and analysts.
A stock market index acts as a benchmark for measuring the performance of a group of stocks. These stocks are carefully chosen to represent a particular market or sector, and their collective performance indicates how that market or sector is doing as a whole.
In other words, stock market indices help investors understand how the overall market is performing and make informed investment decisions based on this information.
Key Takeaways
- Stock market indices help investors gauge overall market performance.
- Understanding index composition is crucial for informed investing.
- Index funds and ETFs are practical and diversified investments.
- I invest the majority of my long-term capital in the Nasdaq 100 (QQQ) ETF.
Understanding Stock Market Indices
Stock market indices provide insights into market performance and serve as benchmarks. Different types of indices offer varied information on market segments, and some indices are more popular and widely used than others.
The Role of Indices in Financial Markets
Stock market indices help investors track the performance of specific market segments. They simplify the process of monitoring market trends by aggregating the price movements of multiple stocks into a single value, which reflects the overall health of the market or a sector.
Indices also serve as benchmarks. For instance, mutual funds and ETFs often compare their performance to indices like the S&P 500, which helps investors gauge the effectiveness of their investments. Furthermore, policymakers and economists study index trends to understand economic conditions and make informed decisions.
Different Types of Indices
There are various types of stock market indices, each with its methodology for selecting and weighting stocks. Examples include the S&P 500, Dow Jones Industrial Average, Nasdaq Composite, and Russell 2000. Each index has its unique composition and represents different aspects of the market. For example, the S&P 500 tracks the top 500 large-cap companies in the US, while the Nasdaq Composite focuses on technology and growth-oriented companies.
The Wilshire 5000 covers almost all publicly traded companies. In contrast, the S&P 500 focuses on 500 of the largest companies in the US, providing a snapshot of the large-cap market.
Sector-specific indices focus on particular industries. For example, there are indices for the technology, healthcare, and finance sectors. International indices, like the FTSE 100, track the performance of non-U.S. companies. These indices help investors diversify their portfolios beyond their home country.
Popular Stock Market Indices
Several indices are widely followed due to their comprehensive coverage and reliability. The Dow Jones Industrial Average is one of the oldest and covers 30 significant US companies. The Nasdaq focuses heavily on technology firms and includes both domestic and international companies.
The Russell 2000 is a key index for small-cap stocks, providing insight into the performance of smaller corporations. Internationally, the Nikkei 225 tracks 225 prominent companies on the Tokyo Stock Exchange. Each of these indices provides important insights into different segments of the global economy.
S&P 500
One of the most commonly used indices is the S&P 500, which tracks 500 large-cap US companies across various industries. It is considered a benchmark for the overall performance of the US stock market and is often used as a measure of economic health.
NASDAQ 100
Another popular index is the NASDAQ 100, which consists of the 100 largest non-financial companies listed on the Nasdaq Stock Market. This includes technology giants like Apple, Amazon, and Google, as well as biotech and pharmaceutical companies.
Dow Jones Industrial Average
The Dow Jones Industrial Average (DJIA), also known as “the Dow,” tracks the stock performance of 30 large publicly traded US companies across various industries. It is considered a barometer for the overall health of the US economy and is often used to gauge market trends.
Russell 2000
The Russell 2000 is a stock market index that tracks the performance of 2,000 small-cap companies in the US. It includes a diverse range of industries and is often used to measure the health of the broader economy, as smaller companies are more sensitive to economic changes.
Wilshire 5000
The Wilshire 5000 Total Market Index is a stock market index that includes all publicly traded companies in the US, making it one of the broadest measures of the US stock market. It is often used as a benchmark for long-term performance and overall market trends.
Nasdaq Composite
The Nasdaq Composite Index includes over 3,000 stocks listed on the Nasdaq exchange and is heavily weighted toward technology companies. It is considered a barometer for the performance of the tech sector and can be used to track trends in this industry.
My thorough testing awarded TradingView a stellar 4.8 stars!
With powerful stock chart analysis, pattern recognition, screening, backtesting, and a 20+ million user community, it’s a game-changer for traders.

Whether you're trading in the US or internationally, TradingView is my top pick for its unmatched features and ease of use.
Explore TradingView – Your Gateway to Smarter Trading!
Index Composition and Methodology
The construction and methodology behind stock market indices can greatly affect their behavior and performance. Different methods, such as price-weighted and market-cap-weighted indices, sector-specific indices, and updates to index components, all play critical roles.
Price-weighted vs. Market-cap-weighted
Stock market indices can be calculated in various ways. A price-weighted index considers the price of each stock. Examples include the Dow Jones Industrial Average. In this formula, stocks with higher prices have more influence on the index.
On the other hand, a market-cap-weighted index uses the market capitalization of companies. Higher market-cap companies hold more weight. This method is used by indices like the S&P 500. Market-cap weighting better reflects a company’s size and economic impact than the price-weighted method.
Sector and Industry Indexes
Sector and industry indexes focus on specific segments of the economy. Technology and biotech are common examples. These indices help investors target particular areas for investment, providing a detailed view of specific market segments.
Sector indexes allow for the analysis of performance trends within a given industry. They can often be more volatile because they are less diversified and impacted by industry-specific factors. Investors use these indices to gauge the health of particular sectors, like technology or healthcare.
Updating Index Components
Index components are periodically reviewed and updated to ensure they represent the current market. Stocks are added or removed based on criteria like market cap, liquidity, and sector performance. The S&P CNX Nifty 50 index, for example, uses an event study methodology.
Updating index components ensures the index remains relevant. It reflects the most significant entities in the market. Changes can affect stock prices, as investors may buy or sell based on index inclusion or exclusion.
Regular updates maintain the integrity and accuracy of the index, ensuring it mirrors current market conditions. This process involves rigorous analysis and assessment to maintain balance and representativeness.
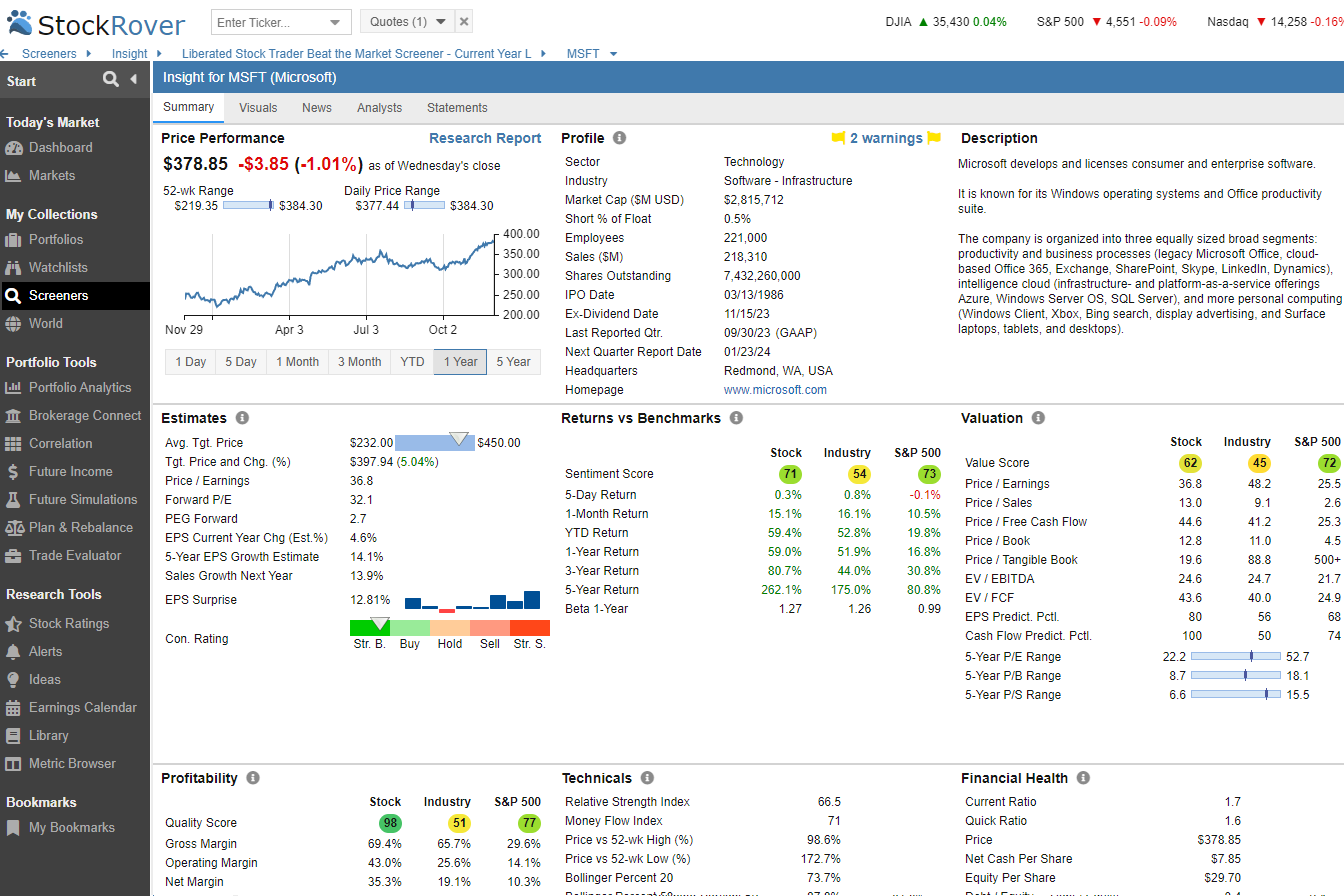
Try Powerful Financial Analysis & Research with Stock Rover
Investing in Index Funds and ETFs
Investing in Index Funds and ETFs offers various benefits such as diversification and cost-efficiency. It is important to understand the costs and returns associated with them and to know how to select the right index fund.
Benefits of Passive Index Investing
Index Funds and Exchange-Traded Funds (ETFs) provide broad market exposure. By investing in a Total Market Index, investors can hold a wide range of securities. This diversification reduces risk because the performance of the portfolio is not tied to a single stock or sector.
Cost efficiency is another significant advantage. Index Funds and ETFs often have lower management fees than actively managed funds. This is because they track a benchmark index without the need for active management.
Additionally, these funds are relatively easy to buy and sell. ETFs, in particular, can be traded on stock exchanges like regular stocks, allowing investors flexibility in managing their investments.
Don’t Invest In Index ETFs Until You Read These 13 Pro Tips!
Understanding the Costs and Returns
Expense ratios are a key cost to consider. These are annual fees expressed as a percentage of the total investment. ETFs typically have lower expense ratios than mutual funds. For example, an ETF tracking the S&P 500 might have an expense ratio of 0.1%, while an actively managed fund could charge 1% or more.
ETFs also have trading costs. Because they are traded like stocks, buying and selling ETFs incur brokerage fees. However, many brokers now offer commission-free trades for a wide range of ETFs.
Returns vary depending on the performance of the underlying index. Over the long term, index funds generally provide consistent returns that mirror the market’s performance. While they may not beat the market, they also don’t significantly underperform it.
Selecting the Right Index Fund
Choosing the right fund involves considering several factors. First, look at the benchmark index the fund tracks. A Total Market Index offers broad exposure, while sector-specific indices target particular industries.
Next, review the expense ratio. Lower fees can enhance net returns over time. It’s crucial to balance cost with performance.
Also, consider the fund’s track record. Even though past performance is not indicative of future results, a consistent track record can be reassuring.
Finally, evaluate the fund manager’s reputation and the fund’s liquidity. Well-managed funds and those with higher liquidity are usually more reliable choices for investors.
Try TradingView, Our Recommended Tool for International Traders
Global Community, Charts, Screening, Analysis & Broker Integration

Global Financial Analysis for Free on TradingView
Market Indicators and Investor Sentiment
Market indicators help investors understand financial market trends and performance. Investor sentiment gauges the overall mood and opinions of market participants.
Interpreting Stock Index Movements
Stock index movements provide insights into the overall market performance. When stock indices like the S&P 500 or Dow Jones increase, it often indicates a positive investor sentiment. Conversely, declining indices suggest negative sentiment. For example, a drop in the German sentiment index “Sentix” can reflect broader economic concerns.
Analysts use indices to predict future market trends. They consider factors like trading volume, volatility, and historical data. High trading volumes can signal confidence, while spikes in volatility might indicate uncertainty or fear among investors. These indicators help in making informed investment decisions.
Indexes as Economic Indicators
Indices also act as economic indicators, providing a snapshot of the economy’s health. For instance, a steady rise in stock indices can suggest economic growth and stability.
Financial markets react to various economic reports, such as employment rates and GDP growth. Positive reports often boost investor confidence, driving indices up. Negative reports can lead to declines. Thus, studying indices helps in understanding how economic events impact market sentiment and vice versa.
FAQ
What is the best software to analyze global stock market indexes?
TradingView is an excellent software for analyzing global stock market indexes. It offers a wide range of technical indicators and charting tools to help you analyze and track various indices.
Can I invest directly in a stock index?
Yes, there are several ways to directly invest in a stock index. You can buy shares of an exchange-traded fund (ETF) that tracks the index's performance or purchase futures contracts on the index.
What are the benefits of investing in stock indices?
Investing in stock indices allows for diversification as it provides exposure to multiple companies and sectors within one investment. It also offers liquidity and transparency as the prices of indices are publicly available, making it easier to track their performance.
What constitutes a stock market index?
A stock market index is a collection of stocks grouped together to represent a portion of the market. These stocks are usually from the same sector or industry.
How are stock market indices calculated?
Stock market indices are calculated using various methods, such as price weighting, market-cap weighting, and equal weighting. Each method emphasizes different aspects of stock performance.
Can you list the major stock indexes globally?
Major stock indices include the Dow Jones Industrial Average in the USA, the FTSE 100 in the UK, the Nikkei 225 in Japan, and the DAX in Germany.
What is the difference between an index fund and a stock index?
A stock index measures market performance, while an index fund is a type of mutual fund designed to track and match the performance of that index.
How does the inclusion of a company in a stock market index affect it?
When a company is included in an index, it often experiences increased visibility and higher trading volumes, which can boost stock prices.
What do changes in stock market indices indicate about the economy?
Changes in stock market indices can reflect economic trends. Rising indices often suggest economic growth, while falling indices may indicate economic downturns or uncertainty.