In technical analysis, the Supertrend indicator determines the direction of price momentum and identifies buy and sell signals in a trending market.
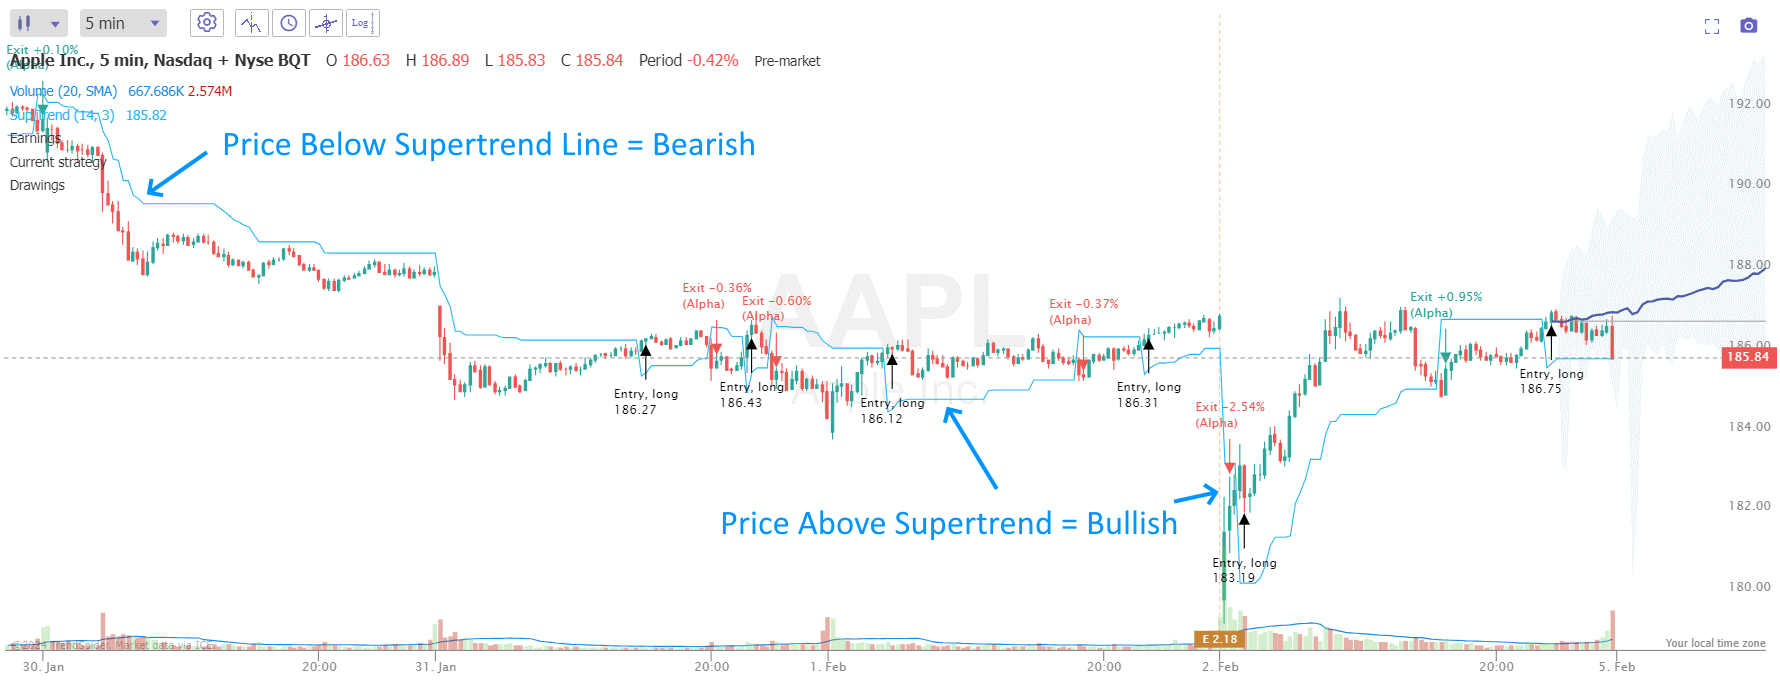
The Supertrend indicator plots a line on the price chart; when the price is above this line, the trend is considered bullish, suggesting a potential buy signal. If the price is below the line, it’s bearish, indicating a sell signal.
It is calculated using the average true range (ATR) and price volatility to identify trend reversals.
But is Supertrend a reliable, profitable indicator? I conducted 4,052 backtested trades using 307 years of data for 30 Dow Jones Industrial stocks to determine if the Supertrend is super!
Key Takeaways
- The Supertrend indicator is a volatility-based technical analysis tool that helps determine market trend direction.
- Supertrend averages a win rate of 42%, with 58% of trades losing.
- It provides clear buy and sell signals based on price position relative to its plotted line on the chart.
- Supertrend demonstrates a low profit expectancy on daily and intraday charts.
The Supertrend indicator helps simplify analysis and can be applied across various timeframes and asset classes. However, our research suggests it should never be used in isolation in a trading strategy.
Understanding Supertrend
The Supertrend Indicator is a trend-following tool that helps you understand market trends. It dynamically combines price movement data with volatility.
Olivier Seban developed the Supertrend Indicator, which is designed to be a robust trend-following indicator. It aims to identify and suggest the prevailing market trend, indicating bullish or bearish signals through the price chart. The use of this indicator has grown as traders look for tools that can help reduce the uncertainty associated with market fluctuations.
Trading with the Supertrend Indicator
The Supertrend Indicator is a powerful tool for identifying market trends and generating buy or sell signals. Understanding how to apply it effectively can enhance your trading strategy.
Basic Supertrend Strategy
When trading with the Supertrend Indicator, your primary focus is on prices above or below the Supertrend line. For a buy signal, you wait for the price to close above the Supertrend line. A sell signal is when the price has closed below the line.
- Buy Order: Place when the price is above the indicator.
- Sell Order: Execute when the price is below the indicator.

Backtest Your Strategies on TrendSpider Now
✩ How to Set Up Supertrend Backtesting ✩
Backtesting evaluates the performance of Supertrend-based strategies by assessing how the indicator would have behaved under different market conditions. This exercise allows you to refine your approach and apply adjustments for future trades.
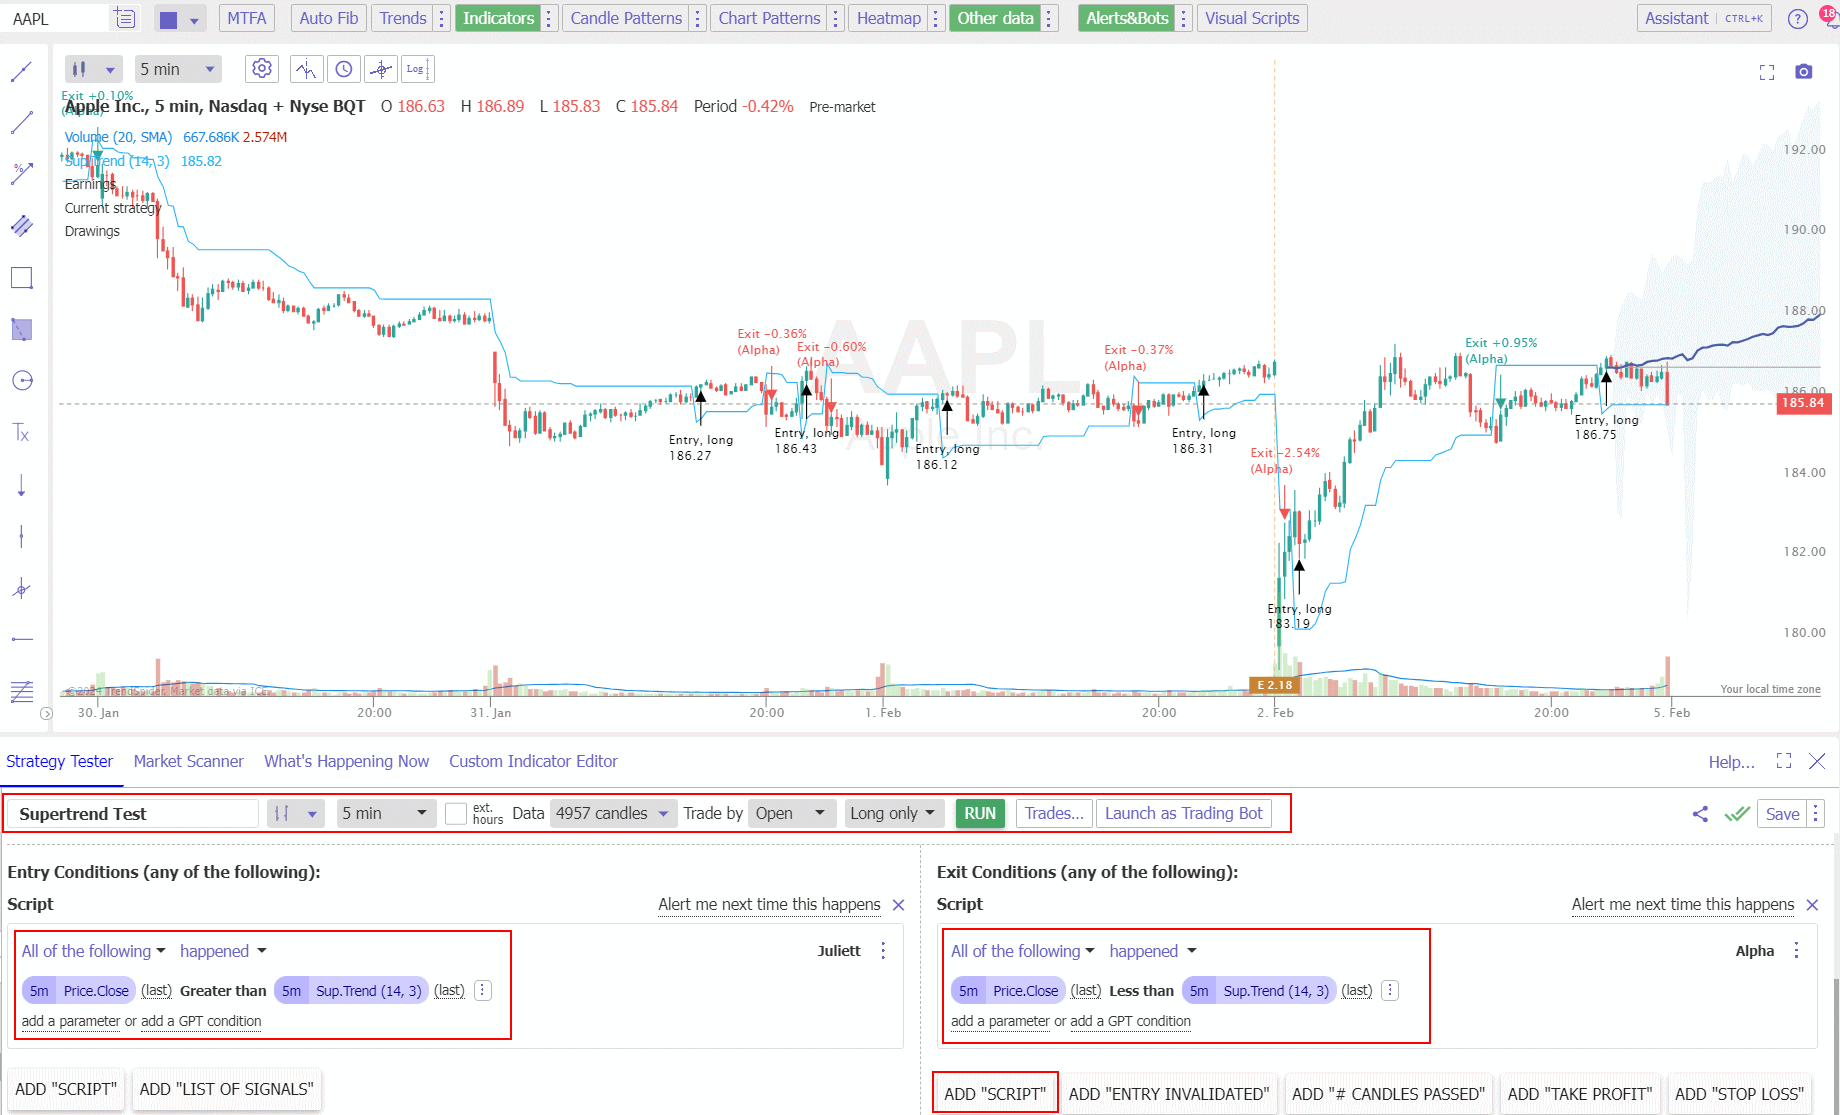
To set up Supertrend backtesting strategies and enable a scientific approach to prove this indicator’s effectiveness, I used TrendSpider.
- A 5-minute timeframe on an OHLC/Candlestick chart for day trading.
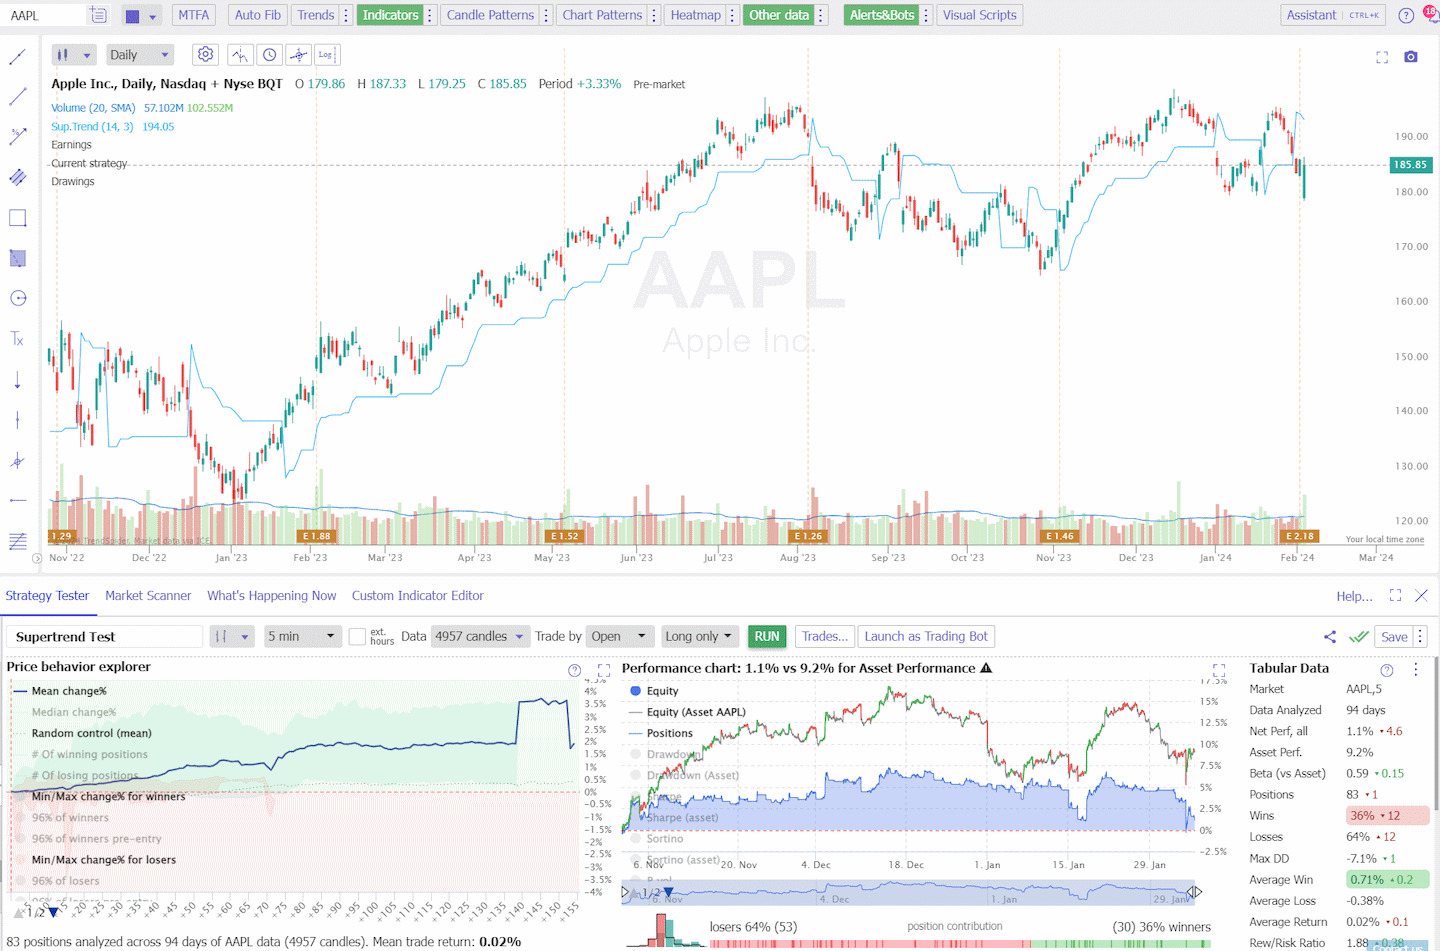
- A daily timeframe on an OHLC/Candlestick chart for swing trading.
To reproduce these tests, follow these steps.
Supertrend Trading Strategy Setup
- Register for TrendSpider.
- Buy Signal: Select Strategy Tester > Entry Condition > Add Script > Add Parameter > Condition > Price. Close > Greater than > Supertrend (14).
- Sell Signal: Exit Condition > Add Script > Add Parameter > Condition > Price. Close > Less than > Supertrend (14).
- Select the timeframe and chart time (in the lower pane).
- Finally, click “RUN.”
See the image below for the exact configuration.

Start Backtesting with TrendSpider
✩ Supertrend Backtest Day Trading Results ✩
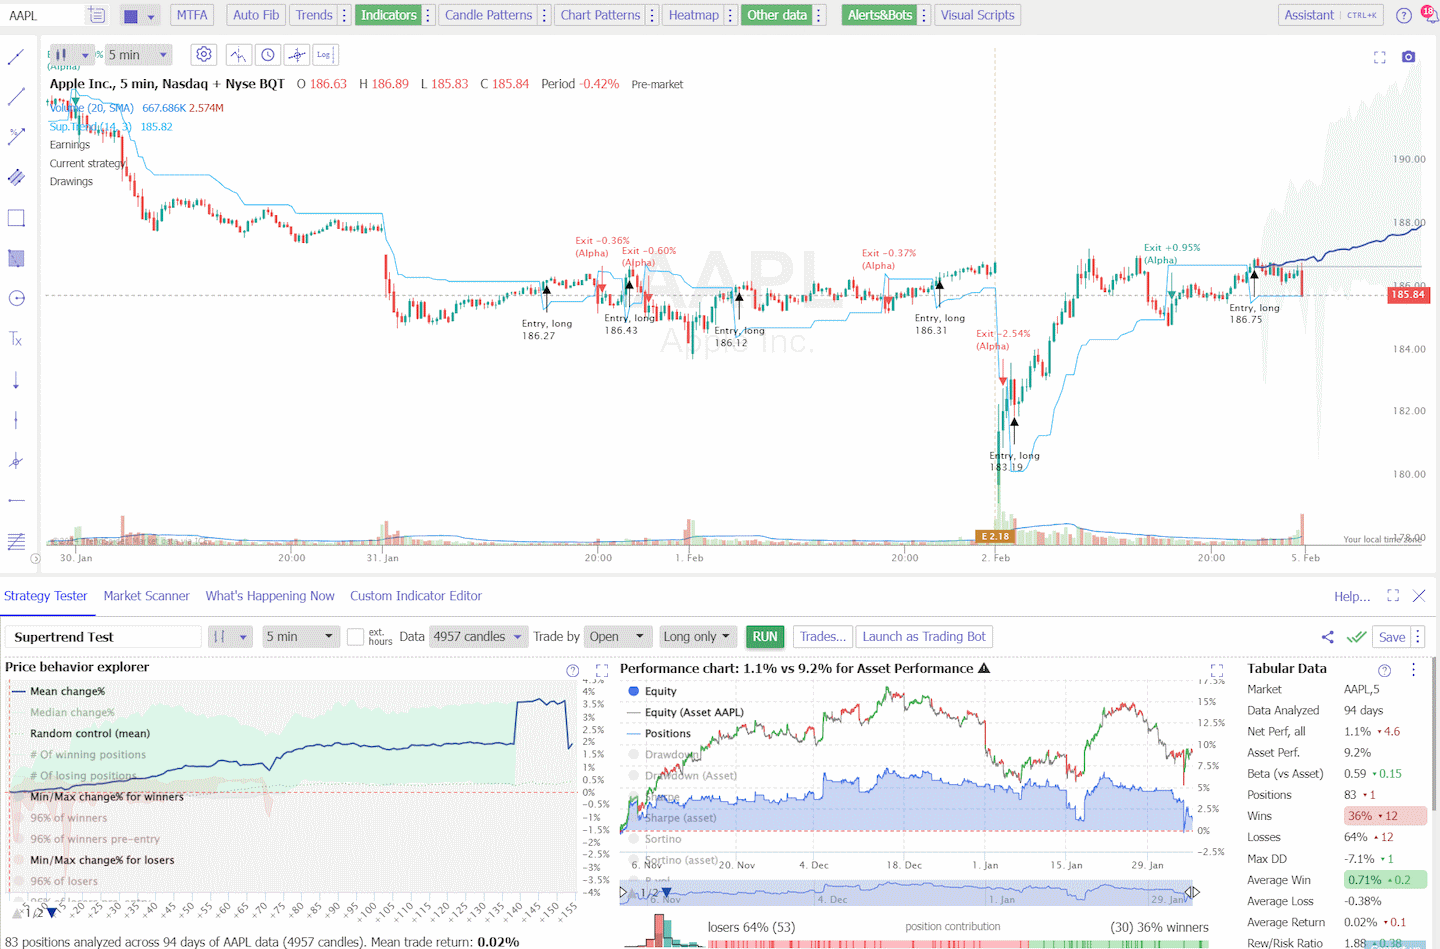
I tested Supertrend on the Dow Jones Industrial Average 30 stocks over 94 days, encompassing 2,597 trades. The Supertrend indicator is not profitable for day traders using a standard candlestick/OHLC chart. It produced a 42% win rate; the average win was 0.8%.
The risk-reward ratio was 2.04, but the profit expectancy of 0.27 is low, meaning day traders should avoid using this indicator with a standard setting of 14.

Backtest Your Strategies on TrendSpider Now
Table: Supertrend Indicator Day Trading Results
The table below provides detailed backtesting results for the Supertrend indicator when applied to day trading on a 5-minute chart. Overall, the indicator was unprofitable for day traders.
| Supertrend Test Results | 5-Minute Chart |
| #Trades | 2597 |
| Data Analyzed (years) | 7.726027 |
| Wins | 42% |
| Losses | 58% |
| Max DD | -7% |
| Max DD (Asset) | -9% |
| Average Win | 0.8% |
| Average Loss | -0.4% |
| Average Return | 0.1% |
| Rew/Risk Ratio | 2.04 |
| Expectancy | 0.27 |
The Supertrend indicator was tested over 7.7 years, with 2,597 trades executed. The win rate was only 42%, indicating that less than half of the trades resulted in a profit.
When analyzing the performance in terms of risk, the maximum drawdown (DD) was measured at -7%. This means that the largest decline in account value during the testing period was 7%. The maximum drawdown for the traded asset was also measured at -9%.
The average win from profitable trades was 0.8%, while the average loss from losing trades was -0.4%. This suggests that the gains from winning trades were relatively small.
The risk-reward ratio, which compares the potential profit to the potential loss, was 2.04. Although this ratio indicates that the potential reward doubled the potential risk, the profit expectancy was only 0.27. This means that, on average, the Supertrend indicator yielded a low profit of 0.27% per trade.
In summary, the backtesting results of the Supertrend indicator on a 5-minute chart showed a lack of profitability for day traders. The win rate was relatively low, the average win was small, and the profit expectancy was low. Therefore, day traders should avoid using this indicator with the standard setting of 14 on a candlestick/OHLC chart.
My thorough testing awarded TradingView a stellar 4.8 stars!
With powerful stock chart analysis, pattern recognition, screening, backtesting, and a 20+ million user community, it’s a game-changer for traders.

Whether you're trading in the US or internationally, TradingView is my top pick for its unmatched features and ease of use.
Explore TradingView – Your Gateway to Smarter Trading!
✩ Supertrend Backtest Swing Trading Results ✩
I tested Supertrend on the Dow Jones Industrial Average 30 stocks over ten years, encompassing 1,455 trades. The Supertrend indicator is not profitable for swing traders using a standard daily candlestick/OHLC chart. It produced a 43% win rate; the average win was 7.8%.
The risk-reward ratio was 1.86, but the profit expectancy of 0.21 is low, meaning swing traders should avoid using this indicator in isolation.

Table: Supertrend Indicator Day Trading Results
| Supertrend Test Results | Daily |
| #Trades | 1455 |
| Data Analyzed (years) | 299.6 |
| Wins | 43% |
| Losses | 57% |
| Max DD | -39% |
| Max DD (Asset) | -47% |
| Average Win | 7.8% |
| Average Loss | -4.3% |
| Average Return | 0.9% |
| Rew/Risk Ratio | 1.86 |
| Expectancy | 0.21 |
The results indicate that the Supertrend indicator is not profitable for swing traders when relying solely on a standard daily candlestick/OHLC chart. Swing traders should be cautious, with a win rate of only 43% and an average win of 7.8%.
The risk-reward ratio of 1.86 seems promising, but the low profit expectancy of 0.21 suggests that the Supertrend indicator did not demonstrate profitability based on the analyzed data.
Is Supertrend a dependable and profitable indicator?
Based on our extensive testing, we have determined that Supertrend is not reliable or profitable when used as a standalone indicator. With an average profit expectancy of 0.24, it is recommended that the Supertrend be combined with other indicators.
Supertrend Overall Test Results
| Supertrend Performance | Daily | 5-Minute | Total |
| #Trades | 1,455 | 2,597 | 4,052 |
| Data Analyzed (years) | 299.6 | 7.7 | 307 |
| Wins | 43% | 42% | 42% |
| Losses | 57% | 58% | 58% |
| Max DD | -39% | -7% | -23% |
| Max DD (Asset) | -47% | -9% | -28% |
| Average Win | 7.8% | 0.8% | 4% |
| Average Loss | -4.3% | -0.4% | -2% |
| Average Return | 0.9% | 0.1% | 0% |
| Rew/Risk Ratio | 1.86 | 2.04 | 1.95 |
| Expectancy | 0.21 | 0.27 | 0.24 |
Calculating the Supertrend Indicator
Two main components underlie the Supertrend Indicator:
- Average True Range (ATR): A volatility indicator that measures market volatility by decomposing the entire range of an asset price for that period.
- Multiplier: A predefined value optimized according to the asset being traded, fine-tuning the indicator’s sensitivity to price movements.
The combination of these components ensures the Supertrend Indicator reflects both price action and market volatility, offering a unique perspective on trends.
Supertrend Formula
The Supertrend Indicator’s calculation involves a few steps:
- Basic Upper Band (UB):
(High + Low) / 2 + (Multiplier * ATR) - Basic Lower Band (LB):
(High + Low) / 2 - (Multiplier * ATR) - Final Upper Band (FUB): If the current price exceeds the previous FUB, then FUB = Max of the current UB or previous FUB. If not, then FUB = current UB.
- Final Lower Band (FLB): If the current price is less than the previous FLB, then FLB = Min of the current LB or previous FLB. If not, then FLB = current LB.
The Supertrend flips between these upper and lower bands based on the price position relative to the bands. If the price surpasses the upper band, the indicator turns bullish (changes to green), suggesting an upward trend. Conversely, if the price falls below the lower band, it turns bearish (changes to red), indicating a downward trend. The ongoing calculations adapt to the market, thus allowing you to gauge trend direction effectively.
Best Supertrend Settings in Different Markets
When you apply the Supertrend Indicator to different markets, it’s important to adjust its parameters according to the specific market’s characteristics.
In the forex market, due to around-the-clock trading, the indicator might require greater sensitivity to capture more frequent trend changes. For stocks, the standard daily timeframe may provide a solid trend confirmation.
Regarding commodities and futures, the indicator’s performance can be influenced by market-specific factors like contract expirations and storage costs, which could affect the trend indication.
Utilizing Supertrend for Multiple Timeframes
For various timeframes like intraday, daily, or weekly charts, the Supertrend can serve different trading strategies.
Day traders might prefer shorter periods, such as hourly charts for entry and exit signals, while longer-term traders may look to daily or weekly charts for broader trend confirmation. This flexibility makes it a valuable tool for timing trades in line with your trading style.
Limitations of Supertrend
The Supertrend indicator does carry certain limitations. As with most indicators, there is no guarantee of 100% success; false signals can occur, particularly in sideways markets. You should know that this indicator works best in a trending market and is less reliable when the markets are choppy and directionless.
Moreover, while simplicity is a noted advantage, it can also be a drawback as the indicator might oversimplify complex market conditions. There’s a risk of oversights when relying solely on the Supertrend without considering other indicators and forms of analysis. Therefore, using it alongside other indicators and tools is often recommended to confirm signals and improve trading outcomes.
You want to be a successful stock investor but don’t know where to start.
Learning stock market investing on your own can be overwhelming. There’s so much information out there, and it’s hard to know what’s true and what’s not.
Liberated Stock Trader Pro Investing Course
Our pro investing classes are the perfect way to learn stock investing. You will learn everything you need to know about financial analysis, charts, stock screening, and portfolio building so you can start building wealth today.
★ 16 Hours of Video Lessons + eBook ★
★ Complete Financial Analysis Lessons ★
★ 6 Proven Investing Strategies ★
★ Professional Grade Stock Chart Analysis Classes ★
Practical Trading Applications
In this section, you’ll discover how to integrate the Supertrend indicator into your trading strategy. This will enable you to make informed decisions on entry and exit points and customize parameters to fit your trading style.
Intraday Trading with Supertrend
The Supertrend indicator can be useful during intraday trading if tuned correctly. The default setting of 14 is not profitable; you must backtest different settings for the timeframe you use.
Customizing Supertrend Parameters
Customization is crucial to tailor the Supertrend to your trading needs. Default parameters are generally set to a factor of 3 and a period of 14. However, you can adjust these to calibrate the indicator’s sensitivity to price changes. A higher factor reduces false signals but may delay entry and exit points. Finding a balance that aligns with your risk tolerance and trading objectives is essential.
False Signals and Market Noise
The Supertrend indicator gives false signals in a sideways consolidating market, which reduces profitability. You need to be aware that periods of high volatility might lead to misleading indications of bullish or bearish trends. To mitigate this, consider applying additional filters or different timeframes to distinguish genuine trends from fleeting fluctuations.
Combining Supertrend with Other Indicators
To increase the effectiveness of your trading with the Supertrend, consider combining it with other indicators such as the Relative Strength Index (RSI), Moving Average Convergence Divergence (MACD), or Parabolic SAR. Here’s a brief overview:
- RSI: Used to identify overbought or oversold conditions with Supertrend signals.
- MACD: Provides insight into the momentum behind price movements, complementing the trend information from Supertrend.
- Parabolic SAR: Offers additional confirmation of the trend direction and potential reversals, supplementing the Supertrend’s insights.
- Heikin Ashi Charts: Heikin Ashi is an incredible chart type that filters out price volatility. In my testing, using a Heikin Ashi chart improves the performance of most indicators.
You can create your unique and profitable system by creatively combining Supertrend signals with these indicators and chart patterns.
FAQ
How can I use the Supertrend indicator for effective buy and sell strategies?
Our research shows the Supertrend indicator, when used in isolation, does not produce effective buy and sell signals. Buy signals are typically generated when the price moves above the indicator line. Sell signals occur when the price falls below the indicator line, changing its color from green to red.
What is the best software for trading Supertrend?
The best software for trading the Supertrend indicator are TradingView and TrendSpider. TrendSpider holds the advantage because it also has point-and-click backtesting for optimizing the indicator.
Is Supertrend a reliable and profitable indicator?
No, according to our testing, Supertrend is neither reliable nor profitable when used as a standalone indicator. With an average profit expectancy of 0.24, Supertrend should only be used in combination with other indicators.
Can I adjust the settings of the Supertrend indicator?
Yes, you can and should adjust the settings of the Supertrend indicator according to your trading style and preference. The two main parameters that can be adjusted are the period length and the multiplier factor. A longer period length will result in smoother but slower signals, while a shorter period length will produce more responsive but potentially false signals.
What is the optimal Supertrend indicator strategy for traders?
Our testing suggests the optimal Supertrend strategy is using the indicator in combination with a Heikin Ashi chart and other profitable indicators and proven patterns. Get creative in these combinations and use backtesting to test the results.
Which settings are recommended for the Supertrend indicator when scalping?
For scalping, traders often adjust the settings to a lower period and multiplier, such as 7 for period and 2 for multiplier, to obtain more timely signals. However, these settings must be fine-tuned based on the asset's volatility and the trader’s preference for signal sensitivity.
How do traders interpret Supertrend parameters, such as 7 and 3?
Parameters 7 and 3 in the Supertrend indicator represent the period and the multiplier, respectively. The period dictates how many past data points are included in the calculation, while the multiplier affects the band's distance from the price. A 7-period and a 3-multiplier setup is commonly used for daily charts to balance signal frequency and accuracy.

