Beta in stocks is a financial metric that defines the volatility and the risk of a stock or portfolio.
Beta is not a perfect measure, but it helps indicate how a stock will perform in a given market cycle. It measures the sensitivity of a stock’s price movement in relation to the overall market.
A beta value of 1 indicates that the stock moves in line with the market, while a beta less than 1 means it is less volatile than the market. On the other hand, a beta greater than 1 signifies higher volatility compared to the market.
If you’re a stock investor, you’ve likely heard the term “beta.” But what is beta, exactly? And why is it important, and how can you use it to measure and manage risk?
Here are all the facts about beta and the five things you need to know.
Key Takeaways
- Beta measures the volatility of a stock versus the broader market
- Stocks with a beta of 1 move in line with the market,
- Low beta stocks <1 are less volatile, and High beta stocks>1 are more volatile than the market
- Portfolio managers measure the beta of entire portfolios
- There are also negative beta ETFs
What is beta in stocks?
Beta is a financial ratio measuring volatility for individual stocks or portfolios. It quantifies the anticipated fluctuation in stock price in relation to overall market movements. A beta greater than 1.0 implies that the stock is more volatile than the broader market, whereas a beta below 1.0 indicates a stock with lower volatility.
Beta measures a stock’s volatility and its risk compared to a broad market index like the S&P 500. The S&P 500 has a beta of 1, so if a stock has a beta of 1.2, that stock will generally be 20% more volatile than the market.
What does a stock’s beta mean?
A stock with a beta higher than one is considered more volatile than the market, while stocks with a beta lower than 1 are more stable. A stock’s beta can range from 0 (no volatility) to infinity (very volatile). For example, a stock’s beta can change over time if the company makes large acquisitions or investments in new projects.
Why do investors use beta?
Investors use beta to assess risk when considering a stock for investment. A higher-beta stock is generally considered more risky, while a lower-beta stock is typically considered less risky. Beta can also help investors identify stocks that may provide higher returns by investing in companies that can grow faster than the overall market.
Understanding beta
If the overall market increases by 1%, a stock with a Beta of 0.8 will be expected to increase by 0.8%. If the market decreases by 1%, a stock with a beta of 0.5% will be expected to decrease by only 0.5%.
Beta, in effect, measures the expected stock price movement compared to the broader market. If you seek to minimize downside risks, you might seek a low-beta stock; if you are looking for stocks to outperform the market, you will seek high-beta stocks.
The formula for beta:
Beta = Covariance of Stock Returns and Market Returns divided by Variance of Market Returns.
That means that beta measures how a stock or portfolio moves in relation to the market. A stock with a beta of one moves in line with the market, while a stock with a higher beta (greater than 1) is more volatile than the market.
What is beta covariance?
Beta covariance is the relationship between two stocks and how they move in relation to the market. It measures how much stock A will move when stock B moves. For example, if stock A has a beta of 1 and stock B has a beta of 2, then when the market moves by 1%, stock A will move by 1%, and Stock B will move by 2%.
What is beta’s variance?
Beta variance measures how much a stock or portfolio’s returns fluctuate in relation to the market. The higher the beta variance, the more volatile the stock or portfolio will be compared to the overall market. Beta variance measures how much of a change in return on a stock can be attributed to changes in the market.
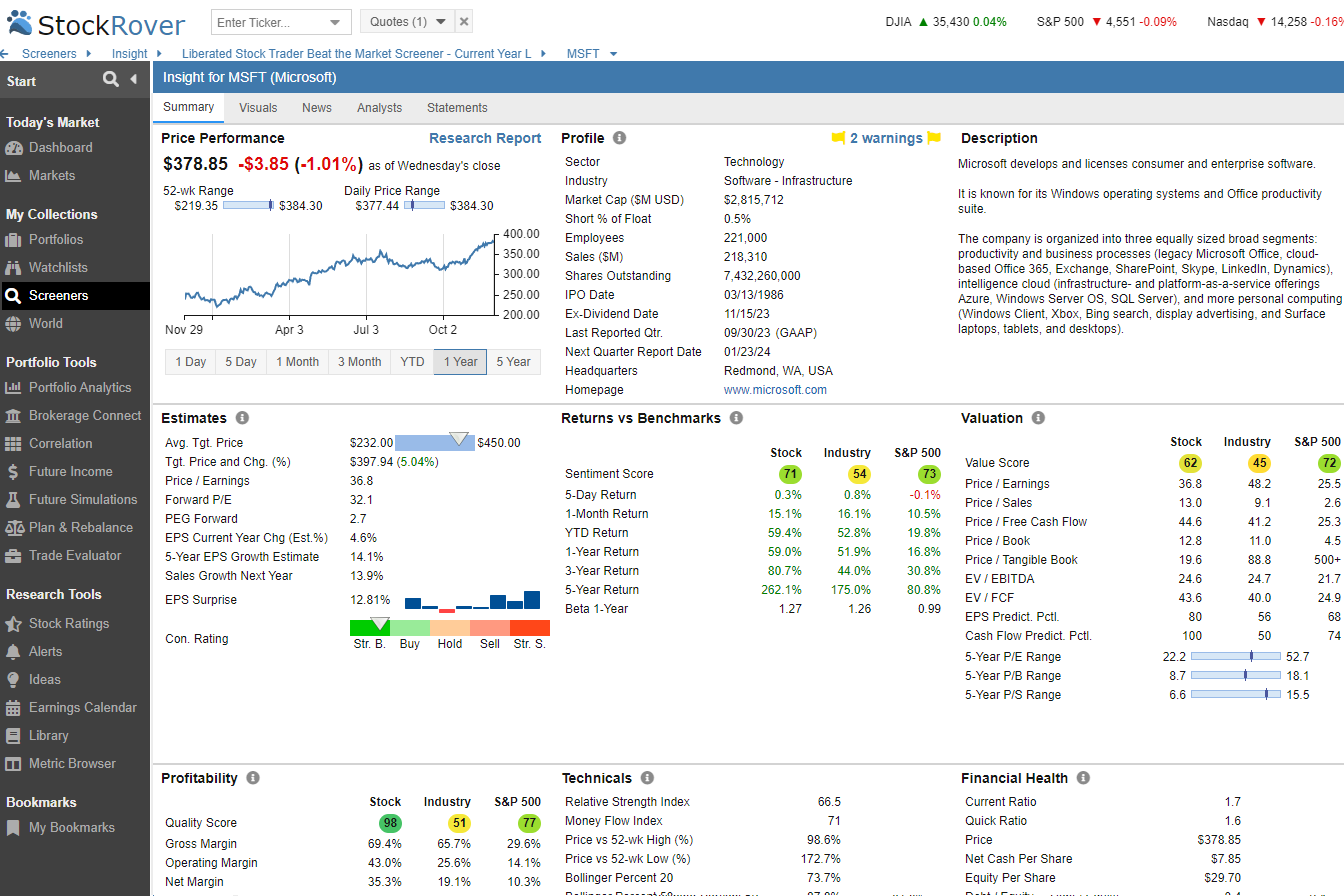
Try Powerful Financial Analysis & Research with Stock Rover
5 Important points about beta
1. Beta is a measure of volatility.
Beta measures how much a stock’s price moves in relation to the overall market. A stock with a beta of 1.5 is considered more volatile than the market average, while a stock with a beta of 0.5 is considered less volatile.
2. Beta can be used to manage risk.
By understanding a stock’s beta, investors can make more informed decisions about how much risk they’re comfortable taking. For example, an investor who wants to minimize risk might only invest in stocks with betas below 1.
3. Some stocks don’t have a beta calculation.
For stocks that don’t trade frequently or have enough data available, it’s impossible to calculate beta. In these cases, analysts often use a similar stock’s beta as a stand-in.
4. Beta changes over time.
A stock’s beta isn’t static; it can change as the underlying company’s business and overall market conditions change. That’s why investors need to track a stock’s beta over time and not rely on its historical beta when making investment decisions.
5. How to find a stock’s beta.
Most major financial publications (like The Wall Street Journal or Barron’s) list betas for stocks in their regular market reporting. However, you can easily use a free stock screener like Finviz to find stocks with a high, low, or negative beta.
Example: Using beta in stock investing
An investor who wants to minimize risk might only invest in stocks with betas below 1. For example, investors might invest only in stocks with a beta of 0.5 or less. This would limit the volatility the investor experiences and reduce their overall risk.
On the other hand, an investor looking to maximize returns might look for stocks with a beta of 1.5 or higher. These stocks may be more volatile and have greater potential for large gains and potentially larger losses.
However, it’s important to note that a stock’s beta isn’t static; it can change over time. So, if an investor only invests in stocks with low betas, they need to monitor them regularly to ensure they remain low.
Using beta in portfolio management
Beta is often used in portfolio management as a measure of risk-adjusted return. Beta can be used to compare potential investments and determine which might offer the best risk-adjusted return.
Finding the beta of a stock portfolio
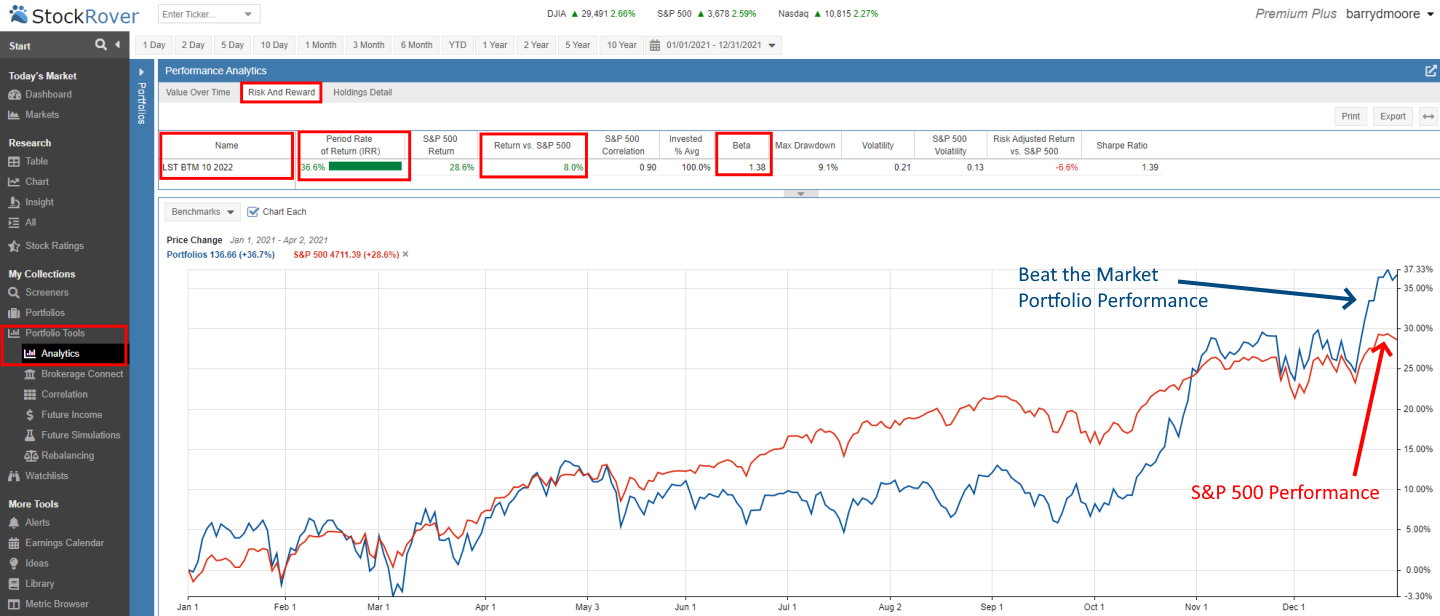
The easiest way to calculate the beta for an entire portfolio is to use a stock screener like Stock Rover. Stock Rover is a free and premium tool that enables powerful stock research, portfolio analysis, and management.
How to find the beta of a portfolio
- Sign up for Stock Rover for Free
- Click Portfolio Tools / Analysis
- Select Risk & Reward
- View the beta for your portfolio
- Compare your portfolio performance against the S&P 500
Investing In Stocks Can Be Complicated, Stock Rover Makes It Easy.
Stock Rover is our #1 rated stock investing tool for:
★ Growth Investing - With industry Leading Research Reports ★
★ Value Investing - Find Value Stocks Using Warren Buffett's Strategies ★
★ Income Investing - Harvest Safe Regular Dividends from Stocks ★
"I have been researching and investing in stocks for 20 years! I now manage all my stock investments using Stock Rover." Barry D. Moore - Founder: LiberatedStockTrader.com
What is a high beta for stocks?
A high beta for stocks would be anything over 1.0. A stock with a beta of 1.5 is considered 50% more volatile than the market average, while a stock with a beta of 2.0 is twice as volatile. So, a high beta for stocks would be anything above 1.0.
Why do stocks have a high beta?
Some stocks have a high beta because they are more volatile than the market average. Volatility can be affected by poor earnings announcements or an industry undergoing massive disruption. It could be because the company is doing well, but investors expect it to do even better, so they’re buying shares in anticipation of future growth. It could also be because the company is doing poorly, and investors are selling off their shares in anticipation of a future decline.
For example, a stock with a beta of 2.0 is twice as volatile as the market average. This means its price will likely increase or drop twice as fast as the average stock.
Whatever the reason, investors need to be aware of a stock’s beta before buying shares to understand the amount of risk they’re taking.
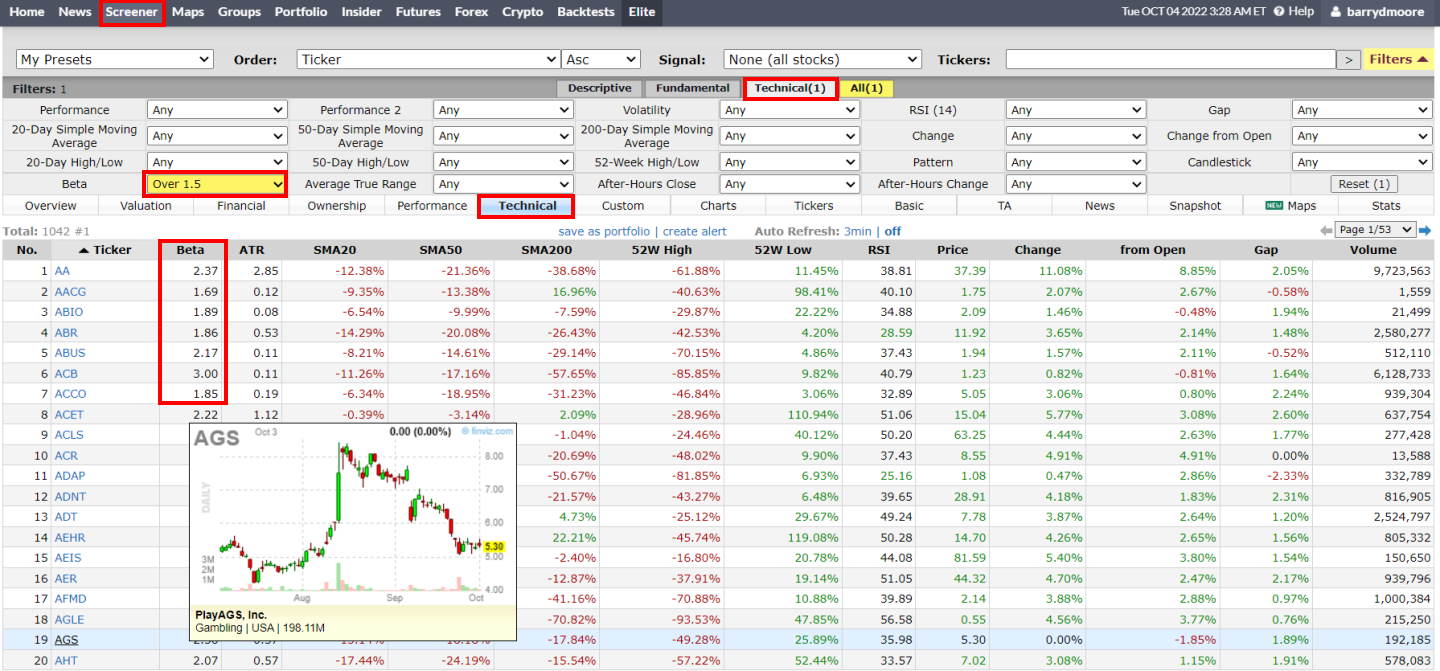
How to find high beta stocks
To easily find a list of high-beta stocks, follow this process:
- Visit Finviz, a free stock screener
- Click screener
- Choose the technical tab
- Select “Over 1” in the beta box
- Select the technical in the column area
What are low-beta stocks?
Low-beta stocks are stocks that have lower-than-average volatility or risk. This means that their prices are less likely to move up and down than the overall market.
There are several reasons why a stock might be less volatile than the market average. It could be because the company is doing well and investors are confident in its future, or it could be because it is doing poorly, but investors think it has a good chance of recovering.
Therefore, low-beta stocks can be a safe investment for investors who want to minimize risk.
What is a low beta for stocks?
A low beta for stocks is typically considered to be a beta of less than 1.0. This means the stock is less volatile than the market average and is a safer investment.
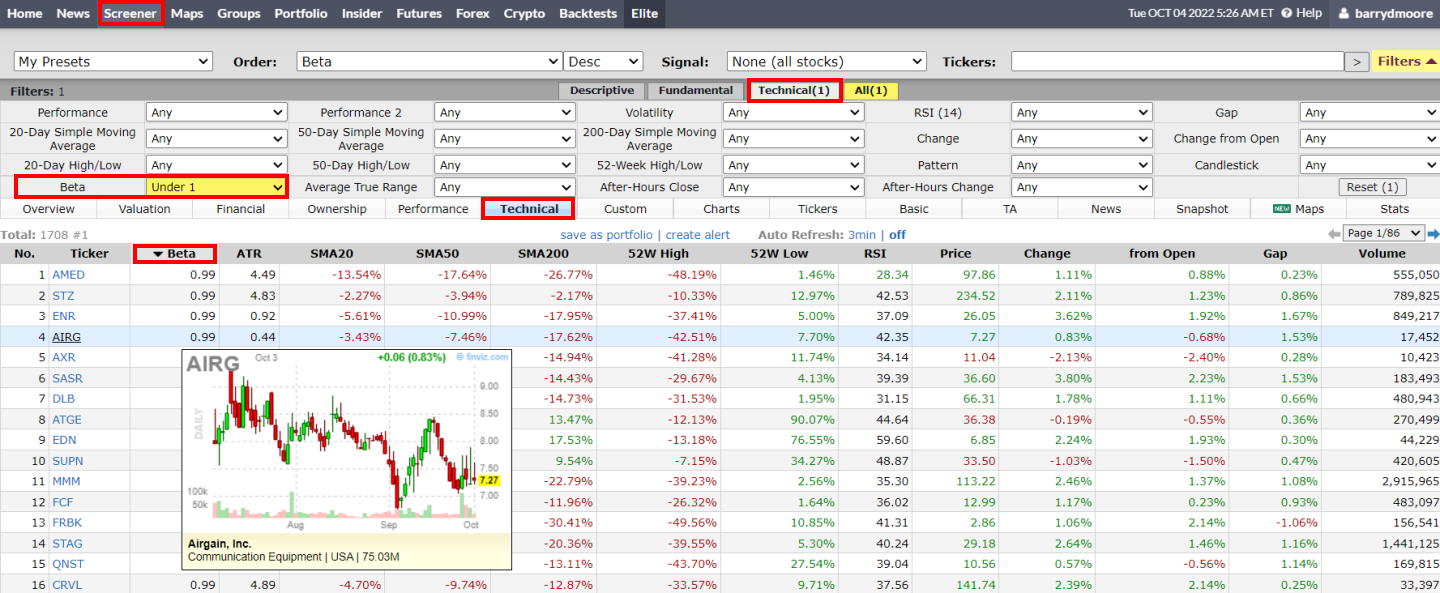
How to find low-beta stocks
To easily find a list of low-beta stocks, follow this process:
- Visit Finviz, a free stock screener
- Click screener
- Choose the technical tab
- Select “Under 1” in the beta box
- Select the technical in the column area
What is a negative beta in stocks?
A stock with a negative beta tends to move in the opposite direction of the overall market index. If the market increases by 1%, a stock with a -1 beta would be expected to fall by 1%.
An example of negative beta in stocks
A negative beta indicates that a security is expected to move in the opposite direction to the market. For example, if the market return is 10% and a security has a beta of -0.5, the security is expected to have a return of -5%. If that same security with a negative Beta of -0.5 is owned during a 20% stock market decline, one might expect the stock to increase by 10%.
Negative beta stocks and market declines
A stock with a negative beta is often considered a safe investment during market turmoil. For example, during the financial crisis of 2008, many investors sought out stocks with negative betas to protect their portfolios from losses.
Utilities, consumer staples, and healthcare companies are some examples of stocks with negative betas. These stocks tend to be less volatile than the overall market and offer investors a measure of protection when the market is going down.
Why are negative beta stocks so rare?
Currently, only 0.2% (less than 100) of US stocks have a negative beta. There are a few reasons why negative beta stocks are rare.
First, finding companies with a consistently negative beta can be difficult. Many companies are cyclical stocks and tend to move with the market.
Second, investors tend to shy away from negative beta stocks because they believe that these stocks will not offer them any upside potential during bull markets.
As a result, these stocks tend to trade at a discount compared to other stocks in the market. Finally, many investors believe that negative beta stocks are riskier than other stocks and unsuitable for all portfolio types.
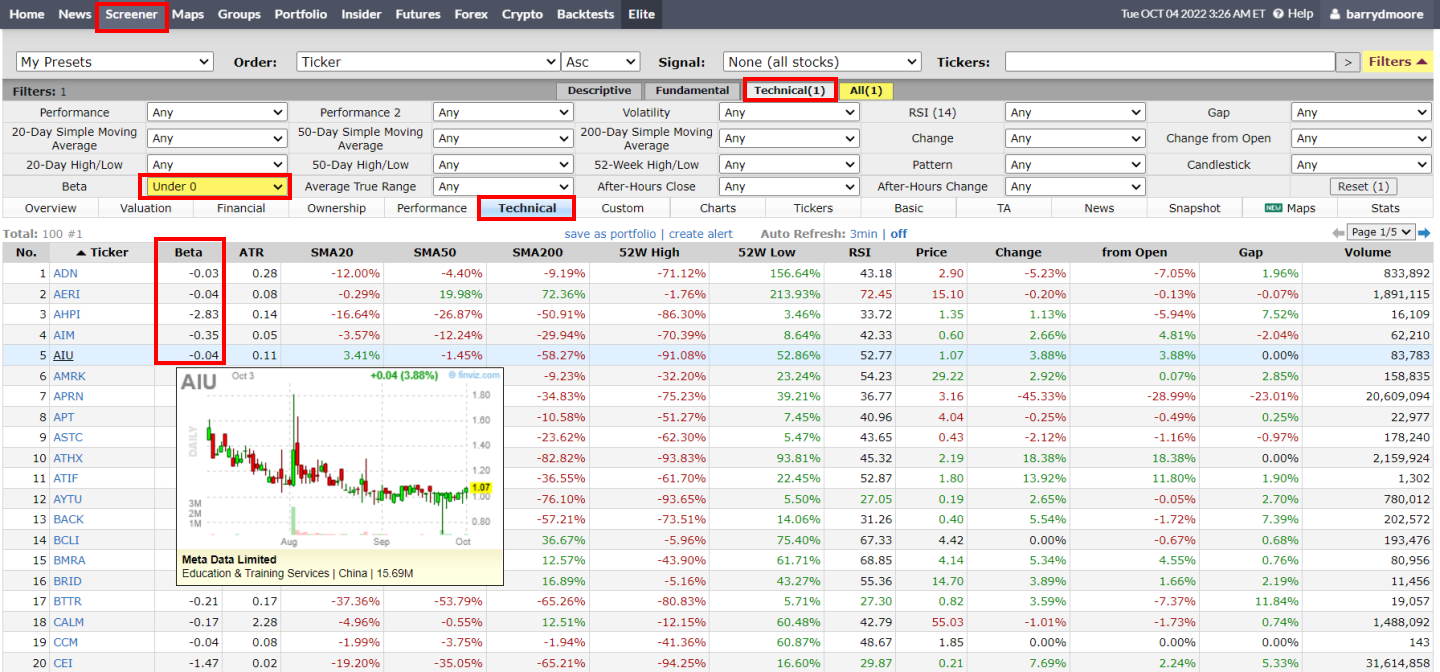
How to find negative beta stocks
To easily find a list of negative beta stocks, follow this process:
- Visit Finviz
- Click screener
- Choose the technical tab
- Select “Under 0” in the beta box
- Select the technical in the column area
What are Negative Beta ETFs?
Negative beta ETFs are exchange-traded funds that invest in stocks with a negative beta. This means that the ETF is expected to move in the opposite direction of the market. As a result, negative beta ETFs can be used to hedge against losses during market turmoil.
Many investors use negative beta ETFs to protect their portfolios from large market swings. By investing in stocks that are expected to move in the opposite direction of the market, investors can help minimize their losses during times of volatility.
Examples of negative beta ETFs
Inverse ETFs are also known as negative beta ETFs. Examples include the ProShares Short S&P500 ETF (SH), the Direxion Daily Small Cap Bear 3X ETF (TZA), and the ProShares UltraShort S&P500 ETF (SPXU).
ProShares UltraPro Short S&P 500 ETF Chart on TradingView
In this chart, the black line is the ProShares UltraShort S&P500 ETF, and the orange line is the S&P 500 Index. This inverse ETF has a negative beta of 3, which corresponds to three times the inverse (-3x) of the S&P 500’s daily performance.
These ETFs use hedging, options, and negative beta stocks to ensure the fund moves in the opposite direction to the benchmark index. For example, the Direxion Daily Financial Bear 3X Shares will have a Beta of -3, as it is designed to move at 3 times in the opposite direction of the market. As a result, they can be used as a tool for hedging against losses. You can also screen for ETFs at TradingView.
How to calculate a stock’s beta
Stock beta is a number that tells you how much the stock moves compared to the market. A beta of 1 means that the stock moves as much as the market, while a beta of 0 means that the stock moves less than the market. A beta over 1 means that the stock moves more than the market.
Some stocks have a negative beta, which means they move in the opposite direction of the market. For example, if the market goes down 1%, a stock with a beta of -1 would go up 1%.
You can calculate a stock’s beta by regressing the stock’s return against the market’s return. Beta is the slope of this line.
To calculate beta, you need two things:
- The historical price data for both the stock and the market
- The historical return data for both the stock and the market
You can get this data from a financial website like TradingView. Once you have this data, you can use a spreadsheet program like Excel to calculate beta.
How to calculate beta in Excel
- Enter the stock’s price data into one column and the market’s price data into another.
- Calculate the return for each period by subtracting the previous period’s closing price from the current period’s closing price and dividing it by the previous period’s closing price.
- Enter these return figures into two more columns, one for the stock and one for the market.
- Highlight the four columns of data.
- Click on the “Data” tab and select “Data Analysis.”
- Choose “Regression” from the list of options.
- Select the stock’s return column as the “Y Variable” and the market’s return column as the “X Variable.”
- Click on the “Output Options” button and choose to output the regression table.
- Click on the “OK” button.
The beta will be listed in the regression output table. A beta of 1 means that the stock moves as much as the market, while a beta of 0 means that the stock moves less than the market. A beta over 1 means that the stock moves more than the market.
Some stocks have a negative beta, which means they move in the opposite direction of the market. For example, if the market goes down 1%, a stock with a beta of -1 would go up 1%.
The drawbacks of beta
The main disadvantage of using beta as a measure of risk is that it doesn’t consider individual stock characteristics. For example, a high-beta stock might be riskier than a low-beta stock but could offer higher returns. Therefore, using beta as the only measure of risk can lead to inaccurate conclusions.
Another disadvantage of beta is that it only looks at historical data, which may not represent future movements. For example, a stock could have a high beta during a bull market but a low beta during a bear market. This would create the false impression that the stock is riskier than it actually is.
The last disadvantage of beta is that it’s calculated using past data, which may not indicate future movements. Beta is based on the assumption that past behavior will continue, but this isn’t always the case. For example, a company could restructure its business and reduce its risk, but this wouldn’t be reflected in its beta in the near term.
Conclusion
In conclusion, while beta can be a useful measure of risk, it has several disadvantages that should be considered before making investment decisions.
So there, you have five things to know about beta and why it matters to investors. By understanding beta, you can make more informed decisions about which stocks to buy (and sell) and how to manage your overall portfolio risk.
FAQ
What software can find and filter stock beta?
Stock screening software such as Finviz, Stock Rover, and Portfolio123 can help you find stocks with a specific beta. These services allow you to filter for stocks with specific financial criteria, including the stock's beta.
What is stock beta?
Stock Beta is a statistical tool that assesses the volatility of returns on a particular stock in relation to the overall market. It quantifies the systematic risk associated with an investment, offering valuable insights for investors.
How is beta calculated?
Beta is determined through regression analysis, which establishes a correlation between the returns of a specific stock and the overall market's returns. This quantification assists in measuring the stock's risk and its relation to market movements.
What does a beta value of 1 mean?
A Beta of 1 indicates that the stock's price moves in sync with the market. When the market rises by 1%, the stock price is expected to increase by 1%. This correlation signifies the close relationship between the stock and overall market movements.
What does a negative beta mean?
An asset with a negative beta indicates an inverse correlation with the overall market. This means that when the market experiences an increase, the stock's price tends to decrease, and vice versa.
Is a higher stock beta better or worse?
A higher beta is favorable for long-term growth investors in an expanding market because the stock grows faster than the market. Conversely, a higher stock beta is detrimental to investors in a market downturn as the stock will decline more rapidly than the market.
How can beta help in investment decisions?
Beta can help investors understand the risk associated with a particular stock. It can help determine how much a stock tends to move with or against the overall market, aiding portfolio diversification and risk management.
Can Stock beta predict future performance?
No, stock beta is not an indicator of future performance. Beta only measures the past trends of a stock market correlation but can't predict the future. Factors like company fundamentals and economic conditions also impact a stock's future performance.
What is the difference between Alpha and Beta in stocks?
Alpha measures the difference between a stock's actual returns and expected performance based on market movements. Beta, on the other hand, measures the correlation of a stock to its benchmark index. Alpha is used to measure an investment manager's performance, while beta is used to measure risk.
Is Stock Beta the same for all markets?
No, beta varies across different markets and is often benchmarked against indices such as the S&P 500 for U.S. stocks. It's important to note that a stock's beta may differ when compared to various market indices.
Can Stock Beta change over time?
Yes, a stock's beta can change over time as the company's fundamentals or market conditions change. It's important to monitor beta over time to track changes in a stock's risk profile.
What does a Stock Beta greater than 1 mean?
A beta value greater than 1 indicates that the stock tends to be more volatile than the market. This implies that when the market experiences a 1% increase, the stock's price is expected to rise by a proportion greater than 1%.
What is the significance of a Stock Beta less than 1?
A beta value of less than 1 suggests that the stock exhibits lower volatility than the market. This indicates that changes in the stock's price are expected to be relatively more stable and moderate when compared to the overall market fluctuations.

