The Yacktman Forward Rate of Return (FROR) is a financial metric for investors looking to generate higher returns with reduced risk.
The Yacktman forward rate of return estimates the future potential return of an investment based on expected earnings and growth rate, helping investors assess a stock’s potential value.
This metric estimates the future rate of return by taking into account factors like expected future cash flows, growth potential, and a stock’s current market price.
Key Takeaways
- The Yacktman Forward Rate of Return helps determine expected annual stock returns.
- Donald Yacktman’s method focuses on undervalued companies with growth potential.
- This metric aids in balancing the expected rate of returns and risk.
- A value above 10% is considered good.
Understanding this metric can be crucial for anyone involved in value investing. Yacktman’s strategy of focusing on beaten-down but fundamentally strong companies has proven successful.

Understanding the Yacktman Forward Rate of Return
Developed by Donald Yacktman, this approach has made Yacktman Asset Management a reputable name in the investment world.
Yacktman emphasizes investing in companies that are undervalued but show promising growth prospects. This technique allows for a balance between risk and reward, providing investors with a structured method to predict returns.
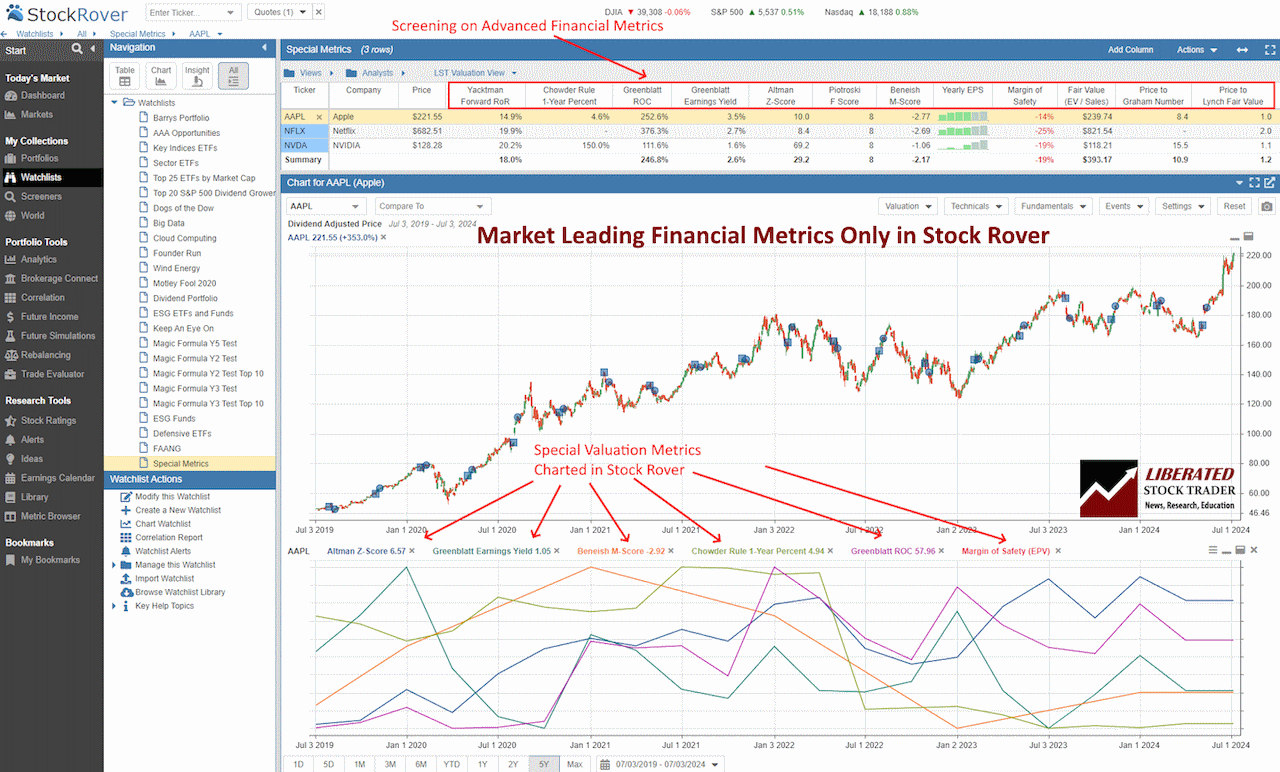
Charting & Screening the Yacktman Forward Rate of Return
You do not need to calculate the Yacktman FROR manually; Stock Rover does it for you. Only Stock Rover provides advanced financial metrics, such as the Greenblatt ROC, Greenblatt Earnings Yield, Altman Z-Score, Piotroski F-Score, Beneish M-Score, Graham Number, Chowder Rule, and the Sharpe ratio.
The chart screenshot below shows the Yacktman Forward Rate of Return plotted over time.

Chart & Screen the Yacktman Forward Rate of Return with Stock Rover
The Formula
The calculation for the Yacktman Forward Rate of Return involves several components: earnings, price, and dividends.
Earnings refer to a company’s profits or net income. Price is the current stock price, which reflects market sentiment and expectations. Dividends are the portion of a company’s profits distributed to shareholders as cash payments.
The formula:
Yacktman Forward Rate of Return = (Estimated Future Earnings + Estimated Growth Rate) / Current Stock Price
This formula allows investors to analyze a company’s potential return by considering both its current financial performance and market expectations. By focusing on undervalued companies, Yacktman looks for opportunities where the market has underestimated the potential growth and profitability of a company.
How It Works
The Yacktman Forward Rate of Return estimates an investment’s future potential return based on expected earnings and growth rate. Using the current stock price, investors can determine whether a company is undervalued or overvalued in relation to its potential for future growth.
A Practical Example
Let’s say company A has an expected earnings growth rate of 10% and a current stock price of $50. Company B, on the other hand, has an expected earnings growth rate of 5% and a current stock price of $100.
First, we calculate each company’s Price-to-Earnings ratio by dividing the current stock price by the expected earnings growth rate.
- For company A: P/E ratio = $50/10 = 5
- For company B: P/E ratio = $100/5 = 20
Next, we use these P/E ratios to calculate the Yacktman Forward Rate of Return using the formula:
Yacktman Forward Rate of Return = Expected Earnings Growth Rate / P/E ratio
- For company A: Yacktman Forward Rate of Return = 10%/5 = 2%
- For company B: Yacktman Forward Rate of Return = 5%/20 = 0.25%
Based on these calculations, it is clear that company A has a higher Yacktman Forward Rate of Return, indicating that it may be a better investment choice. This method allows investors to compare two companies with different stock prices and earnings growth rates in order to decide where to invest their money.
Alternative Calculation Methodology
Calculating the Yacktman Forward Rate of Return requires gathering accurate data on a company’s future earnings, current price, and expected growth rate.
- Identify Earnings: Evaluate the company’s projected earnings for the next year.
- Determine Price: Note the current stock price.
- Estimate Growth Rate: Analyze historical data and market conditions to estimate earnings growth.
Combine these values using the formula to derive the forward rate. For instance, if a company expects earnings of $5 per share, the current price is $100, and the anticipated growth rate is 6%, the forward rate of return is ( 0.05 + 0.06 = 0.11 ) or 11%.
Using the Yacktman Forward Rate of Return in Stock Selection
Using the Yacktman FRR in combination with the LST Beat the Market System (powered by Stock Rover), you can see the loose correlation between expected returns and actual returns. (See table below)
| Ticker | Company | Yacktman Forward RoR | EPS | Greenblatt ROC | Greenblatt Earnings Yield | 1-Year Return vs S&P 500 | EPS 1-Year Chg (%) |
| LPG | Dorian LPG | 25.40% | $7.63 | 20.40% | 15.10% | 51.50% | 53.50% |
| OSG | Overseas Shipholding Gr | 25.00% | $0.85 | 11.80% | 9.50% | 77.00% | 51.90% |
| WLDN | Willdan Group | 23.90% | $0.97 | 21.10% | 5.40% | 27.50% | 1075.00% |
| KGC | Kinross Gold | 22.40% | $0.36 | 10.10% | 6.60% | 67.00% | 125.00% |
| WAB | Westinghouse Air Brake | 22.30% | $5.14 | 46.60% | 4.60% | 16.60% | 36.80% |
| POWL | Powell Industries | 22.00% | $8.59 | 31.30% | 9.00% | 111.00% | 176.40% |
| CCJ | Cameco | 21.30% | $0.39 | 12.30% | 1.40% | 48.50% | 145.50% |
| DY | Dycom Industries | 21.10% | $7.86 | 21.60% | 6.10% | 22.10% | 33.30% |
| EURN | Euronav | 21.00% | $5.84 | 43.70% | 30.40% | 30.10% | 100.00% |
| NBIX | Neurocrine Biosciences | 20.90% | $3.78 | 33.10% | 3.40% | 24.30% | 106.70% |
| NSSC | NAPCO Security Techs | 20.50% | $1.28 | 33.80% | 2.70% | 34.40% | 72.60% |
| EME | EMCOR Group | 18.80% | $15.22 | 62.80% | 5.90% | 71.10% | 51.30% |
| NVO | Novo Nordisk | 17.80% | $2.88 | 115.40% | 2.60% | 52.60% | 33.80% |
| AGS | PlayAGS | 15.30% | $0.13 | 33.30% | 6.80% | 80.10% | 33.30% |
| MLR | Miller Industries | 12.70% | $5.78 | 22.40% | 13.80% | 30.90% | 70.00% |
| AROC | Archrock | 9.90% | $0.83 | 12.00% | 6.10% | 80.30% | 97.60% |
| IHG | InterContinental Hotels | 9.70% | $4.44 | 266.00% | 5.80% | 28.50% | 25.00% |
| KEX | Kirby | 8.30% | $4.26 | 73.00% | 4.70% | 27.60% | 45.90% |
| ATGE | Adtalem Glb Education | 7.60% | $2.72 | 44.50% | 6.20% | 61.50% | 19.30% |
| EDU | New Oriental Education | 6.60% | $1.90 | 14.40% | 5.40% | 62.90% | 80.00% |
| CRS | Carpenter Tech | 4.50% | $2.66 | 9.90% | 3.90% | 73.70% | 130.70% |
| SCS | Steelcase | -0.30% | $0.76 | 17.40% | 7.80% | 41.90% | 85.40% |
| HWM | Howmet Aerospace | -2.00% | $2.08 | 32.20% | 3.50% | 34.70% | 64.30% |
Comparison with Traditional Metrics
Traditional metrics like the P/E ratio and dividend yield assess stock value based on current earnings and payout. While useful, they do not consider long-term growth potential.
The Yacktman Metric combines these traditional metrics with potential earnings growth, giving a more comprehensive view. It evaluates stocks on the projected rate of return, factoring in both earnings and growth opportunities.
This holistic approach helps value investors make informed decisions, aligning with long-term investment goals rather than short-term market fluctuations.
Investing In Stocks Can Be Complicated, Stock Rover Makes It Easy.
Stock Rover is our #1 rated stock investing tool for:
★ Growth Investing - With industry Leading Research Reports ★
★ Value Investing - Find Value Stocks Using Warren Buffett's Strategies ★
★ Income Investing - Harvest Safe Regular Dividends from Stocks ★

"I have been researching and investing in stocks for 20 years! I now manage all my stock investments using Stock Rover." Barry D. Moore - Founder: LiberatedStockTrader.com
Risk and Value Assessment
Risk assessment is a core component of the Yacktman Metric. It focuses on understanding both the potential upside and downside of investing in a particular stock. The metric evaluates the dividend yield and anticipated earnings to determine the stock’s stability and potential returns.
By analyzing these factors, investors can gauge the risk involved. The aim is to invest in stocks that offer a reasonable rate of return with manageable risk levels, ensuring a balanced portfolio.
This method helps investors avoid overvalued stocks and identify those with strong growth potential, leading to more stable and profitable investments.
Application in Investment Strategies
The Yacktman Forward Rate of Return is a valuable tool for identifying investment opportunities. By focusing on high-quality businesses, timing, and portfolio management, investors can achieve better returns with reduced risk.
Identifying High-Quality Businesses
A key aspect of applying the Yacktman Forward Rate of Return is finding businesses that exhibit strong growth potential. These businesses typically have solid management and consistent earnings. They often maintain a competitive edge in their industry.
Valuation is crucial when identifying these high-quality companies. Investors should look for stocks that are trading at a low purchase price relative to their potential future earnings. This increases the likelihood of achieving a higher return on investment while minimizing risks.
Timing and Patience
Timing is another important factor when using the Yacktman Forward Rate of Return. Investors should wait for the right time to buy stocks, which often means being patient. Markets can be volatile, and having the discipline to wait for favorable conditions is essential.
Buying stocks when they are undervalued can provide a significant upside when the market corrects and valuations align more closely with the intrinsic value of the business. This patient approach ensures that investments are made at the most opportune moments, maximizing returns.
Portfolio Management
Effective portfolio management involves balancing various stocks to minimize risk and enhance potential returns. Portfolio managers can use the Yacktman Forward Rate of Return to evaluate each stock’s potential and decide how much capital to allocate.
Maintaining a diverse portfolio of high-quality businesses helps mitigate risks associated with any single investment. Discipline in the decision-making process ensures that only stocks meeting certain criteria are included, leading to a more stable and potentially more profitable portfolio.

Try Powerful Financial Analysis & Research with Stock Rover
Challenges and Considerations
When evaluating the Yacktman Forward Rate of Return, it’s essential to understand how various factors such as inflation, management strategies, and maintaining objectivity in valuation can impact calculations and outcomes.
Impact of Inflation and Market Dynamics
Inflation can significantly affect the forward rate of return. If inflation rates are high, the real rate of return may be lower than expected, as inflation eats into the investment’s gains. Investors need to account for the current inflation rate and potential changes in the market.
Market dynamics, such as shifts in supply and demand, also play a crucial role. For instance, if a company loses market share to competitors, its potential returns may decrease. Therefore, understanding market trends, competition, and economic factors is vital for accurate predictions.
Maintaining Objectivity in Valuation
Objectivity in valuation is critical when calculating the Yacktman Forward Rate of Return. Personal biases or over-optimistic projections can lead to incorrect assessments. Investors should rely on robust data and tried-and-tested valuation methods.
Using historical data, comparative analysis, and industry benchmarks helps maintain objectivity. It is also important to continually update assumptions and forecasts to reflect the latest market and company-specific information. This ensures that the valuation remains aligned with actual market conditions and performance potential.
FAQ
How is the Forward Rate of Return calculated in investment analysis?
The Forward Rate of Return in investment analysis is calculated by estimating the future cash flow a stock will generate and then discounting it back to its present value. This involves considering factors like earnings growth, dividends, and future profit margins.
What is the best software for charting and analyzing the Yacktman Forward Rate of Return?
Stock Rover is the best software for screening and charting advanced financial metrics like the Yacktman Forward Rate of Return. Our testing shows it offers the widest array of metrics and ratios available on the market today.
What distinguishes the Yacktman Forward Rate of Return from other return metrics?
The Yacktman Forward Rate of Return is distinct because it focuses on future cash flow rather than historical performance. It emphasizes the present value of future returns, accounting for the expected growth and profitability of the company.
Is there a good screener available to identify the Yacktman Forward Rate of Return?
Yes, Stock Rover provides a screener that can filter stocks based on their Yacktman Forward Rate of Return. It helps investors quickly identify undervalued companies.
Can the Forward Rate of Return predict future stock performance accurately?
The Forward Rate of Return can offer a useful estimate of future performance. However, it is not always accurate as it depends on projections that may not come true. Market conditions, changes in management, and economic factors can impact accuracy.
How does the Yacktman Forward Rate of Return impact investment decision-making?
The Yacktman Forward Rate of Return influences investment decisions as it helps investors determine if a stock is undervalued or overvalued. This calculation aids in identifying potential investment opportunities by focusing on long-term profitability.
What are the limitations of using the Forward Rate of Return in evaluating a company?
The Forward Rate of Return has limitations. It relies heavily on accurate projections, which can be uncertain. External factors like market volatility and regulatory changes can also impact the predicted returns, making it a challenge to rely solely on this metric.
How often should the Forward Rate of Return be reviewed for a comprehensive portfolio analysis?
Reviewing the Forward Rate of Return should be done periodically, ideally quarterly or annually, to account for changes in market conditions and company performance. Regular updates help maintain an accurate assessment of the investment's potential and adjust the portfolio accordingly.
My thorough testing awarded TradingView a stellar 4.8 stars!
With powerful stock chart analysis, pattern recognition, screening, backtesting, and a 20+ million user community, it’s a game-changer for traders.

Whether you're trading in the US or internationally, TradingView is my top pick for its unmatched features and ease of use.
Explore TradingView – Your Gateway to Smarter Trading!
